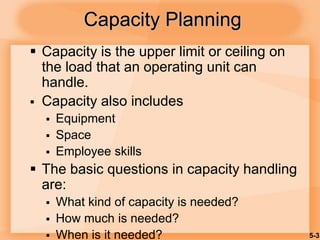
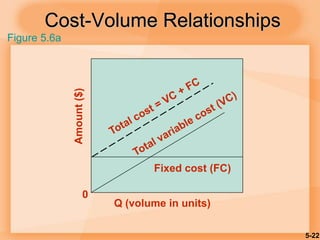
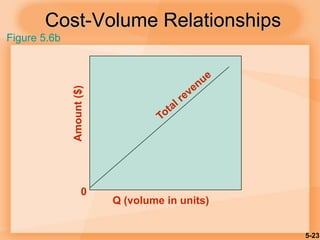
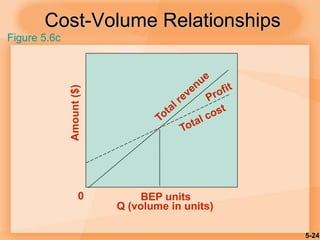
McGraw-Hill/Irwin Copyright © 2007 by The McGraw-Hill Companies, Inc. All rights reserved.
5
Capacity Planning
For Products and
Services
5-2
Learning Objectives
 Explain the importance of capacity
planning.
 Discuss ways of defining and measuring
capacity.
 Describe the determinants of effective
capacity.
 Discuss the major considerations related to
developing capacity alternatives.
 Briefly describe approaches that are useful
for evaluating capacity alternatives
5-3
Capacity Planning
 Capacity is the upper limit or ceiling on
the load that an operating unit can
handle.
 Capacity also includes
 Equipment
 Space
 Employee skills
 The basic questions in capacity handling
are:
 What kind of capacity is needed?
 How much is needed?
 When is it needed?
5-4
1. Impacts ability to meet future demands
2. Affects operating costs
3. Major determinant of initial costs
4. Involves long-term commitment
5. Affects competitiveness
6. Affects ease of management
7. Globalization adds complexity
8. Impacts long range planning
Importance of Capacity Decisions
5-5
Capacity
 Design capacity
 …
 Effective capacity
 …
 Actual output
 …
5-6
Efficiency and Utilization
Actual output
Efficiency =
Effective capacity
Actual output
Utilization =
Design capacity
Both measures expressed as percentages
5-7
Actual output = units/day
Efficiency = =
Effective capacity units/ day
Utilization = Actual output = units/day
=
Design capacity units/day
Efficiency/Utilization Example
Design capacity = 50 trucks/day
Effective capacity = 40 trucks/day
Actual output = 36 trucks/day
5-8
Determinants of Effective
Capacity
 Facilities
 Product and service factors
 Process factors
 Human factors
 Policy factors
 Operational factors
 Supply chain factors
 External factors
5-9
Strategy Formulation
 Capacity strategy for long-term demand
 Demand patterns
 Growth rate and variability
 Facilities
 Cost of building and operating
 Technological changes
 Rate and direction of technology changes
 Behavior of competitors
 Availability of capital and other inputs
5-10
Key Decisions of Capacity
Planning
1. Amount of capacity needed
• Capacity cushion (100% - Utilization)
2. Timing of changes
3. Need to maintain balance
4. Extent of flexibility of facilities
Capacity cushion – extra demand intended to offset uncertainty
5-11
Forecasting Capacity
Requirements
 Long-term vs. short-term capacity needs
 Long-term relates to overall level of capacity
such as facility size, trends, and cycles
 Short-term relates to variations from
seasonal, random, and irregular fluctuations
in demand
5-12
Calculating Processing
Requirements
Product
Annual
Demand
Standard
processing time
per unit (hr.)
Processing time
needed (hr.)
#1
#2
#3
Total
400
300
700
5.0
8.0
2.0
Tot
If annual capacity is 2000 hours, then how many machines do we need to
handle the required volume of …. ?
5-13
 Need to be near customers
 Capacity and location are closely tied
 Inability to store services
 Capacity must be matched with timing of
demand
 Degree of volatility of demand
 Peak demand periods
Planning Service Capacity
5-14
In-House or Outsourcing
1. Available capacity
2. Expertise
3. Quality considerations
4. Nature of demand
5. Cost
6. Risk
Outsource: obtain a good or service
from an external provider
5-15
Developing Capacity Alternatives
1.Design flexibility into systems
2.Take stage of life cycle into account
3.Take a “big picture” approach to capacity
changes
4.Prepare to deal with capacity “chunks”
5.Attempt to smooth out capacity
requirements
6.Identify the optimal operating level
5-16
Bottleneck Operation
Figure 5.2
Machine #2
Bottleneck
Operation
Machine #1
Machine #3
Machine #4
10/hr
10/hr
10/hr
10/hr
30/hr
Bottleneck operation: An operation
in a sequence of operations whose
capacity is lower than that of the
other operations
5-17
Bottleneck Operation
Operation 1
20/hr.
Operation 2
10/hr.
Operation 3
15/hr.
?
Which operation is the Bottleneck operation?
Maximum output rate
limited by bottleneck
5-18
Economies of Scale
 Economies of scale
 If the output rate is less than the optimal level,
increasing output rate results in decreasing
average unit costs
 Diseconomies of scale
 If the output rate is more than the optimal
level, increasing the output rate results in
increasing average unit costs
5-19
Optimal Rate of Output
Minimum
cost
Averagecostperunit
0 Rate of output
Production units have an optimal rate of output for minimal cost.
Figure 5.4
Minimum average cost per unit
5-20
Economies of Scale
Minimum cost & optimal operating rate are
functions of size of production unit.Averagecostperunit
0
Small
plant Medium
plant Large
plant
Output rate
Figure 5.5
5-21
Evaluating Alternatives
 Cost-volume analysis
 Break-even point
 Financial analysis
 Cash flow
 Present value
 Decision theory
 Waiting-line analysis
5-22
Cost-Volume Relationships
Amount($)
0
Q (volume in units)
Fixed cost (FC)
Figure 5.6a
5-23
Cost-Volume Relationships
Amount($)
Q (volume in units)
0
Figure 5.6b
5-24
Cost-Volume Relationships
Amount($)
Q (volume in units)
0 BEP units
Figure 5.6c
5-25
Break-Even Problem with Step
Fixed Costs
Quantity
Step fixed costs and variable costs.
1 machine
2 machines
3 machines
Figure 5.7a
5-26
Break-Even Problem with Step
Fixed Costs
$
FC1
FC2
FC3
BEP2
BEP
3
Quantity
1
2
3
Multiple break-even points
Figure 5.7b
TP = (P – VC) Q
5-27
1.One product is involved
2.Everything produced can be sold
3.Variable cost per unit is the same
regardless of volume
4.Fixed costs do not change with volume
5.Revenue per unit constant with volume
6.Revenue per unit exceeds variable cost
per unit
Assumptions of Cost-Volume
Analysis
5-28
Financial Analysis
 Cash Flow - the difference between
cash received from sales and other
sources, and cash outflow for labor,
material, overhead, and taxes.
 Present Value - the sum, in current
value, of all future cash flows of an
investment proposal.
5-29
Waiting-Line Analysis
 Useful for designing or modifying service
systems
 Waiting-lines occur across a wide variety of
service systems
 Waiting-lines are caused by bottlenecks in
the process
 Helps managers plan capacity level that will
be cost-effective by balancing the cost of
having customers wait in line with the cost of
additional capacity

Capacity planning ppt

  • 1.
    McGraw-Hill/Irwin Copyright ©2007 by The McGraw-Hill Companies, Inc. All rights reserved. 5 Capacity Planning For Products and Services
  • 2.
    5-2 Learning Objectives  Explainthe importance of capacity planning.  Discuss ways of defining and measuring capacity.  Describe the determinants of effective capacity.  Discuss the major considerations related to developing capacity alternatives.  Briefly describe approaches that are useful for evaluating capacity alternatives
  • 3.
    5-3 Capacity Planning  Capacityis the upper limit or ceiling on the load that an operating unit can handle.  Capacity also includes  Equipment  Space  Employee skills  The basic questions in capacity handling are:  What kind of capacity is needed?  How much is needed?  When is it needed?
  • 4.
    5-4 1. Impacts abilityto meet future demands 2. Affects operating costs 3. Major determinant of initial costs 4. Involves long-term commitment 5. Affects competitiveness 6. Affects ease of management 7. Globalization adds complexity 8. Impacts long range planning Importance of Capacity Decisions
  • 5.
    5-5 Capacity  Design capacity …  Effective capacity  …  Actual output  …
  • 6.
    5-6 Efficiency and Utilization Actualoutput Efficiency = Effective capacity Actual output Utilization = Design capacity Both measures expressed as percentages
  • 7.
    5-7 Actual output =units/day Efficiency = = Effective capacity units/ day Utilization = Actual output = units/day = Design capacity units/day Efficiency/Utilization Example Design capacity = 50 trucks/day Effective capacity = 40 trucks/day Actual output = 36 trucks/day
  • 8.
    5-8 Determinants of Effective Capacity Facilities  Product and service factors  Process factors  Human factors  Policy factors  Operational factors  Supply chain factors  External factors
  • 9.
    5-9 Strategy Formulation  Capacitystrategy for long-term demand  Demand patterns  Growth rate and variability  Facilities  Cost of building and operating  Technological changes  Rate and direction of technology changes  Behavior of competitors  Availability of capital and other inputs
  • 10.
    5-10 Key Decisions ofCapacity Planning 1. Amount of capacity needed • Capacity cushion (100% - Utilization) 2. Timing of changes 3. Need to maintain balance 4. Extent of flexibility of facilities Capacity cushion – extra demand intended to offset uncertainty
  • 11.
    5-11 Forecasting Capacity Requirements  Long-termvs. short-term capacity needs  Long-term relates to overall level of capacity such as facility size, trends, and cycles  Short-term relates to variations from seasonal, random, and irregular fluctuations in demand
  • 12.
    5-12 Calculating Processing Requirements Product Annual Demand Standard processing time perunit (hr.) Processing time needed (hr.) #1 #2 #3 Total 400 300 700 5.0 8.0 2.0 Tot If annual capacity is 2000 hours, then how many machines do we need to handle the required volume of …. ?
  • 13.
    5-13  Need tobe near customers  Capacity and location are closely tied  Inability to store services  Capacity must be matched with timing of demand  Degree of volatility of demand  Peak demand periods Planning Service Capacity
  • 14.
    5-14 In-House or Outsourcing 1.Available capacity 2. Expertise 3. Quality considerations 4. Nature of demand 5. Cost 6. Risk Outsource: obtain a good or service from an external provider
  • 15.
    5-15 Developing Capacity Alternatives 1.Designflexibility into systems 2.Take stage of life cycle into account 3.Take a “big picture” approach to capacity changes 4.Prepare to deal with capacity “chunks” 5.Attempt to smooth out capacity requirements 6.Identify the optimal operating level
  • 16.
    5-16 Bottleneck Operation Figure 5.2 Machine#2 Bottleneck Operation Machine #1 Machine #3 Machine #4 10/hr 10/hr 10/hr 10/hr 30/hr Bottleneck operation: An operation in a sequence of operations whose capacity is lower than that of the other operations
  • 17.
    5-17 Bottleneck Operation Operation 1 20/hr. Operation2 10/hr. Operation 3 15/hr. ? Which operation is the Bottleneck operation? Maximum output rate limited by bottleneck
  • 18.
    5-18 Economies of Scale Economies of scale  If the output rate is less than the optimal level, increasing output rate results in decreasing average unit costs  Diseconomies of scale  If the output rate is more than the optimal level, increasing the output rate results in increasing average unit costs
  • 19.
    5-19 Optimal Rate ofOutput Minimum cost Averagecostperunit 0 Rate of output Production units have an optimal rate of output for minimal cost. Figure 5.4 Minimum average cost per unit
  • 20.
    5-20 Economies of Scale Minimumcost & optimal operating rate are functions of size of production unit.Averagecostperunit 0 Small plant Medium plant Large plant Output rate Figure 5.5
  • 21.
    5-21 Evaluating Alternatives  Cost-volumeanalysis  Break-even point  Financial analysis  Cash flow  Present value  Decision theory  Waiting-line analysis
  • 22.
    5-22 Cost-Volume Relationships Amount($) 0 Q (volumein units) Fixed cost (FC) Figure 5.6a
  • 23.
  • 24.
    5-24 Cost-Volume Relationships Amount($) Q (volumein units) 0 BEP units Figure 5.6c
  • 25.
    5-25 Break-Even Problem withStep Fixed Costs Quantity Step fixed costs and variable costs. 1 machine 2 machines 3 machines Figure 5.7a
  • 26.
    5-26 Break-Even Problem withStep Fixed Costs $ FC1 FC2 FC3 BEP2 BEP 3 Quantity 1 2 3 Multiple break-even points Figure 5.7b TP = (P – VC) Q
  • 27.
    5-27 1.One product isinvolved 2.Everything produced can be sold 3.Variable cost per unit is the same regardless of volume 4.Fixed costs do not change with volume 5.Revenue per unit constant with volume 6.Revenue per unit exceeds variable cost per unit Assumptions of Cost-Volume Analysis
  • 28.
    5-28 Financial Analysis  CashFlow - the difference between cash received from sales and other sources, and cash outflow for labor, material, overhead, and taxes.  Present Value - the sum, in current value, of all future cash flows of an investment proposal.
  • 29.
    5-29 Waiting-Line Analysis  Usefulfor designing or modifying service systems  Waiting-lines occur across a wide variety of service systems  Waiting-lines are caused by bottlenecks in the process  Helps managers plan capacity level that will be cost-effective by balancing the cost of having customers wait in line with the cost of additional capacity