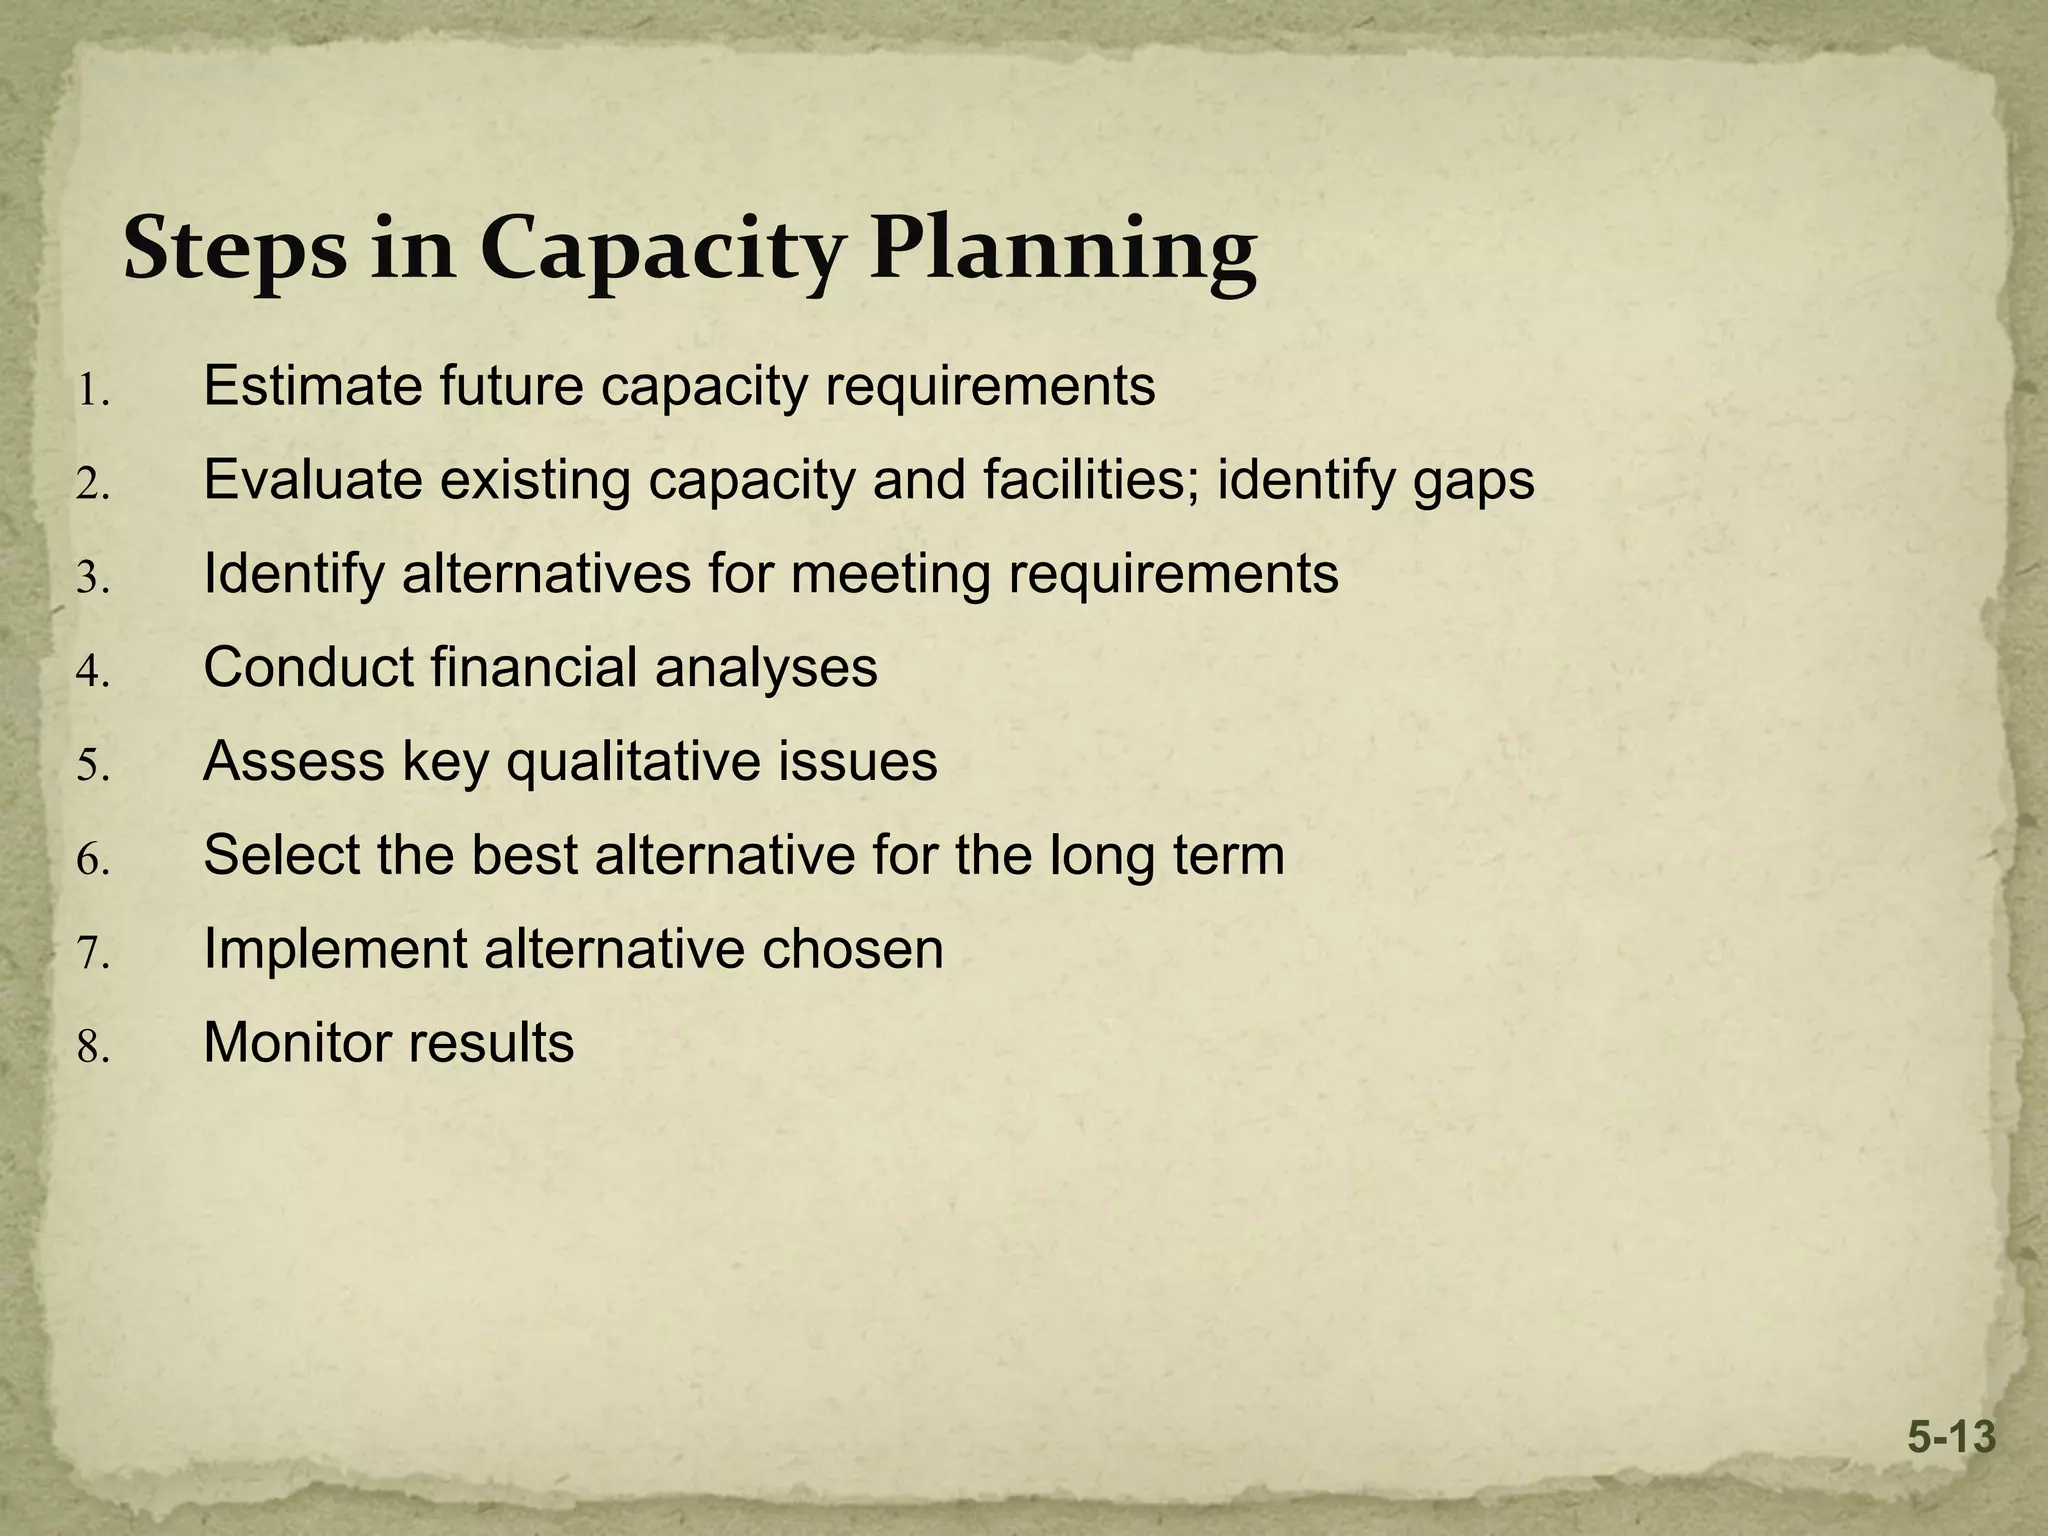
This document discusses strategic capacity planning. It defines key capacity planning concepts like capacity, effective capacity, and optimal operating level. It outlines the steps in capacity planning which include estimating future capacity needs, evaluating existing capacity, identifying alternatives, and selecting the best alternative. Factors that determine effective capacity and strategies for managing capacity like leading, following, and tracking strategies are also discussed. The document emphasizes the importance of capacity planning for matching supply to demand.
The document discusses capacity planning for products and services. It explains key concepts like capacity, effective capacity, and utilization. It also outlines factors to consider when developing capacity alternatives and approaches for evaluating alternatives, including cost-volume analysis, break-even analysis, financial analysis, and waiting-line analysis. The goal of capacity planning is to determine the appropriate level and timing of capacity to meet future demand in the most cost-effective manner.
The document discusses capacity planning for products and services. It explains key concepts like capacity, effective capacity, and utilization. It also outlines factors to consider when developing capacity alternatives and approaches for evaluating alternatives, including cost-volume analysis, break-even analysis, financial analysis, and waiting-line analysis. The goal of capacity planning is to determine the appropriate level and timing of capacity to meet future demand in a cost-effective manner.
Here are the steps to solve this example:
1) Given: FC = $6,000, VC per unit = $2, Revenue per unit = $7
2) To find breakeven point (QBEP):
QBEP = FC / (Revenue per unit - VC per unit)
= $6,000 / ($7 - $2)
= $6,000 / $5
= 1,200 units
3) If units produced = 1,000 units:
TR = Units * Revenue per unit = 1,000 * $7 = $7,000
TC = FC + Units * VC per unit = $6,000 + 1,000 * $2 = $
The document discusses strategies for converting maintenance costs into savings for oil and gas assets. It addresses:
1) Conducting a critical assessment and evaluation of maintenance plans to identify areas for cost optimization and ensure returns on investments in assets.
2) Planning for financial consequences by examining contingency plans to extend asset life and delay upgrades, as well as identifying maintenance issues before they become costly problems.
3) Leveraging tools like predictive analytics and inspections to improve maintenance and prolong the useful life of structures, ensuring sustainability and higher returns.
This document discusses capacity planning. It defines key capacity planning concepts like design capacity, effective capacity, and utilization. It explains that capacity planning impacts costs and competitiveness. The document outlines the steps in capacity planning including estimating future requirements, evaluating alternatives, and implementation. It also discusses factors that determine capacity needs and strategies for developing flexible capacity alternatives.
Outsourcing: A Growth Industry
Strategic Issues
Core Competencies
Supplier Dominance
The Creation of Strategic Vulnerabilities
The Dangers of Vertical Integration
Horizontal Integration
New Product Development and Outsourcing
Lean Manufacturing
Tactical Decisions
Factors Influencing Make-or-Buy Decisions
Cost Considerations
Time
Capacity
Control of Production and Quality
Business Process Outsourcing
Technology Risk and Maturity
Unreliable Suppliers
Suppliers’ Specialized Knowledge and Research
Small-Volume Requirements
Limited Facilities
Factors Influencing Make-or-Buy Decisions
Cost Considerations
Time
Capacity
Control of Production and Quality
Business Process Outsourcing
Technology Risk and Maturity
Unreliable Suppliers
Suppliers’ Specialized Knowledge and Research
Small-Volume Requirements
Limited Facilities
Factors Continued
Work Force Stability
Multiple-Source Policy
Managerial and Control Considerations
Procurement and Inventory Considerations
Netsourcing
The Volatile Nature of the Make-or-Buy Situation
Dangers of Outsourcing
Administration of Make-or-Buy Activities
Chief Resource Officer
Framework for Outsourcing
Executive Level Involvement
Increasing the probability of success for your projectGlen Alleman
The document provides guidance on increasing the probability of project success through effective planning and risk management. It discusses defining needed business capabilities, deriving requirements from capabilities, and sequencing work packages to deliver value. Continuous risk management is emphasized as connecting all project management elements. Progress should be measured at intervals by ensuring work packages produce deliverables that meet requirements and deliver needed capabilities.
This document discusses capacity planning for products and services. It begins by defining key capacity planning terms like capacity, design capacity, effective capacity, and actual output. It then discusses the importance of capacity decisions, factors that determine effective capacity, and strategy formulation. The document outlines the key decisions in capacity planning and provides steps to conduct capacity planning, including evaluating alternatives and financial analysis. It also discusses considerations for planning service capacity and cost-volume relationships.
This document discusses capacity planning. It begins by defining capacity, design capacity, effective capacity, and actual output. It then discusses the importance of capacity decisions, including their impact on meeting demands, costs, competitiveness, and long-range planning. The document outlines the key steps in capacity planning, including estimating future requirements, evaluating existing capacity, identifying alternatives, and financial analysis. It also discusses factors that determine effective capacity and strategies for developing flexible capacity alternatives.
Day 202-20-201135-20-201220-20-20pearl-201-20-20avinash-20kumar-131008015752-...PMI_IREP_TP
The document presents a framework for quantifying and managing client expectations in project delivery. It introduces three key metrics: Client Outlook Score, Provider Role Ratio, and Execution Quality. The Client Outlook Score reflects the client's ability to delegate control and tolerate variance. The Provider Role Ratio captures the provider's positioning relative to the client's needs and capabilities. Execution Quality measures how well the provider meets expected performance. These metrics are used to calculate a Client Expectation Ratio that provides guidance on managing expectations across different clients and projects. Environmental factors that influence expectations are also discussed.
Day 2 1135 - 1220 - pearl 1 - avinash kumarPMI2011
The document presents a framework for optimizing client expectations in project delivery. It discusses quantifying client expectations using a Client Expectation Ratio (CE-Ratio) that is calculated based on the Client Outlook Score (COS), Provider Role Ratio (PRR), and Execution Quality (EQ). The COS reflects the client's outlook, the PRR reflects the provider's positioning, and the EQ reflects the provider's performance. Together these provide a quantitative measure of client expectations that can be used to manage expectations throughout project delivery.
FCB Partners Webinar: Measure What Matters FCBPartners
This document summarizes Steve Stanton's webinar on measuring processes effectively. It discusses how organizations often measure the wrong things that do not improve performance. Effective measurement requires understanding how processes create value and support business goals. It also requires mixing leading and lagging indicators. The document outlines principles of process measurement and provides examples from companies like Hilti that developed process scorecards linked to strategic objectives and key performance indicators.
The document summarizes a presentation at the 2009 Global Workforce Symposium on service level agreements (SLAs). It discusses how SLAs are increasingly used by procurement and purchasing teams to evaluate service providers. It also outlines some typical challenges in working with SLAs, such as having too many metrics, metrics being too difficult to achieve, metrics being too complicated, and penalties being too expensive. The presentation then provides advice on developing effective SLAs, such as keeping them simple, setting realistic thresholds, and focusing on continuous improvement.
The document summarizes a presentation on service level agreements (SLAs) between business and their clients. It discusses how SLAs are now playing a more important role in procurement as personal contacts are replaced by negotiations led by procurement specialists. It also outlines some typical challenges in working with SLAs, such as having too many metrics, metrics that are too difficult to achieve, overcomplicated metrics, and metrics that put too much contract value at risk. Finally, it provides best practices for developing effective SLAs.
EFS Facilities Services Group | Performance ManagementTariq Chauhan
The document discusses performance management in facilities services. It proposes a framework with key components and measurement tools to address current challenges. The framework includes operational management, service management, risk management, productivity/efficiencies, work environment, innovation, and culture. A case study defines sample service level agreements (SLAs) for mechanical, electrical, and plumbing repairs categorized as emergency, urgent, and routine with response time targets. The framework aims to establish a balanced, strategic approach to performance measurement.
EFS Facilities Services Group | Performance ManagementTariq Chauhan
The document discusses performance management in facilities management. It defines performance management and outlines the strategic lifecycle from establishing goals to measuring outcomes. It addresses current challenges around operations, financial issues, and sustainability. It proposes evolving traditional approaches to focus more on outcomes through partnerships and hybrid contracts. The balanced scorecard framework is presented as a way to holistically measure performance from multiple perspectives.
Strategic capacity planning for products and services chapter 5mayank272369
The document discusses strategic capacity planning, including defining key terms like capacity, capacity planning, and effective capacity. It outlines the three key questions of capacity planning: what type of capacity is needed, how much is needed, and when is it needed. It also discusses factors that determine effective capacity and ways to measure and evaluate capacity alternatives.
20120628 building the sfdc business case-ar-madFlorian Zink
1) The document outlines Salesforce's six-step approach to building a business case for implementing their social enterprise solution at Customer X, including identifying key value drivers, defining metrics, benchmarking, and validating assumptions.
2) It provides an overview of Customer X's value drivers around visibility, collaboration, and IT rationalization, and how Salesforce's solution could help achieve benefits in areas like revenue, costs, and productivity.
3) Metrics are defined to measure potential improvements and benchmarks from other companies are presented showing significant gains, with Customer X expected to validate the opportunity.
This document summarizes a presentation on improving business performance through transforming governance, risk management, and compliance (GRC) programs. It discusses key aspects of business performance management including strategic planning, annual planning, decision analytics, and business performance reporting. It also outlines elements that constitute the core of any business performance management process. Additionally, the document discusses how leading companies enable business performance, examines the importance of GRC, and provides an overview of transforming GRC programs through simplifying processes and leveraging technology.
Reviews the importance of the claims payment process and how that moment of truth can define the competitive advantage of an insurance company. Focus is on how understanding and improving the process of claims payment benefits market share and organic growth.
This document outlines a strategy and tactic tree for a company seeking to achieve reliable rapid response. It details two core competitive edges of reliability and rapid response. For reliability, the document recommends building a 99% due date performance, implementing selling focused on reliability, and capitalizing on improvements that increase reliability. For rapid response, it suggests effectively offering and delivering suitable short lead times for premiums. The tree provides tactics to implement each strategy level down to the fifth level.
As Software Testing reimagines itself, the need for innovative commercial models is more pronounced than ever. There is no single model that will suit all the requirements. The keynote takes a comprehensive look at pricing and covers how it can have a business impact.
Measuring the Impact: KPIs for Assesing Business Agilityin a Tech Driven Envi...AgileNetwork
This document discusses key performance indicators (KPIs) for measuring business agility in a technology-driven environment. It outlines why measuring agility is important for strategic decision-making and competitive advantage. Some proposed KPIs include time-to-market, adaptability index, customer satisfaction, innovation rate, and employee engagement. The document also presents a case study of a large European bank that implemented KPIs to shorten release cycles, improve predictability, and reduce defects and recovery times. It emphasizes that continuously evaluating and improving KPIs is crucial for sustained success.
Value stream mapping is a practical and highly effective way to learn to see and resolve disconnects, redundancies, and gaps in how work gets done.
This VSM project template helps you and your project team to put together a "storyboard" for effective presentation to your key stakeholders. It includes four key phases:
1) Define and pick product/service family
2) Create a current state map
3) Develop a future state map
4) Develop an implementation plan
This document consists of a VSM project template in Powerpoint format and a set of Excel templates comprising VSM charter, Results table, Implementation Plan and common VSM icons.
The document provides an overview of best practices for outsourcing receivables collections. It discusses the risks and benefits of outsourcing, as well as keys to success. Case studies show how two credit unions reduced costs and increased returns by outsourcing to Credit Control. The presentation emphasizes selecting a financially stable vendor with industry experience, strong client support, and national licensing. It also stresses the importance of accurate data, service level expectations, and compliance with numerous regulations to protect members' data and privacy.
Chap004-Product and Service Design.pdfKhatVillados
This document outlines the key concepts and learning objectives covered in Chapter 4 of an operations management textbook on product and service design. It discusses the strategic importance of design, the design process, sources of design ideas, considerations like quality, costs and sustainability, and phases of product and service life cycles. Key aspects of design covered include standardization, mass customization, reliability, and concurrent engineering. The document provides an overview of the chapter's content at a high level.
This document outlines the key concepts and steps in decision theory. It begins by listing the learning objectives related to decision making under uncertainty. It then describes the characteristics of problems suitable for decision theory and the general 5-step process. It discusses techniques for decision making under certainty, risk, and uncertainty, including expected monetary value. Examples are provided to illustrate concepts like payoff tables, maximin criterion, and decision trees. The document provides an overview of causes of poor decisions and mistakes to avoid in the decision process.
This chapter discusses process selection and facility layout. It covers determining the appropriate production process based on factors like volume and flexibility. The main types of processes are job shop, batch, repetitive and continuous. It also discusses layout types like product and process and factors to consider in layout design like space, equipment, and workflow. The chapter provides guidelines for line balancing when designing assembly line layouts and considerations for process layout design.
This document discusses key economic concepts related to scarcity, decision-making, and the role of markets and government. It notes that individuals face trade-offs in their decisions and respond to incentives. It also explains that markets are generally an efficient way to organize economic activity, but that government intervention may be needed to address market failures or inequity issues. The document outlines several principles of economics, including opportunity costs, marginal analysis, gains from trade, productivity factors that influence standards of living, and the relationship between inflation, unemployment, and monetary policy in the short-run.
This document discusses perception and various factors that influence how people perceive things. It notes that perception is shaped by personal characteristics, the target being observed, context, and schemata from past experiences. It outlines several cognitive biases and distortions that can impact perception, such as only noticing negatives, exaggerating threats, and blaming external factors for failures but internal factors for successes. The document also discusses how framing, stereotyping, and only focusing on recent events can distort perception.
This document discusses microaggressions, which were first identified in 1977 by Dr. Chester Pierce as subtle verbal or non-verbal insults directed towards marginalized groups, especially African Americans. In 2010, microaggressions were further classified into microassaults, microinsults, and microinvalidations. The Oxford language defines microaggressions as everyday subtle interactions or behaviors that communicate bias against historically marginalized groups based on attributes such as race, gender, sexual orientation, religion, heritage, age or health status. The document also discusses how a "culture of victimhood" has emerged where people increasingly demand help from others by advertising their oppression on social media. It provides strategies for dealing with microaggressions such
This document discusses organization culture and provides examples. It begins by asking what shared assumptions and cultural artifacts are. It then provides examples of rituals used in planting and harvesting rice by Filipino farmers. Another section discusses breeching, a rite of passage for young boys in Western societies in the past. The document also includes sections on the origins of basketball with the Mayans, education and happiness in Finland, and Johnson & Johnson's principled response to a Tylenol crisis in the 1980s that prioritized consumer safety.
This document discusses how employees can be negatively influenced by unethical or abusive bosses. It provides examples of Michael Cohen, who committed crimes to cover up for Donald Trump's misdeeds, and how his judgment became compromised. Bad managers can model unacceptable behaviors and spread those behaviors to others through a process of social learning and normalizing unethical practices. Over time, employees may change their own values to align with their boss's behaviors in order to reduce cognitive dissonance. The document warns that unethical behaviors can become contagious among coworkers and influence social norms within an organization.
The document discusses groups and teams. It defines a group as two or more individuals who come together to achieve a specific goal. Groups can be formal or informal. Formal groups have designated work assignments and tasks, while informal groups occur naturally.
It discusses Bruce Tuckman's stages of group development which include forming, storming, norming, and performing. It also discusses potential explanations for successful groups, including being identified with a major decision maker, members with skills and abilities, and roles related to task performance and group maintenance.
The document covers concepts like group norms, groupthink, status, status incongruence, causes of conflict in organizations like task interdependence and communication problems, and examples of both lose
Business Ethics edited February 2023.pdfKhatVillados
1) Surrounding oneself with admirers who always agree can distort reality and prevent one from receiving constructive criticism.
2) While admiration can feel good, it also inflates vanity and makes one believe "crazy" ideas without challenge.
3) For happiness, it is better to seek real friendship with people one admires rather than focusing on being admired. Admiring others can motivate self-improvement through learning from their example and behaviors.
This document summarizes key topics from the Management 202 course including approaches to organizational culture change, motivation theories like Herzberg's two-factor theory and McClelland's three needs theory, perceptual biases, Tuckman's theory of group development, and contingency theories of leadership. It discusses how organizational culture is a "wicked problem" that is complex with no definite solution. Approaches to culture change outlined include iterating solutions, tapping collective wisdom, welcoming mistakes, avoiding copying others, and focusing on continuous improvement rather than a fixed end state. Leadership style must also match the situation based on contingency theories.
This document summarizes key principles of economics from a textbook. It discusses that individuals face tradeoffs in decision making; rational people consider marginal costs and benefits; and that while markets are generally efficient, governments may intervene to address market failures. Productivity determines living standards and there is a short-run tradeoff between inflation and unemployment.
Leadership Ambassador club Adventist modulekakomaeric00
Aims to equip people who aspire to become leaders with good qualities,and with Christian values and morals as per Biblical teachings.The you who aspire to be leaders should first read and understand what the ambassador module for leadership says about leadership and marry that to what the bible says.Christians sh
Resumes, Cover Letters, and Applying OnlineBruce Bennett
This webinar showcases resume styles and the elements that go into building your resume. Every job application requires unique skills, and this session will show you how to improve your resume to match the jobs to which you are applying. Additionally, we will discuss cover letters and learn about ideas to include. Every job application requires unique skills so learn ways to give you the best chance of success when applying for a new position. Learn how to take advantage of all the features when uploading a job application to a company’s applicant tracking system.
Job Finding Apps Everything You Need to Know in 2024SnapJob
SnapJob is revolutionizing the way people connect with work opportunities and find talented professionals for their projects. Find your dream job with ease using the best job finding apps. Discover top-rated apps that connect you with employers, provide personalized job recommendations, and streamline the application process. Explore features, ratings, and reviews to find the app that suits your needs and helps you land your next opportunity.
A Guide to a Winning Interview June 2024Bruce Bennett
This webinar is an in-depth review of the interview process. Preparation is a key element to acing an interview. Learn the best approaches from the initial phone screen to the face-to-face meeting with the hiring manager. You will hear great answers to several standard questions, including the dreaded “Tell Me About Yourself”.
2. ⚫ Capacity
⚫ The upper limit or ceiling on the load that an operating
unit can handle
⚫ Capacity needs include
⚫ Equipment
⚫ Space
⚫ Employee skills
Capacity Planning
5-2
3. ⚫ Goal
⚫ To achieve a match between the long-term supply
capabilities of an organization and the predicted level
of long-term demand
⚫ Overcapacity🡪 operating costs that are too high
⚫ Undercapacity🡪 strained resources and possible loss of
customers
Strategic Capacity Planning
5-3
4. ⚫ Key Questions:
⚫ What kind of capacity is needed?
⚫ How much is needed to match demand?
⚫ When is it needed?
⚫ Related Questions:
⚫ How much will it cost?
⚫ What are the potential benefits and risks?
⚫ Are there sustainability issues?
⚫ Should capacity be changed all at once, or through several
smaller changes
⚫ Can the supply chain handle the necessary changes?
Capacity Planning Questions
5-4
5. ⚫ Capacity decisions
1. impact the ability of the organization to meet future demands
2. affect operating costs
3. are a major determinant of initial cost
4. often involve long-term commitment of resources
5. can affect competitiveness
6. affect the ease of management
7. have become more important and complex due to globalization
8. need to be planned for in advance due to their consumption of
financial and other resources
Capacity Decisions Are Strategic
5-5
6. Capacity
Design capacity
⚫ Maximum output rate or service capacity an operation, process,
or facility is designed for
Effective capacity
⚫ Design capacity minus allowances such as personal time,
maintenance, and scrap
Actual output
⚫ Rate of output actually achieved--cannot
exceed effective capacity.
5-6
7. Defining and Measuring Capacity
⚫ Measure capacity in units that do not require
updating
⚫ Why is measuring capacity in dollars problematic?
⚫ Two useful definitions of capacity
⚫ Design capacity
⚫ The maximum output rate or service capacity an operation,
process, or facility is designed for
⚫ Effective capacity
⚫ Design capacity minus allowances such as personal time and
maintenance
5-7
8. ⚫ Actual output
⚫ The rate of output actually achieved
⚫ It cannot exceed effective capacity
⚫ Efficiency
⚫ Utilization
Measured as percentages
Measuring System Effectiveness
5-8
9. Example– Efficiency and Utilization
⚫ Design Capacity = 50 trucks per day
⚫ Effective Capacity = 40 trucks per day
⚫ Actual Output = 36 trucks per day
5-9
10. Determinants of Effective Capacity
⚫ Facilities
⚫ Product and service factors
⚫ Process factors
⚫ Human factors
⚫ Policy factors
⚫ Operational factors
⚫ Supply chain factors
⚫ External factors
5-10
11. Strategy Formulation
⚫ Strategies are typically based on assumptions
and predictions about:
⚫ Long-term demand patterns
⚫ Technological change
⚫ Competitor behavior
5-11
12. Capacity Cushion
⚫ Capacity Cushion
⚫ Extra capacity used to offset demand uncertainty
⚫ Capacity cushion = 100% - Utilization
⚫ Capacity cushion strategy
⚫ Organizations that have greater demand uncertainty
typically have greater capacity cushion
⚫ Organizations that have standard products and services
generally have greater capacity cushion
5-12
13. Steps in Capacity Planning
1. Estimate future capacity requirements
2. Evaluate existing capacity and facilities; identify gaps
3. Identify alternatives for meeting requirements
4. Conduct financial analyses
5. Assess key qualitative issues
6. Select the best alternative for the long term
7. Implement alternative chosen
8. Monitor results
5-13
14. How would you select between alternatives?
Example: Getting a line of credit
⚫ Interest rate on the revolver (including
monitoring fees, etc.)
⚫ Up Front fees (commitment fees, closing fees,
audit fee, etc.)
⚫ Size of the line offered
⚫ Expected Covenant Restrictions
⚫ Advance Rate on Inventory and AR
⚫ Unused line fee
⚫ Default Rate
⚫ Perceived “friendliness” of lender
15. Rank the decision criteria as to importance to the
situation at hand
Decision
Factor
Weight
(1-10)
Interest Rate
on Revolver 8
Up Front Fees 3
Size of Line 7
Covenant
Restrictions 7
Advance Rate 5
Unused Line
Fee 3
Default Rate 5
Friendliness of
Lender 7
16. Rank each lender as to how they compare in each category.
Decision Factor
Weight
(1-10) Lender 1 Lender 2 Lender 3 Lender 4
Interest Rate on
Revolver 8 1 3 2 4
Up Front Fees 3 2 1 3 4
Size of Line 7 3 2 1 4
Covenant Restrictions 7 4 3 2 1
Advance Rate 5 1 2 2 1
Unused Line Fee 3 2 1 1 2
Default Rate 5 2 1 2 1
Friendliness of Lender 7 1 2 3 4
24. Forecasting Capacity Requirements
⚫ Long-term considerations relate to overall level of
capacity requirements
⚫ Require forecasting demand over a time horizon and
converting those needs into capacity requirements
⚫ Short-term considerations relate to probable
variations in capacity requirements
⚫ Less concerned with cycles and trends than with
seasonal variations and other variations from average
5-24
25. ⚫ Calculating processing requirements requires
reasonably accurate demand forecasts, standard
processing times, and available work time
Calculating Processing Requirements
5-25
26. Service Capacity Planning
⚫ Service capacity planning can present a number of
challenges related to:
⚫ The need to be near customers
⚫ Convenience
⚫ The inability to store services
⚫ Cannot store services for consumption later
⚫ The degree of demand volatility
⚫ Volume and timing of demand
⚫ Time required to service individual customers
5-26
27. Demand Management Strategies
⚫ Strategies used to offset capacity limitations and
that are intended to achieve a closer match
between supply and demand
⚫ Pricing
⚫ Promotions
⚫ Discounts
⚫ Other tactics to shift demand from peak periods into
slow periods
5-27
28. In-House or Outsource?
⚫ Once capacity requirements are determined, the organization
must decide whether to produce a good or service itself or
outsource
⚫ Factors to consider:
⚫ Available capacity
⚫ Expertise
⚫ Quality considerations
⚫ The nature of demand
⚫ Cost
⚫ Risks
5-28
29. Developing Capacity Alternatives
⚫ Things that can be done to enhance capacity
management:
⚫ Design flexibility into systems
⚫ Take stage of life cycle into account
⚫ Take a “big-picture” approach to capacity changes
⚫ Prepare to deal with capacity “chunks”
⚫ Attempt to smooth capacity requirements
⚫ Identify the optimal operating level
⚫ Choose a strategy if expansion is involved
5-29
30. Capacity Strategies
⚫ Leading
⚫ Build capacity in anticipation of future demand increases
⚫ Following
⚫ Build capacity when demand exceeds current capacity
⚫ Tracking
⚫ Similar to the following strategy, but adds capacity in relatively
small increments to keep pace with increasing demand
5-30
31. Bottleneck Operation
⚫ An operation in a
sequence of operations
whose capacity is lower
than that of the other
operations
5-31
33. Economies and Diseconomies of Scale
⚫ Economies of Scale
⚫ If output rate is less than the optimal level, increasing
the output rate results in decreasing average per unit
costs
⚫ Diseconomies of Scale
⚫ If the output rate is more than the optimal level,
increasing the output rate results in increasing average
per unit costs
5-33
34. Economies of Scale
⚫ Economies of Scale
⚫ If output rate is less than the optimal level, increasing
the output rate results in decreasing average per unit
costs
⚫ Reasons for economies of scale:
⚫ Fixed costs are spread over a larger number of units
⚫ Construction costs increase at a decreasing rate as facility
size increases
⚫ Processing costs decrease due to standardization
5-34
35. Diseconomies of Scale
⚫ Diseconomies of Scale
⚫ If the output rate is more than the optimal level, increasing the
output rate results in increasing average per unit costs
⚫ Reasons for diseconomies of scale
⚫ Distribution costs increase due to traffic congestion and
shipping from a centralized facility rather than multiple
smaller facilities
⚫ Complexity increases costs
⚫ Inflexibility can be an issue
⚫ Additional levels of bureaucracy
5-35
36. Facility Size and Optimal Operating Level
Minimum cost & optimal operating rate are
functions of size of production unit.
5-36
37. Constraint Management
⚫ Constraint
⚫ Something that limits the performance of a process or system in
achieving its goals
⚫ Categories
⚫ Market
⚫ Resource
⚫ Material
⚫ Financial
⚫ Knowledge or competency
⚫ Policy
5-37
38. 1. Identify the most pressing constraint
2. Change the operation to achieve maximum benefit,
given the constraint
3. Make sure other portions of the process are supportive
of the constraint
4. Explore and evaluate ways to overcome the constraint
5. Repeat the process until the constraint levels are at
acceptable levels
Resolving Constraint Issues
5-38
39. Evaluating Alternatives
⚫ Alternatives should be evaluated from varying
perspectives
⚫ Economic
⚫ Is it economically feasible?
⚫ How much will it cost?
⚫ How soon can we have it?
⚫ What will operating and maintenance costs be?
⚫ What will its useful life be?
⚫ Will it be compatible with present personnel and present
operations?
⚫ Non-economic
⚫ Public opinion
5-39
41. ⚫ Cost-volume analysis
⚫ Focuses on the relationship between cost, revenue,
and volume of output
⚫ Fixed Costs (FC)
⚫ tend to remain constant regardless of output volume
⚫ Variable Costs (VC)
⚫ vary directly with volume of output
⚫ VC = Quantity(Q) x variable cost per unit (v)
⚫ Total Cost
⚫ TC = FC + VC
⚫ Total Revenue (TR)
⚫ TR = revenue per unit (R) x Q
Cost-Volume Analysis
5-41
42. ⚫ BEP
⚫ The volume of output at which total cost and total
revenue are equal
⚫ Profit (P) = TR – TC = R x Q – (FC +v x Q)
= Q(R – v) – FC
Break-Even Point (BEP)
5-42
44. Cost-Volume Relationships
⚫ Capacity alternatives may involve step costs,
which are costs that increase stepwise as
potential volume increases.
⚫ The implication of such a situation is the possible
occurrence of multiple break-even quantities.
5-44
45. Cost-Volume Analysis Assumptions
⚫ Cost-volume analysis is a viable tool for comparing
capacity alternatives if certain assumptions are
satisfied
⚫ One product is involved
⚫ Everything produced can be sold
⚫ The variable cost per unit is the same regardless of volume
⚫ Fixed costs do not change with volume changes, or they are
step changes
⚫ The revenue per unit is the same regardless of volume
⚫ Revenue per unit exceeds variable cost per unit
5-45
46. Financial Analysis
⚫ Cash flow
⚫ The difference between cash received from sales and
other sources, and cash outflow for labor, material,
overhead, and taxes
⚫ Present value
⚫ The sum, in current value, of all future cash flow of an
investment proposal
5-46
47. Operations Strategy
⚫ Capacity planning impacts all areas of the organization
⚫ It determines the conditions under which operations will have to function
⚫ Flexibility allows an organization to be agile
⚫ It reduces the organization’s dependence on forecast accuracy and reliability
⚫ Many organizations utilize capacity cushions to achieve flexibility
⚫ Bottleneck management is one way by which organizations can enhance
their effective capacities
⚫ Capacity expansion strategies are important organizational
considerations
⚫ Expand-early strategy
⚫ Wait-and-see strategy
⚫ Capacity contraction is sometimes necessary
⚫ Capacity disposal strategies become important under these
conditions
5-47
49. Decision Theory
⚫ A general approach to decision making that is
suitable to a wide range of operations management
decisions
⚫ Capacity planning
⚫ Product and service design
⚫ Equipment selection
⚫ Location planning
5S-49
50. Characteristics of Suitable Problems
⚫ Characteristics of decisions that are suitable for
using decision theory
⚫ A set of possible future conditions that will have a
bearing on the results of the decision
⚫ A list of alternatives from which to choose
⚫ A known payoff for each alternative under each
possible future condition
5S-50
51. Process for Using Decision Theory
1. Identify the possible future states of nature
2. Develop a list of possible alternatives
3. Estimate the payoff for each alternative for each
possible future state of nature
4. If possible, estimate the likelihood of each possible
future state of nature
5. Evaluate alternatives according to some decision
criterion and select the best alternative
5S-51
52. Payoff Table
⚫ A table showing the expected payoffs for each
alternative in every possible state of nature
Possible Future Demand
Alternatives Low Moderate High
Small facility $10 $10 $10
Medium facility 7 12 12
Large Facility (4) 2 16
• A decision is being made concerning which size
facility should be constructed
• The present value (in millions) for each alternative
under each state of nature is expressed in the body of
the above payoff table
5S-52
53. Causes of Poor Decisions
⚫ Decisions occasionally turn out poorly due to
unforeseeable circumstances; however, this is not
the norm.
⚫ More frequently poor decisions are the result of a
combination of
⚫ Mistakes in the decision process
⚫ Bounded rationality
⚫ Suboptimization
5S-53
54. Decision Process
⚫ Steps:
1. Identify the problem
2. Specify objectives and criteria for a solution
3. Develop suitable alternatives
4. Analyze and compare alternatives
5. Select the best alternative
6. Implement the solution
7. Monitor to see that the desired result is achieved
⚫ Errors
⚫ Failure to recognize the importance of each step
⚫ Skipping a step
⚫ Failure to complete a step before jumping to the next step
⚫ Failure to admit mistakes
⚫ Inability to make a decision
5S-54
55. Bounded Rationality & Suboptimization
⚫ Bounded rationality
⚫ The limitations on decision making caused by costs,
human abilities, time, technology, and availability of
information
⚫ Suboptimization
⚫ The results of different departments each attempting
to reach a solution that is optimum for that
department
5S-55
56. Decision Environments
⚫ There are three general environment categories:
⚫ Certainty
⚫ Environment in which relevant parameters have known
values
⚫ Risk
⚫ Environment in which certain future events have
probabilistic outcomes
⚫ Uncertainty
⚫ Environment in which it is impossible to assess the
likelihood of various possible future events
5S-56
57. Decision Making Under Uncertainty
⚫ Decisions are sometimes made under complete
uncertainty: No information is available on how likely the
various states of nature are.
⚫ Decision Criteria:
⚫ Maximin
⚫ Choose the alternative with the best of the worst possible payoffs
⚫ Maximax
⚫ Choose the alternative with the best possible payoff
⚫ Laplace
⚫ Choose the alternative with the best average payoff
⚫ Minimax regret
⚫ Choose the alternative that has the least of the worst regrets
5S-57
58. Possible Future Demand
Alternatives Low Moderate High
Small Facility $10 $10 $10
Medium Facility 7 12 12
Large Facility (4) 2 16
Example – Maximin Criterion
•The worst payoff for each alternative is
Small facility: $10 million
Medium facility $7 million
Large facility -$4 million
•Choose to construct a small facility
5S-58
59. Possible Future Demand
Alternatives Low Moderate High
Small Facility $10 $10 $10
Medium Facility 7 12 12
Large Facility (4) 2 16
Example – Maximax Criterion
•The best payoff for each alternative is
Small facility: $10 million
Medium facility $12 million
Large facility $16 million
•Choose to construct a large facility
5S-59
60. Possible Future Demand
Alternatives Low Moderate High
Small Facility $10 $10 $10
Medium Facility 7 12 12
Large Facility (4) 2 16
Example – Laplace Criterion
•The average payoff for each alternative is
Small facility: (10+10+10)/3 = $10 million
Medium facility (7+12+12)/3 = $10.33 million
Large facility (-4+2+16)/3 = $4.67 million
•Choose to construct a medium facility
5S-60
61. Possible Future Demand
Alternatives Low Moderate High
Small Facility $10 $10 $10
Medium Facility 7 12 12
Large Facility (4) 2 16
Example – Minimax Regret
•Construct a regret (or opportunity loss) table
•The difference between a given payoff and the best
payoff for a state of nature
Regrets
Alternatives Low Moderate High
Small Facility $0 $2 $6
Medium Facility 3 0 4
Large Facility 14 10 0
5S-61
62. Regrets
Alternatives Low Moderate High
Small Facility $0 $2 $6
Medium Facility 3 0 4
Large Facility 14 10 0
Example – Minimax Regret
•Identify the worst regret for each alternative
•Small facility $6 million
•Medium facility $4 million
•Large facility $14 million
•Select the alternative with the minimum of the maximum
regrets
•Build a medium facility
5S-62
63. Decision Making Under Risk
⚫ Decisions made under the condition that the
probability of occurrence for each state of nature
can be estimated
⚫ A widely applied criterion is expected monetary
value (EMV)
⚫ EMV
⚫ Determine the expected payoff of each alternative, and
choose the alternative that has the best expected payoff
⚫ This approach is most appropriate when the decision maker is
neither risk averse nor risk seeking
5S-63
64. Possible Future Demand
Alternatives Low (.30) Moderate (.50) High (.20)
Small Facility $10 $10 $10
Medium Facility 7 12 12
Large Facility (4) 2 16
Example– EMV
EMVsmall
= .30(10) +.50(10) +.20(10) = 10
EMVmedium
= .30(7) + .50(12) + .20(12) = 10.5
EMVlarge
= .30(-4) + .50(2) + .20(16) = $3
Build a medium facility
5S-64
65. Decision Tree
⚫ Decision tree
⚫ A schematic representation of the available alternatives and
their possible consequences
⚫ Useful for analyzing sequential decisions
5S-65
66. Decision Tree
⚫ Composed of
⚫ Nodes
⚫ Decisions – represented by square nodes
⚫ Chance events – represented by circular nodes
⚫ Branches
⚫ Alternatives– branches leaving a square node
⚫ Chance events– branches leaving a circular node
⚫ Analyze from right to left
⚫ For each decision, choose the alternative that will yield the
greatest return
⚫ If chance events follow a decision, choose the alternative that
has the highest expected monetary value (or lowest expected
cost)
5S-66
67. ⚫ A manager must decide on the size of a video arcade to construct. The
manager has narrowed the choices to two: large or small. Information has
been collected on payoffs, and a decision tree has been constructed.
Analyze the decision tree and determine which initial alternative (build small
or build large) should be chosen in order to maximize expected monetary
value.
Example– Decision Tree
1
2
2
$40
$40
$50
$55
($10)
$50
$70
B
u
i
l
d
S
m
a
l
l
Low
Demand (.40)
Low Demand (.40)
High Demand (.60)
High Demand (.60)
B
u
i
l
d
L
a
r
g
e
Do Nothing
Cut Prices
Do Nothing
Overtime
Expand
5S-67
69. ⚫ Expected value of perfect information (EVPI)
⚫ The difference between the expected payoff with perfect
information and the expected payoff under risk
⚫ Two methods for calculating EVPI
⚫ EVPI = expected payoff under certainty – expected payoff under risk
⚫ EVPI = minimum expected regret
Expected Value of Perfect Information
5S-69
70. Possible Future Demand
Alternatives Low (.30) Moderate (.50) High (.20)
Small Facility $10 $10 $10
Medium Facility 7 12 12
Large Facility (4) 2 16
Example – EVPI
EVwith perfect information
= .30(10) + .50(12) + .20(16) = $12.2
EMV = $10.5
EVPI = EVwith perfect information
– EMV
= $12.2 – 10.5
= $1.7
You would be willing to spend up to $1.7 million to
obtain perfect information
5S-70
71. Regrets
Alternatives Low (.30) Moderate (.50) High (.20)
Small Facility $0 $2 $6
Medium Facility 3 0 4
Large Facility 14 10 0
Example– EVPI
• Expected Opportunity Loss
• EOLSmall
= .30(0) + .50(2) + .20(6) = $2.2
• EOLMedium
= .30(3) + .50(0) + .20(4) = $1.7
• EOLLarge
= .30(14) + .50(10) + .20(0) = $9.2
• The minimum EOL is associated with the building the
medium size facility. This is equal to the EVPI, $1.7
million
5S-71
72. Sensitivity Analysis
⚫ Sensitivity analysis
⚫ Determining the range of probability for which an
alternative has the best expected payoff
5S-72