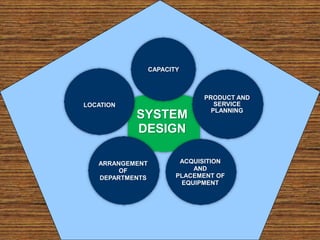
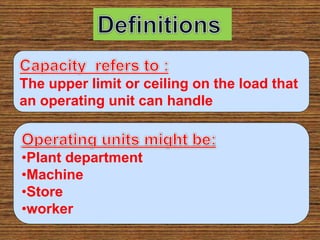
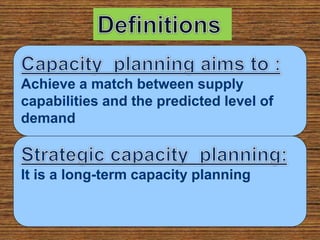
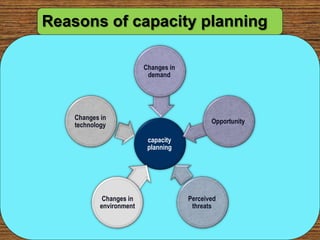
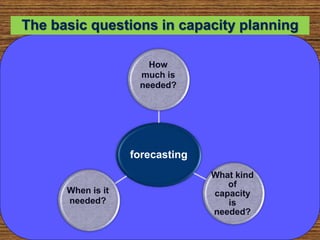
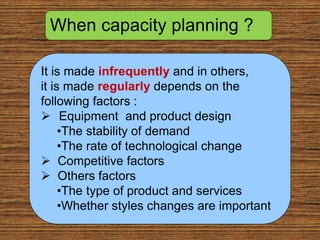
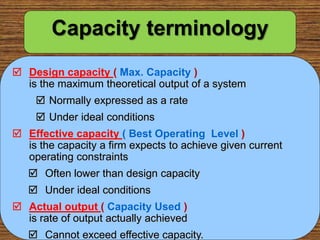
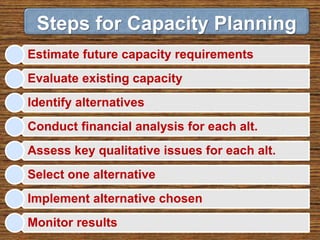
Chapter 5
Lecture 8
Capacity Planning
FOR
Products and Services
SYSTEM
DESIGN
CAPACITY
PRODUCT AND
SERVICE
PLANNING
ACQUISITION
AND
PLACEMENT OF
EQUIPMENT
ARRANGEMENT
OF
DEPARTMENTS
LOCATION
The upper limit or ceiling on the load that
an operating unit can handle
•Plant department
•Machine
•Store
•worker
Achieve a match between supply
capabilities and the predicted level of
demand
It is a long-term capacity planning
Reasons of capacity planning
capacity
planning
Changes in
demand
Changes in
technology
Changes in
environment
Perceived
threats
Opportunity
forecasting
How
much is
needed?
What kind
of
capacity
is
needed?
When is it
needed?
The basic questions in capacity planning
When capacity planning ?
It is made infrequently and in others,
it is made regularly depends on the
following factors :
 Equipment and product design
•The stability of demand
•The rate of technological change
 Competitive factors
 Others factors
•The type of product and services
•Whether styles changes are important
Capacity terminology
 Design capacity ( Max. Capacity )
is the maximum theoretical output of a system
 Normally expressed as a rate
 Under ideal conditions
 Effective capacity ( Best Operating Level )
is the capacity a firm expects to achieve given current
operating constraints
 Often lower than design capacity
 Under ideal conditions
 Actual output ( Capacity Used )
is rate of output actually achieved
 Cannot exceed effective capacity.
Utilization is the percent of design
capacity achieved
Efficiency is the percent of
effective capacity achieved
Utilization = Actual Output/Design Capacity
Efficiency = Actual Output/Effective Capacity
Utilization and Efficiency
Both measures expressed as percentages
Efficiency/Utilization
Actual output 36 units/day
Efficiency = = = 90%
Effective capacity 40 units/ day
Actual output 36 units/day
Utilization = = = 72%
Design capacity 50 units/day
Design capacity = 50 trucks/day
Effective capacity = 40 trucks/day
Actual output = 36 units/day
Ex.
90.00%
72.00%
0.00%
10.00%
20.00%
30.00%
40.00%
50.00%
60.00%
70.00%
80.00%
90.00%
100.00%
Efficiency Utilization
Efficiency vs Utilization
Utilization Example
 Best operating level = 120 units/week
 Actual output = 83 units/week
 Utilization = ?
.692
units/wk
120
units/wk
83
=
level
operating
Best
used
Capacity
n
Utilizatio =
=
Underutilization
Best Operating
Level
Average
unit cost
of output
Volume
Over-utilization
Best Operating Level
Actual production last week = 148,000 rolls
Effective capacity = 175,000 rolls
Design capacity = 1,200 rolls per hour
Bakery operates 7 days/week,
Shifts/day = 3,
Hours/shift = 8
Design capacity = (7 x 3 x 8) x (1,200)
= 201,600 rolls/week
Measuring capacity
Ex.
Utilization = 148,000/201,600 = 73.4%
Efficiency = 148,000/175,000 = 84.6%
Examples of Capacity Measures
Type of Measures of Capacity
Organization Inputs Outputs
Manufacturer Machine hours
per shift
Number of units
per shift
Hospital Number of beds Number of
patients treated
Airline Number of planes
or seats
Number of
seat-miles flown
Restaurant Number of seats Customers/time
Retailer Area of store Sales dollars
Theater Number of seats Customers/time
 Facilities (size, location, layout, heating, lighting, ventilations)
 Product and service factors (similarity of products)
 Process factors (productivity, quality)
 Human factors (training, skills, experience, motivations,
absentation, turnover)
 Policy factors (overtime system, no. of shifts)
 Operational factors (scheduling problems, purchasing
requirements, inventory shortages)
 Supply chain factors (warehousing, transportation,
distribution)
 External factors (product standards, government agencies,
pollution standard)
Determinants of Effective Capacity
Estimate future capacity requirements
Evaluate existing capacity
Identify alternatives
Conduct financial analysis for each alt.
Assess key qualitative issues for each alt.
Select one alternative
Implement alternative chosen
Monitor results
Steps for Capacity Planning
Calculating Processing
Requirements
Determine type of products or services
Forecast for the Demand
Determine the process requirements
•The standard processing time / unit of
product
•The number of workdays / year
•The number shifts that will be used
Product
Annual
Demand
Standard
processing time
per unit (hr.)
Processing time
needed (hr.)
#1
#2
#3
400
300
700
5.0
8.0
2.0
2,000
2,400
1,400
5,800
Calculating Processing Requirements
A dept. works 8-hour shift, 250 days/year
annual capacity is 250*8 = 2000 hours,
number of machines required = 5,800 hours/2,000 hours = 2.90 machines
then we need three machines to handle the required volume
In-House or Outsourcing
1. Available capacity (equip.,skills,time)
2. Expertise
3. Quality considerations (labs, inspect.)
4. Nature of demand (high, steady)
5. Cost (fixed, savings)
6. Risk
Outsource: obtain a good or service completely or partially
from an external provider
Make or Buy ?
A firm’s manager must decide whether to make or buy a
certain item used in the production of vending machines ,
making the item would involve annual lease costs of
$150000 . Cost and volume estimates are as follows:
•Should the firm make or buy ?
•If the volume changed , at what volume would the
manager be indifferent between making and buying ?
Buy
Make
None
$150000
Annual fixed cost
$80
$60
Variable cost/unit
12000
12000
Annual volume (units)
EX.
Make or Buy ?
• Total cost = Fixed cost + (Volume * Variable cost)
in case of make = $150000 + (12000*60) = $870000
in case of buy = 0 + (12000*80) = $960000
TCost (make) < TCost (buy)
So the solution is “Make”
• Tcost(make) = Tcost(buy)
$150000 + Q*60 = 0 + Q*80
Q = 7500 unit
Sol.
Make or Buy ?
Q
Bottleneck Operation
Bottleneck operation: An operation
in a sequence of operations whose
capacity is lower than that of the
other operations
Bottleneck Operation
Machine #2
Bottleneck
Operation
Machine #1
Machine #3
Machine #4
10/hr
10/hr
10/hr
10/hr
30/hr
Bottleneck Operation
Operation 1
20/hr.
Operation 2
10/hr.
Operation 3
15/hr.
10/hr.
Bottleneck
Maximum output rate
limited by bottleneck
Economies of Scale
Minimum cost & optimal operating rate are
functions of size of production unit.
Average
cost
per
unit
0
Small
plant Medium
plant Large
plant
Output rate

capacity planning class notes.ppt

  • 1.
    Chapter 5 Lecture 8 CapacityPlanning FOR Products and Services
  • 2.
  • 3.
    The upper limitor ceiling on the load that an operating unit can handle •Plant department •Machine •Store •worker
  • 4.
    Achieve a matchbetween supply capabilities and the predicted level of demand It is a long-term capacity planning
  • 5.
    Reasons of capacityplanning capacity planning Changes in demand Changes in technology Changes in environment Perceived threats Opportunity
  • 6.
    forecasting How much is needed? What kind of capacity is needed? Whenis it needed? The basic questions in capacity planning
  • 7.
    When capacity planning? It is made infrequently and in others, it is made regularly depends on the following factors :  Equipment and product design •The stability of demand •The rate of technological change  Competitive factors  Others factors •The type of product and services •Whether styles changes are important
  • 8.
    Capacity terminology  Designcapacity ( Max. Capacity ) is the maximum theoretical output of a system  Normally expressed as a rate  Under ideal conditions  Effective capacity ( Best Operating Level ) is the capacity a firm expects to achieve given current operating constraints  Often lower than design capacity  Under ideal conditions  Actual output ( Capacity Used ) is rate of output actually achieved  Cannot exceed effective capacity.
  • 9.
    Utilization is thepercent of design capacity achieved Efficiency is the percent of effective capacity achieved Utilization = Actual Output/Design Capacity Efficiency = Actual Output/Effective Capacity Utilization and Efficiency Both measures expressed as percentages
  • 10.
    Efficiency/Utilization Actual output 36units/day Efficiency = = = 90% Effective capacity 40 units/ day Actual output 36 units/day Utilization = = = 72% Design capacity 50 units/day Design capacity = 50 trucks/day Effective capacity = 40 trucks/day Actual output = 36 units/day Ex.
  • 11.
  • 12.
    Utilization Example  Bestoperating level = 120 units/week  Actual output = 83 units/week  Utilization = ? .692 units/wk 120 units/wk 83 = level operating Best used Capacity n Utilizatio = =
  • 13.
    Underutilization Best Operating Level Average unit cost ofoutput Volume Over-utilization Best Operating Level
  • 14.
    Actual production lastweek = 148,000 rolls Effective capacity = 175,000 rolls Design capacity = 1,200 rolls per hour Bakery operates 7 days/week, Shifts/day = 3, Hours/shift = 8 Design capacity = (7 x 3 x 8) x (1,200) = 201,600 rolls/week Measuring capacity Ex. Utilization = 148,000/201,600 = 73.4% Efficiency = 148,000/175,000 = 84.6%
  • 15.
    Examples of CapacityMeasures Type of Measures of Capacity Organization Inputs Outputs Manufacturer Machine hours per shift Number of units per shift Hospital Number of beds Number of patients treated Airline Number of planes or seats Number of seat-miles flown Restaurant Number of seats Customers/time Retailer Area of store Sales dollars Theater Number of seats Customers/time
  • 16.
     Facilities (size,location, layout, heating, lighting, ventilations)  Product and service factors (similarity of products)  Process factors (productivity, quality)  Human factors (training, skills, experience, motivations, absentation, turnover)  Policy factors (overtime system, no. of shifts)  Operational factors (scheduling problems, purchasing requirements, inventory shortages)  Supply chain factors (warehousing, transportation, distribution)  External factors (product standards, government agencies, pollution standard) Determinants of Effective Capacity
  • 17.
    Estimate future capacityrequirements Evaluate existing capacity Identify alternatives Conduct financial analysis for each alt. Assess key qualitative issues for each alt. Select one alternative Implement alternative chosen Monitor results Steps for Capacity Planning
  • 18.
    Calculating Processing Requirements Determine typeof products or services Forecast for the Demand Determine the process requirements •The standard processing time / unit of product •The number of workdays / year •The number shifts that will be used
  • 19.
    Product Annual Demand Standard processing time per unit(hr.) Processing time needed (hr.) #1 #2 #3 400 300 700 5.0 8.0 2.0 2,000 2,400 1,400 5,800 Calculating Processing Requirements A dept. works 8-hour shift, 250 days/year annual capacity is 250*8 = 2000 hours, number of machines required = 5,800 hours/2,000 hours = 2.90 machines then we need three machines to handle the required volume
  • 20.
    In-House or Outsourcing 1.Available capacity (equip.,skills,time) 2. Expertise 3. Quality considerations (labs, inspect.) 4. Nature of demand (high, steady) 5. Cost (fixed, savings) 6. Risk Outsource: obtain a good or service completely or partially from an external provider Make or Buy ?
  • 21.
    A firm’s managermust decide whether to make or buy a certain item used in the production of vending machines , making the item would involve annual lease costs of $150000 . Cost and volume estimates are as follows: •Should the firm make or buy ? •If the volume changed , at what volume would the manager be indifferent between making and buying ? Buy Make None $150000 Annual fixed cost $80 $60 Variable cost/unit 12000 12000 Annual volume (units) EX. Make or Buy ?
  • 22.
    • Total cost= Fixed cost + (Volume * Variable cost) in case of make = $150000 + (12000*60) = $870000 in case of buy = 0 + (12000*80) = $960000 TCost (make) < TCost (buy) So the solution is “Make” • Tcost(make) = Tcost(buy) $150000 + Q*60 = 0 + Q*80 Q = 7500 unit Sol. Make or Buy ? Q
  • 23.
    Bottleneck Operation Bottleneck operation:An operation in a sequence of operations whose capacity is lower than that of the other operations
  • 24.
    Bottleneck Operation Machine #2 Bottleneck Operation Machine#1 Machine #3 Machine #4 10/hr 10/hr 10/hr 10/hr 30/hr
  • 25.
    Bottleneck Operation Operation 1 20/hr. Operation2 10/hr. Operation 3 15/hr. 10/hr. Bottleneck Maximum output rate limited by bottleneck
  • 26.
    Economies of Scale Minimumcost & optimal operating rate are functions of size of production unit. Average cost per unit 0 Small plant Medium plant Large plant Output rate