Download to read offline
![International Research Journal of Engineering and Technology (IRJET) e-ISSN: 2395-0056
Volume: 09 Issue: 10 | Oct 2022 www.irjet.net p-ISSN: 2395-0072
© 2022, IRJET | Impact Factor value: 7.529 | ISO 9001:2008 Certified Journal | Page 94
CANCER CLUMPS DETECTION USING IMAGE PROCESSING BASED ON
CELL COUNTING
Jayashree P K1, Smt. T D Shashikala2
PG Scholor1, Associative Professor2, Department of Electronics and Communication Engineering,
University B.D.T College of Engineering, Davanagere-577004, Karnataka, India
------------------------------------------------------------------------***-------------------------------------------------------------------------
ABSTRACT
One of the leading causes of death in people is cancer.
There has been a lot of research into using image
processing, classification, and techniques to identify and
diagnose cancer. But the illness continues to rank among
the deadliest. As a result, one of the reasons to treat
cancer is not just its early detection. In the proposed
method, cancer cells are identified using image
processing, artificial neural network techniques, area
measurement, and cell clump detection. Using the
suggested method, we can automatically identify
cancerous characteristics in any CT image,
mammography image, or biopsy sample. There were
numerous proposed algorithms, but they lacked
flexibility and had uneven levels of accuracy. The system
pre-processes the input images using a variety of
methods, including grey scaling, binarization, inversion,
and flood fill operation, before applying the proposed
algorithm. If the suggested approach can successfully be
used for automatically detecting cancer cells in a novel
way and fine-tuned with a feedback system, it will open
up new dimensions in the detection of cancer cells in the
field of medical sciences.
Keywords: Image Preprocessing, Image segmentation,
ResNet50.
1. INTRODUCTION
The obstreperous division of abnormal cells is
referred to as cancer. Tumors can be produced by the
spread of cancerous cells through the lymphatic or
circulatory systems. But it's important to remember that
not all tumors are malignant. Both benign (not
cancerous) and malignant tumors are possible
(cancerous). Over a hundred different forms of cancer have
been identified, and each type has numerous Sub types with
unique variations. The early stages of cancer detection
are particularly difficult due to the enormous variation.
In the vast majority of cases, the causes of cancer are still
poorly understood. Consequently, cancer treatment
becomes considerably more difficult.
Additionally, due to the disease's extreme
complexity, scientists, physicians, and engineers from
around the world are conducting research in the subject
of cancer in an effort to better understand the disease
and, in the process, discover permanent treatments for
each form of cancer. Even though the process is drawn
out and challenging, having greater knowledge can help
doctors treat cancer patients more successfully. This
inspired us to consider how cancer is discovered and to
use technology to hasten the process. Researchers
studying cancer might save a tone of time and improve
the effectiveness of their work if they can use image
processing to automatically identify cancer cells. This is
because the human error component will be completely
eliminated. Enormous amounts of time and also improve
the effectiveness of the research, as the possibility of
human error will be eliminated entirely.
2. LITERATURE SURVEY
Kumar suggested a brand-new method for detecting
malignancy that makes use of clinically preferred
aspects. This approach is based on the K mean cluster
and segmentation premise. Cell segmentation, feature
extraction, and classification for the enhancement
approach are a few of the processes in this procedure.
The original image was divided into parts using the
image segmentation concept of image processing. During
the feature extraction process, the segmented images are
used to extract the features. When KNN and SVM-based
classifiers are used as the last step in a classification
process, the results are shown for both a wide range of
photos and the images with the selected feature set. [1]
Jain proposed a novel preprocessing technique to
detect lung cancer. In this study, we applied a special
noise reduction method to lessen the noise difference
between the input and output photos. [2]
Ramin suggested an image analysis method for
locating cancer cells and counting the number of
cancerous cells in the source photos. Ramin provided an
image analysis method for the identification of cancer
cells and quantification of the number of malignant cells
in the source images. The four essential steps in this
approach are preprocessing, categorization, bound
regions, and cell counting. During preprocessing, noise
detection for the original image was eliminated.](https://image.slidesharecdn.com/irjet-v9i1017-221108120252-e669ed07/85/CANCER-CLUMPS-DETECTION-USING-IMAGE-PROCESSING-BASED-ON-CELL-COUNTING-1-320.jpg)
![International Research Journal of Engineering and Technology (IRJET) e-ISSN: 2395-0056
Volume: 09 Issue: 10 | Oct 2022 www.irjet.net p-ISSN: 2395-0072
© 2022, IRJET | Impact Factor value: 7.529 | ISO 9001:2008 Certified Journal | Page 94
CANCER CLUMPS DETECTION USING IMAGE PROCESSING BASED ON
CELL COUNTING
Jayashree P K1, Smt. T D Shashikala2
PG Scholor1, Associative Professor2, Department of Electronics and Communication Engineering,
University B.D.T College of Engineering, Davanagere-577004, Karnataka, India
------------------------------------------------------------------------***-------------------------------------------------------------------------
ABSTRACT
One of the leading causes of death in people is cancer.
There has been a lot of research into using image
processing, classification, and techniques to identify and
diagnose cancer. But the illness continues to rank among
the deadliest. As a result, one of the reasons to treat
cancer is not just its early detection. In the proposed
method, cancer cells are identified using image
processing, artificial neural network techniques, area
measurement, and cell clump detection. Using the
suggested method, we can automatically identify
cancerous characteristics in any CT image,
mammography image, or biopsy sample. There were
numerous proposed algorithms, but they lacked
flexibility and had uneven levels of accuracy. The system
pre-processes the input images using a variety of
methods, including grey scaling, binarization, inversion,
and flood fill operation, before applying the proposed
algorithm. If the suggested approach can successfully be
used for automatically detecting cancer cells in a novel
way and fine-tuned with a feedback system, it will open
up new dimensions in the detection of cancer cells in the
field of medical sciences.
Keywords: Image Preprocessing, Image segmentation,
ResNet50.
1. INTRODUCTION
The obstreperous division of abnormal cells is
referred to as cancer. Tumors can be produced by the
spread of cancerous cells through the lymphatic or
circulatory systems. But it's important to remember that
not all tumors are malignant. Both benign (not
cancerous) and malignant tumors are possible
(cancerous). Over a hundred different forms of cancer have
been identified, and each type has numerous Sub types with
unique variations. The early stages of cancer detection
are particularly difficult due to the enormous variation.
In the vast majority of cases, the causes of cancer are still
poorly understood. Consequently, cancer treatment
becomes considerably more difficult.
Additionally, due to the disease's extreme
complexity, scientists, physicians, and engineers from
around the world are conducting research in the subject
of cancer in an effort to better understand the disease
and, in the process, discover permanent treatments for
each form of cancer. Even though the process is drawn
out and challenging, having greater knowledge can help
doctors treat cancer patients more successfully. This
inspired us to consider how cancer is discovered and to
use technology to hasten the process. Researchers
studying cancer might save a tone of time and improve
the effectiveness of their work if they can use image
processing to automatically identify cancer cells. This is
because the human error component will be completely
eliminated. Enormous amounts of time and also improve
the effectiveness of the research, as the possibility of
human error will be eliminated entirely.
2. LITERATURE SURVEY
Kumar suggested a brand-new method for detecting
malignancy that makes use of clinically preferred
aspects. This approach is based on the K mean cluster
and segmentation premise. Cell segmentation, feature
extraction, and classification for the enhancement
approach are a few of the processes in this procedure.
The original image was divided into parts using the
image segmentation concept of image processing. During
the feature extraction process, the segmented images are
used to extract the features. When KNN and SVM-based
classifiers are used as the last step in a classification
process, the results are shown for both a wide range of
photos and the images with the selected feature set. [1]
Jain proposed a novel preprocessing technique to
detect lung cancer. In this study, we applied a special
noise reduction method to lessen the noise difference
between the input and output photos. [2]
Ramin suggested an image analysis method for
locating cancer cells and counting the number of
cancerous cells in the source photos. Ramin provided an
image analysis method for the identification of cancer
cells and quantification of the number of malignant cells
in the source images. The four essential steps in this
approach are preprocessing, categorization, bound
regions, and cell counting. During preprocessing, noise
detection for the original image was eliminated.](https://image.slidesharecdn.com/irjet-v9i1017-221108120252-e669ed07/75/CANCER-CLUMPS-DETECTION-USING-IMAGE-PROCESSING-BASED-ON-CELL-COUNTING-1-2048.jpg)
![International Research Journal of Engineering and Technology (IRJET) e-ISSN: 2395-0056
Volume: 09 Issue: 10 | Oct 2022 www.irjet.net p-ISSN: 2395-0072
© 2022, IRJET | Impact Factor value: 7.529 | ISO 9001:2008 Certified Journal | Page 95
Following the original image's classification using the
KNN method, it will group into the same cluster value.
On the basis of the output from the second stage, we then
count the common cells in the third step. The bound
nucleus separation process uses the local thresholding
technique. Regarding error ratio and standard deviation,
the results are good. [3]
Using the transform Technique, Thilagavathi
introduced a novel technique for counting red blood
cells. Red blood cell estimation uses this approach. The
five phases of this method are presented. Feature
extraction, segmentation, image collection,
preprocessing, and counting. Apply the basic XOR
operation to two binary images after determining the
lower and upper threshold values for segmentation,
preprocessing with the saturation image, and
segmentation. One of the most popular ways to identify
cancer is often through digital mammography. Many
different solutions were presented in response to the
multiple categorization problems for the digital
mammography image. Many features are retrieved in
this employing different standard procedures and
fundamental notation. The tumour in this area is
calculated using the MLE technique. One of the simplest
ways to diagnose breast cancer is by misreading a
mammogram. By doing this, we can locate and refine the
image's edges. Finally, determine the size of the tissues
and distribution in a picture without segmenting it.
Additionally, cancer cells now have a quick and delicate
location thanks to nanotechnology. The contaminated
cells in a human body can be identified and eliminated
using nanotechnology. [4]
Mello suggested two techniques for finding
cancer cells inside a human body. These two approaches
are differentiated by their use of colour. The RGB colour
format of the input image is converted to the HSL colour
model in this. To the binarization, the HSL colour model
is employed. The edges of the binarization image are
filtered to make them more rounded. [5]
3: DATASET
Since this work is intended for all type of cancer cell
detection the dataset on cancer is available in
www.kaggle.com.
4: METHODOLOGY
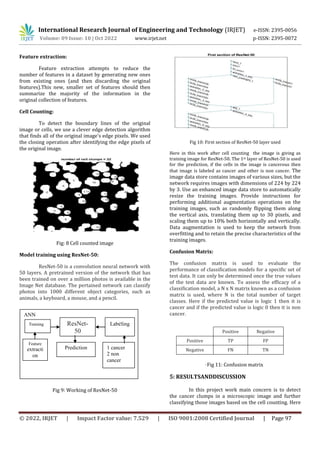
Fig: 1 Block diagram
To obtain more accurate results, the input image
must go through a number of steps. These steps consist
of
Image acquisition:
The cancer cell image considered hr for this work is
Which is a microscopic image which is of size (90x90)
Since this is too small for processing it needs resizing of
the image.
Fig 2: Input cancer cell image (size 90x 90)
RGB to Gray Conversion:
Using the RGB to Gray () function and the
Luminosity Method, which states that 3-dimensional
colour has three different wavelengths and their own
contribution, we must take the average according to
their own contribution and is given by the following
equation, the original input cancer image is converted
into a grayscale image to reduce the noise level of the
image and for further segmentation.
Grayscale=0.299R+0.587g+0.114B.
OUTPUT
DATA
SET OF
IMGAES
IMAGE
SELECTION
PREPROCESSI
NG
CELL
COUNTING
FEATURE
EXTRACTION
SEGMENTATI
ON
MODEL
TRAINING
(RESNET-
50)
PREDICTI
ON](https://image.slidesharecdn.com/irjet-v9i1017-221108120252-e669ed07/85/CANCER-CLUMPS-DETECTION-USING-IMAGE-PROCESSING-BASED-ON-CELL-COUNTING-2-320.jpg)

This document describes a proposed method for detecting cancer clumps using image processing techniques including cell counting. The method involves preprocessing images using techniques like grayscaling, binarization, and edge detection. Cancer cells are then identified and segmented. Features are extracted from the segmented regions and fed into a deep learning model for classification and counting of cancer cells. The proposed approach aims to automatically detect cancer cells in images as a way to help speed up cancer research and improve accuracy over existing methods. If successfully implemented and refined with feedback, it could open new avenues for cancer cell detection in medical imaging.


![11.[37 46]segmentation and feature extraction of tumors from digital mammograms](https://cdn.slidesharecdn.com/ss_thumbnails/11-37-46segmentationandfeatureextractionoftumorsfromdigitalmammograms-120512235750-phpapp02-thumbnail.jpg?width=640&height=640&fit=bounds)