Download to read offline
![International Research Journal of Engineering and Technology (IRJET) e-ISSN: 2395-0056
Volume: 05 Issue: 06 | June-2018 www.irjet.net p-ISSN: 2395-0072
© 2018, IRJET | Impact Factor value: 6.171 | ISO 9001:2008 Certified Journal | Page 432
Automated Dengue Detection
Reenu Marie Philip1, Gopakumar G2
1M-Tech Student, CSE Dept., College of Engineering, Chengannur, Kerala, India
2 Associate Professor, CSE Dept., College of Engineering, Chengannur, Kerala, India
---------------------------------------------------------------------***---------------------------------------------------------------------
Abstract - Dengue is a major health problem in tropical
and Asia-Pacific regions which typically spreads rapidly in
number of infection patients. Knowingthatmostoftheworld's
population living in risk areas, in order to diagnose and treat
the disease, high skilled experts and human resources are
needed. However, in some cases human error potentially may
occur. Therefore, a new method of automated dengue
detection is developed. For that white blood cell classification
and classified the dengue as infected or not. In this paper,
comparison based on SVM and two layer feed forward
network. From that, two layer feed forward network has
better accuracy than SVM. This work is also implemented in
CNN.
Key Words: infected, non- infected, white blood cell,
SVM, CNN
1. INTRODUCTION
The Dengue is a major health problem in tropical and Asia
Pacific regions, and it has been spreading for rapidly
more than 50 years. The diseases are caused by viruses
transmitted of mosquito borne. Each year, 50-100 million
people had been dengue infection.75% of the world's
population lives in high risk areas [1]. The health and
economy affected. The major symptom of patients appears
as a fever and plasma of blood leakage that affected shock
syndrome and causes of death. Risk reduction is important
factors of patients are getting diagnosed and should been
treated correctly and quickly.
Dengue is spread by several speciesof mosquitooftheAedes
type, A .aegypti. The virus has five different types; infection
with one type usually gives lifelong immunity to that type,
but only short-term immunity to the others. Subsequent
infection with a different type increases the risk of severe
complications. A number of tests are availableto confirmthe
diagnosis including detecting antibodies to the virus or its
RNA. A novel vaccine for dengue fever has been approved
and is commercially available to confirm diagnoseincluding
detecting antibodies to virus or its RNA.
Symptoms typically begin three to fourteen days after
infection. This may include a high fever, headache, vomiting,
muscle and joint pains, and a characteristic skin r a s h .
Recovery generally takes two to seven days. In a small
proportion of cases, the disease develops into the life-
threatening dengue hemorrhagicfever,resultingin bleeding,
low levels of blood platelets and blood plasma leakage, or
into dengue shock syndrome, where dangerously low
blood pressure occurs.
Dengue has become a global problem since the Second
World War and is common in more than 110 countries.Each
year between 50 and 528 million people are infected and
approximately 10,000 to 20,000 die. The earliest
descriptions of an outbreak date from 1779. Its viral cause
and spread were understood by the early 20th century.
Apart from eliminating the mosquitoes, work is ongoing for
medication targeted directly at the virus. It is classified as a
neglected tropical disease.
2. LITERATURE SURVEY
Previous research is used to classify white blood cells
based on the edges of cells. The focus is selection of
feature extraction and classification method.
S.S.Savkare, S.P.Narote [2] proposed median filter which is
used to remove noise.
Kaushiki Roy, Ratnadeep Dey, Debotosh Bhattacharjee,Mita
Nasipuri, Pramit Ghosh[3],average filter is developed. It has
advantage that single pixel representation and
disadvantage that autocorrelation.
Prabhjot Kaur, Vishakha Sharma, Nishatha Garg [4]
proposed a method called Gaussian low pass filter. It has
advantage that it preserves noise but not preserves details.
Sheng-Fuu Lin, Yu-Bi Hong[5]method of region growth
segmentation is presented. It has advantages that correctly
separate the region and identify and set the boundary. It
disadvantage that choice of kernel and inexpensive and
sensitive to noise.
Ashwini Rejintal, Aswini N [6] proposed GLCM method. It
advantage has Computational complexity of this method is
very less. It disadvantage that ignores the spatial
relationship between the texture patterns and sensitive
towards noise.
Sarach Tantikittil, Sompong Tumswadi, Wichian
Premchaiswadi [7] proposed Decision tree method. It
advantage has Assign values to problem. It has
disadvantage that Very complex.
Alfred R. J. Katz [8] did a research for classification of five
major types of white blood cells.The bestaccurate technique
for classification of supervised learning is a neural network
technique.](https://image.slidesharecdn.com/irjet-v5i689-180726103900/85/IRJET-Automated-Dengue-Detection-1-320.jpg)
![International Research Journal of Engineering and Technology (IRJET) e-ISSN: 2395-0056
Volume: 05 Issue: 06 | June-2018 www.irjet.net p-ISSN: 2395-0072
© 2018, IRJET | Impact Factor value: 6.171 | ISO 9001:2008 Certified Journal | Page 432
Automated Dengue Detection
Reenu Marie Philip1, Gopakumar G2
1M-Tech Student, CSE Dept., College of Engineering, Chengannur, Kerala, India
2 Associate Professor, CSE Dept., College of Engineering, Chengannur, Kerala, India
---------------------------------------------------------------------***---------------------------------------------------------------------
Abstract - Dengue is a major health problem in tropical
and Asia-Pacific regions which typically spreads rapidly in
number of infection patients. Knowingthatmostoftheworld's
population living in risk areas, in order to diagnose and treat
the disease, high skilled experts and human resources are
needed. However, in some cases human error potentially may
occur. Therefore, a new method of automated dengue
detection is developed. For that white blood cell classification
and classified the dengue as infected or not. In this paper,
comparison based on SVM and two layer feed forward
network. From that, two layer feed forward network has
better accuracy than SVM. This work is also implemented in
CNN.
Key Words: infected, non- infected, white blood cell,
SVM, CNN
1. INTRODUCTION
The Dengue is a major health problem in tropical and Asia
Pacific regions, and it has been spreading for rapidly
more than 50 years. The diseases are caused by viruses
transmitted of mosquito borne. Each year, 50-100 million
people had been dengue infection.75% of the world's
population lives in high risk areas [1]. The health and
economy affected. The major symptom of patients appears
as a fever and plasma of blood leakage that affected shock
syndrome and causes of death. Risk reduction is important
factors of patients are getting diagnosed and should been
treated correctly and quickly.
Dengue is spread by several speciesof mosquitooftheAedes
type, A .aegypti. The virus has five different types; infection
with one type usually gives lifelong immunity to that type,
but only short-term immunity to the others. Subsequent
infection with a different type increases the risk of severe
complications. A number of tests are availableto confirmthe
diagnosis including detecting antibodies to the virus or its
RNA. A novel vaccine for dengue fever has been approved
and is commercially available to confirm diagnoseincluding
detecting antibodies to virus or its RNA.
Symptoms typically begin three to fourteen days after
infection. This may include a high fever, headache, vomiting,
muscle and joint pains, and a characteristic skin r a s h .
Recovery generally takes two to seven days. In a small
proportion of cases, the disease develops into the life-
threatening dengue hemorrhagicfever,resultingin bleeding,
low levels of blood platelets and blood plasma leakage, or
into dengue shock syndrome, where dangerously low
blood pressure occurs.
Dengue has become a global problem since the Second
World War and is common in more than 110 countries.Each
year between 50 and 528 million people are infected and
approximately 10,000 to 20,000 die. The earliest
descriptions of an outbreak date from 1779. Its viral cause
and spread were understood by the early 20th century.
Apart from eliminating the mosquitoes, work is ongoing for
medication targeted directly at the virus. It is classified as a
neglected tropical disease.
2. LITERATURE SURVEY
Previous research is used to classify white blood cells
based on the edges of cells. The focus is selection of
feature extraction and classification method.
S.S.Savkare, S.P.Narote [2] proposed median filter which is
used to remove noise.
Kaushiki Roy, Ratnadeep Dey, Debotosh Bhattacharjee,Mita
Nasipuri, Pramit Ghosh[3],average filter is developed. It has
advantage that single pixel representation and
disadvantage that autocorrelation.
Prabhjot Kaur, Vishakha Sharma, Nishatha Garg [4]
proposed a method called Gaussian low pass filter. It has
advantage that it preserves noise but not preserves details.
Sheng-Fuu Lin, Yu-Bi Hong[5]method of region growth
segmentation is presented. It has advantages that correctly
separate the region and identify and set the boundary. It
disadvantage that choice of kernel and inexpensive and
sensitive to noise.
Ashwini Rejintal, Aswini N [6] proposed GLCM method. It
advantage has Computational complexity of this method is
very less. It disadvantage that ignores the spatial
relationship between the texture patterns and sensitive
towards noise.
Sarach Tantikittil, Sompong Tumswadi, Wichian
Premchaiswadi [7] proposed Decision tree method. It
advantage has Assign values to problem. It has
disadvantage that Very complex.
Alfred R. J. Katz [8] did a research for classification of five
major types of white blood cells.The bestaccurate technique
for classification of supervised learning is a neural network
technique.](https://image.slidesharecdn.com/irjet-v5i689-180726103900/75/IRJET-Automated-Dengue-Detection-1-2048.jpg)
![International Research Journal of Engineering and Technology (IRJET) e-ISSN: 2395-0056
Volume: 05 Issue: 06 | June-2018 www.irjet.net p-ISSN: 2395-0072
© 2018, IRJET | Impact Factor value: 6.171 | ISO 9001:2008 Certified Journal | Page 433
Ms. MinaI D. Joshi, Prof Atul H. Karode, and Prof
S.R.Suralkar [9] did a research and studied white blood cell
detection and classification of acute Leukemia by image of
blood cells. And classification using a K-nearest neighbor
(kNN), with 93% of accuracy.
Monica Madhukar and colleagues [10] research decision
support tools for the classification of acute lymphoblastic
leukemia. They used K-means Clustering techniques of
the Lab color model for image segmentation at accuracy
93.5%.
Different techniques are applied and for preprocessing
median filter, segmentation morphological thersholding,
feature extraction SIFT and classificationSVM.Awhite blood
cells classification processing to apply the detection of
dengue.
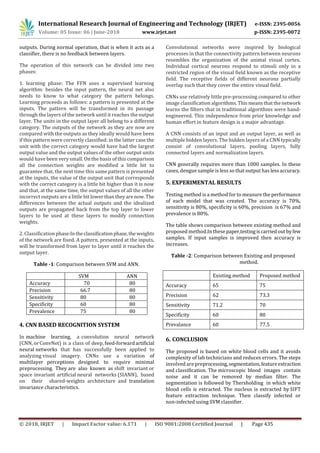
3. REASEARCH METHODOLOGY
In the proposed system, blood imagesarecaptured bydigital
microscope. In preprocessing, these image
contain noise so median filter is used to remove noise. It is
segmented by Morphological thersholding segmentation. In
feature extraction, features of white blood cell nucleus is
extracted by SIFT algorithm .By SVM classifier classify as
infected or non infected.
Fig -1: Systematic Flow
A. Acquisition
Images of blood smear are captured by microscope attached
with camera.Blood stain used is Leishman blood smear.
Fig -2: Image Acquisition
B. Preprocessing
Poisson noise: Poisson noise or Shot noise is a type of
electronic noise which can be modeled by a Poisson process.
Shot noise results from discrete nature of electric charge.
Shot noise may be dominant when the finite number of
particles that carry energy is sufficiently small so that
uncertainties due to the Poisson distribution, which
describes the occurrence of independent random events.
The magnitude of shot noise increases according to the
square root of the expected number of events, such as the
electric current or intensity of light. But since the strength
of the signal itself increases more rapidly, the relative
proportion of shot noise decreases and the signal to noise
ratio (considering only shot noise) increases anyway.
Median filter: The median filter is non-linear filter. It
removes noise effectively as well as preserving sharp edges.
A median filter is more effective than convolution when the
goal is to simultaneouslyreduce noise andpreservenoise[2].
It simply replaces each pixel value by the median of the
intensity level in the neighborhood of the pixel.
Fig -3: Preprocessed input image.
C. Segmentation
For segmentation thersholding is used to extract infected
wbc cell. The simplest thersholding methods replace each
pixel in an image with a black pixel if the image intensity](https://image.slidesharecdn.com/irjet-v5i689-180726103900/85/IRJET-Automated-Dengue-Detection-2-320.jpg)
![International Research Journal of Engineering and Technology (IRJET) e-ISSN: 2395-0056
Volume: 05 Issue: 06 | June-2018 www.irjet.net p-ISSN: 2395-0072
© 2018, IRJET | Impact Factor value: 6.171 | ISO 9001:2008 Certified Journal | Page 434
I(i,j) is less than some fixed constant T(I(i,j)<T) ,or a white
pixel if image is greater than constant.
From a grayscale image, thersholding can be used
to create binary images. This is the method of
separating foreground and background of image. All pixels
with a value higher than the threshold value areclassifiedas
feature pixels. All pixels with a lower value are classified
as background pixels.
Such a distribution is called bimodal because there are
two mode values: one for the background and one for the
feature
Fig -4: Segmented image
D. Feature Extraction
SIFT is quite an involved algorithm. It is used to find
local features.
Fig -5: SIFT Algorithm
1. Constructing scale space: This is the initial preparation.
You create internal representations of the original image to
ensure scale invariance. This is done by generating a “scale
space".
2. LoG Approximation: In the previous step , we created the
scale space of the image. The idea was to blur an image
progressively, shrink it, blur the small image progressively
and so on. Now we use those blurred images to generate
another set of images, the Difference of Gaussians (DoG).
These DoG images are a great for finding out interesting key
points in the image.
3. Finding Key points: Finding key points is a two part
process. a) Locate maxima/minima in DoG images: The first
step is to coarsely locate the maxima and minima. This is
simple. You iterate through each pixel and check all it's
neighbours.If pixel is larger than its neighbors then it is
maxima.
4. Get rid of bad points: Key points generated in the previous
step produce a lot of key points. Some of them lie along an
edge, or they don't have enough contrast. If the magnitudeof
the intensity (i.e., without sign) at the current pixel in the
DoG image(that is being checkedforminima/maxima)isless
than a certain value, it is rejected.
5. For each key point P a squared region R around P is
considered and partitioned in 4x4 parts. An histogram with
8 bins is used for representing the orientation of the
points in each of the sub-regions of R. The final descriptor
associated to P is a vector that concatenates the histograms
of the sub- regions of R.
The descriptor vector has (4x4) x 8 = 128 entries.
E. Classification
This is the final step to detect the given input is infected or
not. Support Vector Machine (SVM) algorithmwaschosen as
it is a promising nonlinear, non parametric classification
technique. The reduced feature set was given as input to
the algorithm. In SVM, the input is considered as an
n-dimensional 12 vector, and the question is whether such
points can be separated with a hyperplane. Multiple
hyper planes might be generated that can classify the data.
From the SVM, accuracy is 70%, sensitivity is 80%,
specificity is 60%, and precision is 66.7%. In order to
improve accuracy, the classification can be done in artificial
neutral network (ANN).
F. Two layer feed forward network.
A feed forward neural network is an artificial
neural network wherein connections between the units do
not form a cycle. It consists of a (possibly large) number
of simple neuron-like processing units, organized in layers.
Every unit in a layer is connected with all the units in the
previous layer.
The weights on these connectionsencodetheknowledge ofa
network. Often the units in a neural network are
also called nodes[8]. Data enters at the inputs and passes
through the network, layer by layer, until it arrives at the](https://image.slidesharecdn.com/irjet-v5i689-180726103900/85/IRJET-Automated-Dengue-Detection-3-320.jpg)
![International Research Journal of Engineering and Technology (IRJET) e-ISSN: 2395-0056
Volume: 05 Issue: 06 | June-2018 www.irjet.net p-ISSN: 2395-0072
© 2018, IRJET | Impact Factor value: 6.171 | ISO 9001:2008 Certified Journal | Page 436
ACKNOWLEDGEMENT
I would like to thank my Principal of the institute Dr. Jacob
Thomas V., HOD Dr. Smitha Dharan, CSE staff, parents and
well-wishers for their immense technical and nontechnical
support.
REFERENCES
[1] World Health Organization, et al. Dengue: guidelines for
diagnosis, treatment, prevention and control. World
Health Organization, 2009.
[2] S.S.Savkare, S.P.Narote , “Blood Cell Segmentation from
Microscopic Blood Images,” 2015 International
Conference on Information Processing
(ICIP)Vishwakarma Institute of Technology. Dec 16-19,
2015
[3] Kaushiki Roy, Ratnadeep Dey, Debotosh Bhattacharjee,
Mita Nasipuri, Pramit Ghosh, “An Automated system for
platelet segmentation using histogram-based
thersholding”,IEEE 2016.
[4]Prabhjot Kaur,Vishakha Sharma,Nishatha Garg,
“Platelet Count Using Image Processing”,IEEE2016.
[5] Sheng-Fuu Lin, Yu-Bi Hong, “Differential Count of White
Blood Cell in Noisy Normal Blood Smear”,IEEE2011.
[6] Ashwini Rejintal, Aswini N, “ Image Processing Based
Leukemia Cancer Cell Detection”, IEEE International
Conference On RecentTrendsInElectronicsInformation
Communication Technology, May 20-21, 2016, India.
[7]Sarach Tantikittil, Sompong Tumswadi, Wichian
Premchaiswadi, “Image Processing for Detection of
Dengue Virus based on WBC Classification and Decision
Tree”, 2015 Thirteenth International Conference on
ICT and Knowledge Engineering.
[8] Katz, Alfred RJ. "Image Analysis and Supervised learning
in the automated Differentiation of White Blood cells
from Microscopic Images." ,2000.
[9] Joshi, Ms Minai D., Atul H. Karode, and S. R. Surakarta.
"White Blood Cells Segmentation and Classification to
Detect Acute Leukemia." International Journal of
Emerging Trends & Technology in Computer Science
(lJETTCS) 2.3, pp.147-151, 2013.
[10] Madhukar, Monica, Sos Agaian, and AnthonyT.
Chronopoulos "New decision support tool for acute
lymphoblastic leukemia classification." IS&T/SPIE
Electronic Imaging International Society for Optics and
Photonics, 2012 Trends & Technology in Computer
Sciences (lJETTCS) 2.3, pp.147-151, 2013.](https://image.slidesharecdn.com/irjet-v5i689-180726103900/85/IRJET-Automated-Dengue-Detection-5-320.jpg)

This document presents a method for automated detection of dengue virus infection using images of white blood cells. The method involves preprocessing images using median filtering to remove noise, segmentation of white blood cells using morphological thresholding, feature extraction of cell nuclei using SIFT, and classification of cells as infected or non-infected using support vector machines (SVM). Testing showed the method achieved higher accuracy than existing techniques, with 75% accuracy compared to 65% for existing methods. The authors also explored using a two-layer feedforward neural network for classification, which achieved even higher accuracy than SVM.