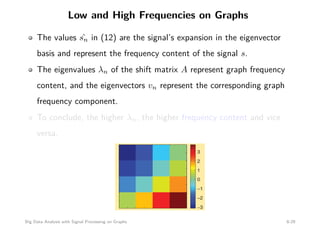
This document discusses signal processing on graphs and big data analysis using graph theory concepts. It begins with introducing fundamental graph theory terms like nodes, edges, and adjacency matrices. It then explains how to define graph signals and how signal processing concepts like shifting, filtering, and Fourier transforms can be generalized to graphs. In particular, it describes how the graph shift replaces time shifts, graph filters are polynomials of the graph shift matrix, and the graph Fourier transform uses the eigenvectors of the graph shift matrix as the basis. The document concludes by discussing how eigenvalues represent frequencies on graphs and how filters affect the frequency content of graph signals.
This document summarizes different approaches for structure learning in graph neural networks. It discusses three main classes of methods: 1) metric-based learning which learns a similarity matrix between nodes, 2) probabilistic models which learn the parameters of a distribution over graphs, and 3) direct optimization which directly optimizes the graph adjacency matrix. The document provides examples of methods within each class and notes challenges such as the simplicity of probabilistic models and computational difficulties of direct optimization.
Yuri Boykov — Combinatorial optimization for higher-order segmentation functi...Yandex
This document discusses higher-order segmentation functionals for image segmentation. It begins with an overview of different surface representations and optimization approaches for segmentation, including continuous, combinatorial, and mixed optimization. The main focus is on combinatorial optimization using graph cuts. The talk will cover minimizing entropy and color consistency functionals for image segmentation. It will also discuss convex cardinality potentials, distribution consistency, and extending boundary regularization from length to curvature.
The document discusses various concepts related to digital image processing including:
1) The relationships between pixels in an image including 4-neighbors, 8-neighbors, and m-neighbors of a pixel.
2) The concepts of adjacency and connectivity between pixels based on their intensity values and whether they are neighbors.
3) Computing the shortest path between two pixels using 4, 8, or m-adjacency and examples calculating these paths.
Core–periphery detection in networks with nonlinear Perron eigenvectorsFrancesco Tudisco
Core–periphery detection is a highly relevant task in exploratory network analysis. Given a network of nodes and edges, one is interested in revealing the presence and measuring the consistency of a core–periphery structure using only the network topology. This mesoscale network structure consists of two sets: the core, a set of nodes that is highly connected across the whole network, and the periphery, a set of nodes that is well connected only to the nodes that are in the core. Networks with such a core–periphery structure have been observed in several applications, including economic, social, communication and citation networks.
In this talk we discuss a new core–periphery detection model based on the optimization of a class of core–periphery quality functions. While the quality measures are highly nonconvex in general and thus hardly treatable, we show that the global solution coincides with the nonlinear Perron eigenvector of a suitably defined parameter dependent matrix M(x), i.e. the positive solution to the nonlinear eigenvector problem M(x)x=λx. Using recent advances in nonlinear Perron–Frobeniustheory, we discuss uniqueness of the global solution and we propose a nonlinear power method-type scheme that (a) allows us to solve the optimization problem with global convergence guarantees and (b) effectively scales to very large and sparse networks. Finally, we present several numerical experiments showing that the new method largely out-performs state-of-the-art techniques for core-periphery detection.
We are interested in finding a permutation of the entries of a given square matrix so that the maximum number of its nonzero entries are moved to one of the corners in a L-shaped fashion.
If we interpret the nonzero entries of the matrix as the edges of a graph, this problem boils down to the so-called core–periphery structure, consisting of two sets: the core, a set of nodes that is highly connected across the whole graph, and the periphery, a set of nodes that is well connected only to the nodes that are in the core.
Matrix reordering problems have applications in sparse factorizations and preconditioning, while revealing core–periphery structures in networks has applications in economic, social and communication networks.
k-MLE: A fast algorithm for learning statistical mixture modelsFrank Nielsen
This document describes a fast algorithm called k-MLE for learning statistical mixture models. k-MLE is based on the connection between exponential family mixture models and Bregman divergences. It extends Lloyd's k-means clustering algorithm to optimize the complete log-likelihood of an exponential family mixture model using Bregman divergences. The algorithm iterates between assigning data points to clusters based on Bregman divergence, and updating the cluster parameters by taking the Bregman centroid of each cluster's assigned points. This provides a fast method for maximum likelihood estimation of exponential family mixture models.
A Hough Transform Based On a Map-Reduce AlgorithmIJERA Editor
This paper presents a method that proposes the composition of the Map-Reduce algorithm and the Hough
Transform method to research particular features of shape in the Big Data of images. We introduce the first
formal translation of the Hough Transform method into the Map-Reduce pattern. The Hough transform is
applied to one image or to several images in parallel. The context of the application of this method concerns Big
Data that requires Map-Reduce functions to improve the processing time and the need of object detection in
noisy pictures with the Hough Transform method.
Lec-17: Sparse Signal Processing & Applications [notes]
Sparse signal processing, recovery of sparse signal via L1 minimization. Applications including face recognition, coupled dictionary learning for image super-resolution.
This document contains answers to multiple questions about image processing concepts. For question 22a, the kernel formed by the outer product of vectors v and wT is determined to be separable. For question 22b, it is explained that a separable kernel w can be decomposed into two simpler kernels w1 and w2 such that w = w1 * w2. This allows the convolution to be computed more efficiently in two steps by first convolving w1 with the image and then convolving the result with w2, requiring fewer operations than a direct convolution with w.
International Journal of Managing Information Technology (IJMIT)IJMIT JOURNAL
We present an improved SPFA algorithm for the single source shortest path problem. For a random graph, the empirical average time complexity is O(|E|), where |E| is the number of edges of the input network. SPFA maintains a queue of candidate vertices and add a vertex to the queue only if that vertex is relaxed. In the improved SPFA, MinPoP principle is employed to improve the quality of the queue. We theoretically analyse the advantage of this new algorithm and experimentally demonstrate that the algorithm is efficient
An improved spfa algorithm for single source shortest path problem using forw...IJMIT JOURNAL
We present an improved SPFA algorithm for the single source shortest path problem. For a random graph,
the empirical average time complexity is O(|E|), where |E| is the number of edges of the input network.
SPFA maintains a queue of candidate vertices and add a vertex to the queue only if that vertex is relaxed.
In the improved SPFA, MinPoP principle is employed to improve the quality of the queue. We theoretically
analyse the advantage of this new algorithm and experimentally demonstrate that the algorithm is efficient.
From RNN to neural networks for cyclic undirected graphstuxette
This document discusses different neural network methods for processing graph-structured data. It begins by describing recurrent neural networks (RNNs) and their limitations for graphs, such as an inability to handle undirected or cyclic graphs. It then summarizes two alternative approaches: one that uses contraction maps to allow recurrent updates on arbitrary graphs, and one that employs a constructive architecture with frozen neurons to avoid issues with cycles. Both methods aim to make predictions at the node or graph level on relational data like molecules or web pages.
Polyhedral computations in computational algebraic geometry and optimizationVissarion Fisikopoulos
The document summarizes a talk on polyhedral computations in computational algebraic geometry and optimization. It discusses algorithms for enumerating vertices of resultant polytopes and 2-level polytopes. Applications include support computation for implicit equations and computing resultants and discriminants. Open problems include finding the maximum number of faces of 4-dimensional resultant polytopes and explaining symmetries in their maximal f-vectors.
Lec-07: Feature Aggregation and Image Retrieval System [notes]
Image retrieval system performance metrics, precision, recall, true positive rate, false positive rate; Bag of Words (BoW) and VLAD aggregation.
rit seminars-privacy assured outsourcing of image reconstruction services in ...thahirakabeer
This document proposes a privacy-assured outsourced image reconstruction service (OIRS) in the cloud. It addresses challenges of security, complexity, and efficiency when outsourcing image services. The OIRS architecture uses random linear transformations to encrypt data before sending to the cloud. This allows the cloud to efficiently solve the encrypted optimization problem and return an encrypted result without learning private image information. Experimental results show the OIRS approach brings over 3x computational savings compared to traditional methods, while still effectively reconstructing images from the encrypted data with good visual quality.
This document presents a generalized framework for semi-supervised learning on graphs using spectral graph wavelet transformation (SGWT). It introduces SGWT which provides a multiscale representation of functions on graphs. A regularization framework is proposed that uses SGWT coefficients, which tends to be sparse. This is applied to semi-supervised squared loss regression and support vector machines on graphs. Experiments demonstrate the ability to capture discontinuities and robustness to noise and graph variations.
Training and Inference for Deep Gaussian ProcessesKeyon Vafa
The document discusses training and inference for deep Gaussian processes (DGPs). It introduces the Deep Gaussian Process Sampling (DGPS) algorithm for learning DGPs. The DGPS algorithm relies on Monte Carlo sampling to circumvent the intractability of exact inference in DGPs. It is described as being more straightforward than existing DGP methods and able to more easily adapt to using arbitrary kernels. The document provides background on Gaussian processes and motivation for using deep Gaussian processes before describing the DGPS algorithm in more detail.
The Shortest Path Tour Problem is an extension to the normal Shortest Path Problem and appeared in the scientific literature in Bertsekas's dynamic programming and optimal control book in 2005, for the first time. This paper gives a description of the problem, two algorithms to solve it. Results to the numeric experimentation are given in terms of graphs. Finally, conclusion and discussions are made.
This document summarizes and compares two popular Python libraries for graph neural networks - Spektral and PyTorch Geometric. It begins by providing an overview of the basic functionality and architecture of each library. It then discusses how each library handles data loading and mini-batching of graph data. The document reviews several common message passing layer types implemented in both libraries. It provides an example comparison of using each library for a node classification task on the Cora dataset. Finally, it discusses a graph classification comparison in PyTorch Geometric using different message passing and pooling layers on the IMDB-binary dataset.
Rate distortion theory calculates the minimum bit rate R needed to represent a source within a given distortion D. Scalar quantization maps samples to reconstruction levels, minimizing the distortion between original and reconstructed values. Optimal quantizers like Lloyd-Max iteratively assign samples to levels and update levels to centroids. Entropy-constrained quantization assigns variable length codes to levels to minimize a rate-distortion cost function.
The document discusses various image filtering techniques in the frequency domain. It begins by introducing convolution as frequency domain filtering using the Fourier transform. It then provides examples of low pass and high pass filtering using sharp cut-off and Gaussian filters. Additional topics covered include the Butterworth filter, homomorphic filtering to separate illumination and reflectance, and systematic design of 2D finite impulse response (FIR) filters.
This document summarizes an academic paper presented at the International Conference on Emerging Trends in Engineering and Management in 2014. The paper proposes a design and implementation of an elliptic curve scalar multiplier on a field programmable gate array (FPGA) using the Karatsuba algorithm. It aims to reduce hardware complexity by using a polynomial basis representation of finite fields and projective coordinate representation of elliptic curves. Key mathematical concepts like finite fields, point addition, and point doubling that are important to elliptic curve cryptography are also discussed at a high level.
This document discusses graph kernels, which are positive definite kernels defined on graphs that allow applying machine learning algorithms to graph-structured data like molecules. It covers different types of graph kernels like subgraph kernels, path kernels, and walk kernels. Walk kernels count the number of walks between two graphs and can be computed efficiently in polynomial time, unlike subgraph and path kernels. The document also discusses using product graphs to compute walk kernels and presents results on classifying mutagenicity using random walk kernels. It concludes by proposing using graph kernels and product graphs to define data depth measures for labeled graph ensembles.
This presentation, by big data guru Bernard Marr, outlines in simple terms what Big Data is and how it is used today. It covers the 5 V's of Big Data as well as a number of high value use cases.
Session (1) of recruitment campaign.
-The admission of NU is open now.
For any information:
* Website: http://en.nu.edu.eg/
*Admission email: admission@nu.edu.eg
*Seif's email: m.seif@nu.edu.eg
Case study : Backing Australia's AbilityMohamed Seif
The document summarizes the Australian government's efforts to improve its national innovation system from the 1990s onwards. It discusses initiatives like "Investment for Growth" in 1997, the "Knowledge and Innovation" policy in 1999, and the flagship "Backing Australia's Ability" strategy from 2004. This 5-year $2.9 billion strategy aimed to strengthen idea generation, accelerate commercialization, develop skills, and link government, universities, research institutions and businesses. However, it was criticized for its lack of strategic focus and collaboration. Weaknesses included poor business innovation culture, lack of operational innovation, and insufficient venture capital and skills development.
This document discusses advice for academics and researchers. It begins by listing tips for being a "bad grad student", such as focusing only on grades and delaying research. Next, it provides suggestions for having a "bad research career", like refusing collaboration and never defining milestones. The document then references notable researchers and gives life advice from experts in the field. Overall, the document humorously outlines improper approaches to an academic career and research.
Interference management in spectrally and energy efficient wireless networksMohamed Seif
The document discusses interference management techniques for wireless networks. It covers interference management with limited channel state information, sparse spectrum sensing in cognitive radio networks, device-to-device communications, and machine-to-machine communications. The document also discusses interference management schemes like interference creation and resurrection that aim to achieve higher degrees of freedom through synergistic use of different channel state information states over time.
The document discusses the need for instant learning resources to help bridge the disconnect between students and educational materials. It introduces the UA Think Tank tutoring service, which provides certified and peer-rated tutors on demand and has been shown to improve student retention and graduation rates. The document also includes budget planning information for the first year of the UA Think Tank service.
This document summarizes simulation results for spectrum sensing using compressive sensing in cognitive radio networks. It shows that an infrastructure-less approach using a consensus algorithm can achieve detection performance close to a centralized approach, and discusses the impact of varying parameters like the number of iterations, link quality between nodes, and number of measurements. Key results include infrastructure-less achieving near-centralized detection accuracy with enough iterations or measurements, and better connectivity and higher SNR improving performance.
Sparse Spectrum Sensing in Infrastructure-less Cognitive Radio Networks via B...Mohamed Seif
The document presents a system model for sparse spectrum sensing in infrastructure-less cognitive radio networks using binary consensus algorithms. It discusses compressive sensing theory which combines signal acquisition and compression. A vector consensus problem is formulated for an infrastructure-less cognitive radio network where nodes cooperatively sense spectrum occupancy through local interactions. Simulation results show that the infrastructure-less approach achieves detection performance comparable to a centralized architecture and that detection probability increases with the number of measurements and link quality while decreasing with sparsity level.
Free Space Optics (FSO) uses visible light communication or infrared light to transmit data wirelessly over short to medium distances. It provides high-speed connectivity as an alternative to fiber for the "last mile" between buildings. FSO has advantages of high data rates up to 2.5 Gbps, easy installation without wiring, and high security. However, it also faces challenges of signal attenuation from factors like sunlight, fog, clouds, and building sway requiring techniques like automatic tracking and large beam divergence to maintain alignment. FSO is best suited for short-distance last mile connections between buildings where fiber may be difficult to install.
Interference Management with Limited Channel State Information in Wireless Ne...Mohamed Seif
This document discusses interference management in wireless networks with limited channel state information (CSI). It begins by motivating the problem of interference in wireless communications and introduces the concept of degrees of freedom (DoF) to characterize network capacity in the high SNR regime. It then discusses challenges in obtaining accurate CSI at transmitters due to feedback errors and delays. The document proposes an interference creation-resurrection (ICR) scheme that achieves 9/5 DoF for the 3-user MISO broadcast channel with alternating CSI, by intentionally creating interference that is later resurrected when CSI becomes available. It also characterizes the DoF region for the 3-user BC given a CSI distribution.
The document provides an overview of big data analysis and parallel programming tools for R. It discusses what constitutes big data, popular big data applications, and relevant hardware and software. It then covers parallel programming challenges and approaches in R, including using multicore processors with the multicore package, SMP and cluster programming with foreach and doMC/doSNOW, NoSQL databases like Redis with doRedis, and job scheduling. The goal is to help users effectively analyze big data in R by leveraging parallelism.
The document discusses the future of 5G communications, which presents both challenges and opportunities. Key points include: (1) 5G will utilize millimeter wave spectrum which provides huge amounts of available bandwidth but faces challenges like blockage and link budget issues; (2) massive MIMO and beamforming techniques can help overcome some of the mmWave challenges by providing improved capacity, reliability and interference resilience; and (3) open research questions remain around topics like interference management, spectrum utilization, and fundamental performance limits as 5G technologies continue to develop over the next few years.
Achievable Degrees of Freedom of the K-user MISO Broadcast Channel with Alter...Mohamed Seif
The document analyzes the degrees of freedom (DoF) for the K-user multiple-input single-output (MISO) broadcast channel with alternating channel state information at the transmitters (CSIT). It proposes a transmission scheme where CSIT alternates between perfect, delayed, and no CSIT states. The scheme achieves a DoF of K^2/(2K-1), which is higher than models with only delayed CSIT. Comparisons of the DoF between the proposed alternating CSIT scheme and existing delayed CSIT schemes are presented for the broadcast channel and X-channel models.
Extract business value by analyzing large volumes of multi-structured data from various sources such as databases, websites, blogs, social media, smart sensors...
Label propagation - Semisupervised Learning with Applications to NLPDavid Przybilla
Label propagation is a semi-supervised learning algorithm that propagates labels from a small set of labeled data points to unlabeled data points. The algorithm constructs a graph with nodes for each data point and weighted edges representing similarity between points. It then iteratively propagates the labels across the graph from labeled to unlabeled points until convergence, resulting in "soft" probabilistic labels for all points. The algorithm aims to minimize an energy function that encourages points connected by strong edges to receive similar labels. It performs well with limited labeled data by leveraging the graph structure to make predictions for unlabeled points.
This document discusses analyzing the Iris flower data set using R. It provides an overview of the Iris data, which contains measurements of Iris flowers from three species. Various data exploration techniques are demonstrated, including scatter plots, box plots, histograms and outlier detection. Clustering, classification and regression algorithms are explored, such as k-means clustering, Fisher's linear discriminant analysis, and linear regression. The document serves as a tutorial for analyzing a sample data set using common statistical and machine learning methods in R.
Big data refers to the massive amounts of unstructured data that are growing exponentially. Hadoop is an open-source framework that allows processing and storing large data sets across clusters of commodity hardware. It provides reliability and scalability through its distributed file system HDFS and MapReduce programming model. The Hadoop ecosystem includes components like Hive, Pig, HBase, Flume, Oozie, and Mahout that provide SQL-like queries, data flows, NoSQL capabilities, data ingestion, workflows, and machine learning. Microsoft integrates Hadoop with its BI and analytics tools to enable insights from diverse data sources.
This document proposes using spectral clustering based on the normalized graph Laplacian spectrum to solve problems in community detection and handwritten digit recognition. It summarizes the key concepts in graph signal processing and introduces spectral clustering. The paper provides a mathematical proof that the signs of the second eigenvector components of the normalized graph Laplacian can accurately partition a graph into two communities. It then applies this spectral clustering method to community detection and digit recognition, comparing results to other popular algorithms to demonstrate the advantages of the spectral clustering approach.
Graph theory concepts complex networks presents-rouhollah nabatinabati
This document provides an introduction to network and social network analysis theory, including basic concepts of graph theory and network structures. It defines what a network and graph are, explains what network theory techniques are used for, and gives examples of real-world networks that can be represented as graphs. It also summarizes key graph theory concepts such as nodes, edges, walks, paths, cycles, connectedness, degree, and centrality measures.
This document summarizes three applications of linear algebra:
1) Fast integer multiplication, which can be done in O(n log n) time using linear algebra and Fourier transforms to represent integers as polynomials and multiply the polynomials.
2) Data structures like databases and graphs can be represented using matrices and vectors from linear algebra.
3) Multimedia like images, sound, and video can be stored as vectors and matrices, with images as pixel arrays, sound as amplitude arrays, and video as arrays of images.
I am Irene M. I am a Diffusion Assignment Expert at statisticsassignmenthelp.com. I hold a Masters in Statistics from California, USA.
I have been helping students with their homework for the past 8 years. I solve assignments related to Diffusion. Visit statisticsassignmenthelp.com or email info@statisticsassignmenthelp.com.
You can also call on +1 678 648 4277 for any assistance with Diffusion Assignments.
ON ALGORITHMIC PROBLEMS CONCERNING GRAPHS OF HIGHER DEGREE OF SYMMETRYFransiskeran
Since the ancient determination of the five platonic solids the study of symmetry and regularity has always
been one of the most fascinating aspects of mathematics. One intriguing phenomenon of studies in graph
theory is the fact that quite often arithmetic regularity properties of a graph imply the existence of many
symmetries, i.e. large automorphism group G. In some important special situation higher degree of
regularity means that G is an automorphism group of finite geometry. For example, a glance through the
list of distance regular graphs of diameter d < 3 reveals the fact that most of them are connected with
classical Lie geometry. Theory of distance regular graphs is an important part of algebraic combinatorics
and its applications such as coding theory, communication networks, and block design. An important tool
for investigation of such graphs is their spectra, which is the set of eigenvalues of adjacency matrix of a
graph. Let G be a finite simple group of Lie type and X be the set homogeneous elements of the associated
geometry.
On algorithmic problems concerning graphs of higher degree of symmetrygraphhoc
Since the ancient determination of the five platonic solids the study of symmetry and regularity has always
been one of the most fascinating aspects of mathematics. One intriguing phenomenon of studies in graph
theory is the fact that quite often arithmetic regularity properties of a graph imply the existence of many
symmetries, i.e. large automorphism group G. In some important special situation higher degree of
regularity means that G is an automorphism group of finite geometry. For example, a glance through the
list of distance regular graphs of diameter d < 3 reveals the fact that most of them are connected with
classical Lie geometry. Theory of distance regular graphs is an important part of algebraic combinatorics
and its applications such as coding theory, communication networks, and block design. An important tool
for investigation of such graphs is their spectra, which is the set of eigenvalues of adjacency matrix of a
graph. Let G be a finite simple group of Lie type and X be the set homogeneous elements of the associated
geometry. The complexity of computing the adjacency matrices of a graph Gr on the vertices X such that
Aut GR = G depends very much on the description of the geometry with which one starts. For example, we
can represent the geometry as the totality of 1 cosets of parabolic subgroups 2 chains of embedded
subspaces (case of linear groups), or totally isotropic subspaces (case of the remaining classical groups), 3
special subspaces of minimal module for G which are defined in terms of a G invariant multilinear form.
The aim of this research is to develop an effective method for generation of graphs connected with classical
geometry and evaluation of its spectra, which is the set of eigenvalues of adjacency matrix of a graph. The
main approach is to avoid manual drawing and to calculate graph layout automatically according to its
formal structure. This is a simple task in a case of a tree like graph with a strict hierarchy of entities but it
becomes more complicated for graphs of geometrical nature. There are two main reasons for the
investigations of spectra: (1) very often spectra carry much more useful information about the graph than a
corresponding list of entities and relationships (2) graphs with special spectra, satisfying so called
Ramanujan property or simply Ramanujan graphs (by name of Indian genius mathematician) are important
for real life applications (see [13]). There is a motivated suspicion that among geometrical graphs one
could find some new Ramanujan graphs.
Vector integration involves integrating a vector field along a curve or path, with the result being a vector quantity. It is similar to scalar integration but deals with vector-valued functions instead of scalar functions. Line integrals calculate the total of a scalar or vector field along a curve and are used in physics and engineering to model quantities depending on the path taken. There are two main types: scalar line integrals and vector line integrals.
RESOLVING CYCLIC AMBIGUITIES AND INCREASING ACCURACY AND RESOLUTION IN DOA ES...csandit
A method to resolve cyclic ambiguities and increase the accuracy and the resolution in the
direction-of-arrival (DOA) estimation using the Estimation of Signal Parameters via Rotational
Invariance Technique (ESPRIT)algorithm is proposed. It is based on rotating the array and
sampling the received signal at multiple positions. Using this approach, the gain in accuracy
and resolution is addressed as function of the mean and variance of the DOA. Simulations
results are provided as a means of verifying this analysis.
Image and Audio Signal Filtration with Discrete Heap Transformsmathsjournal
Filtration and enhancement of signals and images by the discrete signal-induced heap transform (DsiHT) is described in this paper. The basic functions of the DsiHT are orthogonal waves that are originated from the signal generating the transform. These waves with their specific motion describe a process of elementary rotations or Givens transformations of the processed signal. Unlike the discrete Fourier transform which performs rotations of all data of the signalon each stage of calculation, the DsiHT sequentially rotates only two components of the data and accumulates a heap in one of the components with the maximum energy. Because of the nature of the heap transform, if the signal under process is mixed with a wave which is similar to the signal-generator then this additive component is eliminated or vanished after applying the heap transformation. This property can effectively be used for noise removal, noise detection, and image enhancement.
Digital Signal Processing (DSP) from basics introduction to medium level book based on Anna University Syllabus! This is just a share of worthfull book!
-Prabhaharan Ellaiyan
-prabhaharan429@gmail.com
-www.insmartworld.blogspot.in
This document summarizes several papers on principal component analysis (PCA) with network/graph constraints. It discusses graph-Laplacian PCA (gLPCA) which adds a graph smoothness regularization term to standard PCA. It also covers robust graph-Laplacian PCA (RgLPCA) which uses an L2,1 norm and iterative algorithms. Further, it summarizes robust PCA on graphs which learns the product of principal directions and components while assuming smoothness on this product. Finally, it discusses manifold regularized matrix factorization (MMF) which imposes orthonormal constraints on principal directions.
Graph terminology and algorithm and tree.pptxasimshahzad8611
This document provides an overview of key concepts in graph theory including graph terminology, representations, traversals, spanning trees, minimum spanning trees, and shortest path algorithms. It defines graphs, directed vs undirected graphs, connectedness, degrees, adjacency, paths, cycles, trees, and graph representations using adjacency matrices and lists. It also describes breadth-first and depth-first traversals, spanning trees, minimum spanning trees, and algorithms for finding minimum spanning trees and shortest paths like Kruskal's, Prim's, Dijkstra's, Bellman-Ford and A* algorithms.
The document discusses methods for performing spatial statistics on large datasets. Standard maximum likelihood estimation is computationally infeasible for datasets with tens of thousands of observations due to the need to compute and store large covariance matrices. The document outlines several approximation methods that can accommodate large datasets, including variogram fitting, pairwise likelihood approximations, independent block approximations, tapering of the covariance function, low-rank approximations using basis functions, and approximations based on stochastic partial differential equations. These methods allow inference for large spatial datasets by avoiding direct computation and storage of large covariance matrices.
The document discusses blind source separation techniques including Independent Component Analysis (ICA) and Signal Fraction Analysis (SFA). ICA separates mixed signals using the assumptions that the source signals are non-Gaussian and independent. SFA separates signals and noise by maximizing the signal-to-noise ratio. Both techniques are evaluated using metrics like normalized mean square error and correlation to assess performance.
A generalized class of normalized distance functions called Q-Metrics is described in this presentation. The Q-Metrics approach relies on a unique functional, using a single bounded parameter (Lambda), which characterizes the conventional distance functions in a normalized per-unit metric space. In addition to this coverage property, a distinguishing and extremely attractive characteristic of the Q-Metric function is its low computational complexity. Q-Metrics satisfy the standard metric axioms. Novel networks for classification and regression tasks are defined and constructed using Q-Metrics. These new networks are shown to outperform conventional feed forward back propagation networks with the same size when tested on real data sets.
A generalized class of normalized distance functions called Q-Metrics is described in this presentation. The Q-Metrics approach relies on a unique functional, using a single bounded parameter Lambda, which characterizes the conventional distance functions in a normalized per-unit metric space. In addition to this coverage property, a distinguishing and extremely attractive characteristic of the Q-Metric function is its low computational complexity. Q-Metrics satisfy the standard metric axioms. Novel networks for classification and regression tasks are defined and constructed using Q-Metrics. These new networks are shown to outperform conventional feed forward back propagation networks with the same size when tested on real data sets.
A graph is a pair (V, E) where V is a set of vertices and E is a set of edges connecting the vertices. Graphs can be represented using an adjacency matrix, where a matrix element A[i,j] indicates if there is an edge from vertex i to j, or using adjacency lists, where each vertex stores a list of its neighboring vertices. Graphs find applications in modeling networks, databases, and more. Common graph operations include finding paths and connectivity between vertices.
The Power of Graphs in Immersive Communicationstonizza82
This document discusses graph signal processing and its applications in immersive communications. It begins with an introduction to graphs and how they can represent network-structured data. It then discusses how machine learning can be applied to graph-structured data through tasks like graph classification, node classification, and graph clustering. The document outlines challenges with 360-degree video streaming like delivering large volumes of data under low-delay constraints. It proposes that graph signal processing approaches may help address these challenges by accounting for both the data and relationships in the network.
This document discusses using the Wasserstein distance for inference in generative models. It begins with an overview of approximate Bayesian computation (ABC) and how distances between samples are used. It then introduces the Wasserstein distance as an alternative distance that can have lower variance than the Euclidean distance. Computational aspects and asymptotics of using the Wasserstein distance are discussed. The document also covers how transport distances can handle time series data.
Similar to Big Data Analysis with Signal Processing on Graphs (20)
Sequential Probability Ratio Test for Sparse SignalsMohamed Seif
- The document discusses using a sequential probability ratio test (SPRT) for sparse signal detection from compressed measurements. SPRT allows observations to continue until sufficient evidence is accumulated to decide between two hypotheses.
- It outlines how to apply SPRT to the problem by deriving the likelihood ratio test statistic and decision thresholds based on desired false alarm and detection probabilities. Performance is characterized by bounding the probability of error based on properties of compressed sensing measurements.
- Simulation results show decreasing decision time with higher compression ratios and numbers of observations, consistent with theoretical predictions. Future work includes refining the analysis and extending it to random sparse signals.
This document summarizes Mohamed Seif's work on stopping problems. It introduces stopping problems, which involve choosing when to stop collecting information and make a decision. It then provides preliminaries on hypothesis testing. The main focus is on the sequential probability ratio test, which sequentially updates probabilities based on likelihood ratios of observations. Thresholds are used to determine when to stop observing and make a decision. The sequential probability ratio test is applied to the problem of compressive spectrum sensing in wireless networks.
Interference Management for Multi-hop NetworksMohamed Seif
The document summarizes research on interference management techniques for multi-hop networks. It describes a two-user two-hop network model and discusses degrees of freedom (DoF) as a way to characterize the network capacity at high signal-to-noise ratios. An aligned interference neutralization scheme is presented that achieves the maximum DoF of 2 for this network using signal alignment across multiple channel extensions. Variations of this scheme for untrusted relays, confidential messages, and imperfect channel state information are also summarized.
This document presents a scheme called interference creation-resurrection (ICR) for the K-user MISO broadcast channel with alternating channel state information at the transmitter (CSIT). The ICR scheme achieves degrees of freedom (DoF) gains over other alternating CSIT models. It works in two phases: 1) interference creation phase where artificial interference is generated, and 2) interference resurrection phase where the artificial interference is reconstructed as useful signals. The scheme achieves the entire DoF region for certain channel configurations with 3 users. Results show the ICR scheme outperforms other alternating CSIT schemes in terms of DoF for the K-user broadcast channel.
Stability Analysis in a Cognitive Radio System with Cooperative BeamformingMohamed Seif
The document analyzes the stability of a cognitive radio system with cooperative beamforming. It presents a system model involving primary and secondary users and relay nodes. It analyzes the queue service rates for both users under different conditions. To study stability, it uses the concept of dominant systems where transmitters send dummy packets if queues are empty. It derives the stability regions for two dominant systems and says the original system's stability region is the union of these. Numerical results show the optimal secondary transmit power versus arrival rate for the first dominant system.
Stability Analysis in a Cognitive Radio System with Cooperative BeamformingMohamed Seif
The document analyzes the stability of a cognitive radio system with cooperative beamforming between a secondary user (SU) network and two primary users (PUs). It first presents the network model and describes how the SUs sense PU activity and perform beamforming. It then analyzes the queue service rates for PUs and SUs under different conditions. The stability region, defined as the set of arrival rates keeping all queues stable, is determined using Loynes' theorem and by modeling the interacting queues as a dominant system where users transmit dummy packets if their queue is empty.
Optimal Relay Selection and Beamforming in MIMO Cognitive Multi-Relay NetworksMohamed Seif
This document proposes an optimal relay selection and beamforming scheme for MIMO cognitive multi-relay networks. The problem is formulated as selecting the optimal relay and designing the beamforming matrix to maximize the secondary user's signal-to-noise ratio under transmit power constraints at the relays and interference power constraints at the primary users. Simulation results show that the average capacity increases with the maximum transmit power at relays and the number of relays and antennas.
This document discusses various MIMO techniques including single-user and multi-user MIMO. It begins with an overview of STBC, which is used in 802.11ac and provides transmit diversity with low cost. Spatial multiplexing allows multiple parallel channels to improve throughput. For single-user MIMO, transmit beamforming enhances signal reception through precoding techniques like SVD that establish parallel channels. Multi-user MIMO further increases capacity but introduces interference that must be managed through precoding and receiver techniques like zero-forcing. Channel feedback is also required to implement beamforming and precoding.
Short survey for Channel estimation using OFDM systemsMohamed Seif
This document discusses channel estimation techniques for OFDM systems. It begins by introducing OFDM and the need for channel state information at the receiver. It then describes two common pilot arrangements - block and comb type. For block pilots, it examines least squares and minimum mean square error channel estimation. It finds MMSE performs better but with higher complexity. For comb pilots, it presents least squares and LMS estimation as well as interpolation techniques between pilot tones. The document also evaluates channel estimation for MIMO-OFDM and the effects of user mobility.
This document describes a binary consensus algorithm for cooperative spectrum sensing in cognitive radio networks. The algorithm uses a fully connected graph model where secondary users cooperatively sense for the presence or absence of a primary user and reach a global decision. Each secondary user makes an initial local binary decision and then iteratively updates its decision by taking the average of its own decision and the decisions received from neighboring nodes. The algorithm is analyzed using a Markov chain representation and the convergence time is related to the second largest eigenvalue of the transition matrix. Simulation results show that the algorithm can accurately detect the presence or absence of a primary user as the number of iterations increases.
6th International Conference on Machine Learning & Applications (CMLA 2024)ClaraZara1
6th International Conference on Machine Learning & Applications (CMLA 2024) will provide an excellent international forum for sharing knowledge and results in theory, methodology and applications of on Machine Learning & Applications.
International Conference on NLP, Artificial Intelligence, Machine Learning an...gerogepatton
International Conference on NLP, Artificial Intelligence, Machine Learning and Applications (NLAIM 2024) offers a premier global platform for exchanging insights and findings in the theory, methodology, and applications of NLP, Artificial Intelligence, Machine Learning, and their applications. The conference seeks substantial contributions across all key domains of NLP, Artificial Intelligence, Machine Learning, and their practical applications, aiming to foster both theoretical advancements and real-world implementations. With a focus on facilitating collaboration between researchers and practitioners from academia and industry, the conference serves as a nexus for sharing the latest developments in the field.
Embedded machine learning-based road conditions and driving behavior monitoringIJECEIAES
Car accident rates have increased in recent years, resulting in losses in human lives, properties, and other financial costs. An embedded machine learning-based system is developed to address this critical issue. The system can monitor road conditions, detect driving patterns, and identify aggressive driving behaviors. The system is based on neural networks trained on a comprehensive dataset of driving events, driving styles, and road conditions. The system effectively detects potential risks and helps mitigate the frequency and impact of accidents. The primary goal is to ensure the safety of drivers and vehicles. Collecting data involved gathering information on three key road events: normal street and normal drive, speed bumps, circular yellow speed bumps, and three aggressive driving actions: sudden start, sudden stop, and sudden entry. The gathered data is processed and analyzed using a machine learning system designed for limited power and memory devices. The developed system resulted in 91.9% accuracy, 93.6% precision, and 92% recall. The achieved inference time on an Arduino Nano 33 BLE Sense with a 32-bit CPU running at 64 MHz is 34 ms and requires 2.6 kB peak RAM and 139.9 kB program flash memory, making it suitable for resource-constrained embedded systems.
Low power architecture of logic gates using adiabatic techniquesnooriasukmaningtyas
The growing significance of portable systems to limit power consumption in ultra-large-scale-integration chips of very high density, has recently led to rapid and inventive progresses in low-power design. The most effective technique is adiabatic logic circuit design in energy-efficient hardware. This paper presents two adiabatic approaches for the design of low power circuits, modified positive feedback adiabatic logic (modified PFAL) and the other is direct current diode based positive feedback adiabatic logic (DC-DB PFAL). Logic gates are the preliminary components in any digital circuit design. By improving the performance of basic gates, one can improvise the whole system performance. In this paper proposed circuit design of the low power architecture of OR/NOR, AND/NAND, and XOR/XNOR gates are presented using the said approaches and their results are analyzed for powerdissipation, delay, power-delay-product and rise time and compared with the other adiabatic techniques along with the conventional complementary metal oxide semiconductor (CMOS) designs reported in the literature. It has been found that the designs with DC-DB PFAL technique outperform with the percentage improvement of 65% for NOR gate and 7% for NAND gate and 34% for XNOR gate over the modified PFAL techniques at 10 MHz respectively.
Using recycled concrete aggregates (RCA) for pavements is crucial to achieving sustainability. Implementing RCA for new pavement can minimize carbon footprint, conserve natural resources, reduce harmful emissions, and lower life cycle costs. Compared to natural aggregate (NA), RCA pavement has fewer comprehensive studies and sustainability assessments.
Harnessing WebAssembly for Real-time Stateless Streaming PipelinesChristina Lin
Traditionally, dealing with real-time data pipelines has involved significant overhead, even for straightforward tasks like data transformation or masking. However, in this talk, we’ll venture into the dynamic realm of WebAssembly (WASM) and discover how it can revolutionize the creation of stateless streaming pipelines within a Kafka (Redpanda) broker. These pipelines are adept at managing low-latency, high-data-volume scenarios.
Harnessing WebAssembly for Real-time Stateless Streaming Pipelines
Big Data Analysis with Signal Processing on Graphs
1. Big Data Talks Nile University
Talk 8
Big Data Analysis with Signal Processing on
Graphs
Introduction
Fundamentals of Graph Theory
DSP on Graphs
Graph Products
Applications
Mohamed Seif m.seif@nu.edu.eg 8-1
6. What Is Graph?
In graph theory, the graph G is defined as a tuple G = (V, E) where
V = {v0, v1, . . . , vN−1} is the set of N nodes and
E = {eij, ∀(i, j) ∈ {0, 1, . . . , N − 1}} is the set containing all links
between the nodes.
Example:
V = {1, 2, 3, 4}
E = {{1, 2}, {2, 3}, {3, 4}, {4, 1}}
1 2
3 4
Big Data Analysis with Signal Processing on Graphs 8-6
7. What Is Graph?
In graph theory, the graph G is defined as a tuple G = (V, E) where
V = {v0, v1, . . . , vN−1} is the set of N nodes and
E = {eij, ∀(i, j) ∈ {0, 1, . . . , N − 1}} is the set containing all links
between the nodes.
Example:
V = {1, 2, 3, 4}
E = {{1, 2}, {2, 3}, {3, 4}, {4, 1}}
1 2
3 4
Big Data Analysis with Signal Processing on Graphs 8-7
8. What Is Graph? (cont’d)
In graph theory, the graph G is defined as a tuple G = (V, E) where
V = {v0, v1, . . . , vN−1} is the set of N nodes and
E = {eij, ∀(i, j) ∈ {0, 1, . . . , N − 1}} is the set containing all links
between the nodes.
Big Data Analysis with Signal Processing on Graphs 8-8
9. What Is Graph?
In graph theory, the graph G is defined as a tuple G = (V, E) where
V = {v0, v1, . . . , vN−1} is the set of N nodes and
E = {eij, ∀(i, j) ∈ {0, 1, . . . , N − 1}} is the set containing all links
between the nodes.
Big Data Analysis with Signal Processing on Graphs 8-9
10. Alternative Representation of Graphs
1. Adjacency matrix AN×N , defined as
Ai,j =
1 if vi & vj are connected
0 o.w.
2. Laplacian graph LN×N , defined as
L = D − A, where D is the degree matrix
Li,j =
deg(vi) if i = j
−1 if i = j & vi is adjacent to vj
0 o.w.
Big Data Analysis with Signal Processing on Graphs 8-10
12. Graph Signals
Given the graph, the data set forms a graph signal, defined as a map
s : V → C, vn → sn (1)
It is convenient to write graph signals as vectors
s = [s0, s1, . . . , sN−1]
T
∈ CN×1
(2)
Big Data Analysis with Signal Processing on Graphs 8-12
13. Graph Shift
In DSP, a signal shift, implemented as a time delay
˜s = [ ˜s0, ˜s1, . . . , ˜sN−1]
T
= Cs (3)
where C is the N × N cyclic shift matrix.
DSP on Graphs extends the concept of shift to general graphs by
defining the graph shift as a local operation that replaces a signal value
sn at node vn by a linear combination of the values at neighbors of vn
weighted by their edge weights:
˜sn =
m∈Nn
An,msm (4)
Big Data Analysis with Signal Processing on Graphs 8-13
14. Graph Shift (cont’d)
It can be interpreted as a first-order interpolation, weighted
averaging, or regression on graphs, which is a widely used operation
in graph regression, distributed consensus, telecommunications.
Then, the graph shift is written as
˜s = [ ˜s0, ˜s1, . . . , ˜sN−1]
T
= As (5)
Big Data Analysis with Signal Processing on Graphs 8-14
15. Graph Filters and Z-Transform
In signal processing, a filter is a system H(.) that takes an input
signal s and outputs a signal:
˜s = [ ˜s0, ˜s1, . . . , ˜sN−1]
T
= H(s) (6)
Among the most widely used filters are linear shift-ivariant (LSI) ones.
The z-transform provides a convenient representation for signals and
filters in DSP. (In short)
An alternative representation for the output signal is given by
˜s = h(C)s (7)
where h(c) =
N−1
n=0 hnCn
(Resultant is a circulant matrix)
Big Data Analysis with Signal Processing on Graphs 8-15
16. Graph Filters and Z-Transform
In signal processing, a filter is a system H(.) that takes an input
signal s and outputs a signal:
˜s = [ ˜s0, ˜s1, . . . , ˜sN−1]
T
= H(s) (6)
Among the most widely used filters are linear shift-ivariant (LSI) ones.
The z-transform provides a convenient representation for signals and
filters in DSP. (In short)
An alternative representation for the output signal is given by
˜s = h(C)s (7)
where h(c) =
N−1
n=0 hnCn
(Resultant is a circulant matrix)
Big Data Analysis with Signal Processing on Graphs 8-16
17. Graph Filters and Z-Transform
In signal processing, a filter is a system H(.) that takes an input
signal s and outputs a signal:
˜s = [ ˜s0, ˜s1, . . . , ˜sN−1]
T
= H(s) (6)
Among the most widely used filters are linear shift-ivariant (LSI) ones.
The z-transform provides a convenient representation for signals and
filters in DSP. (In short)
An alternative representation for the output signal is given by
˜s = h(C)s (7)
where h(c) =
N−1
n=0 hnCn
(Resultant is a circulant matrix)
Big Data Analysis with Signal Processing on Graphs 8-17
18. Graph Filters and Z-Transform
In signal processing, a filter is a system H(.) that takes an input
signal s and outputs a signal:
˜s = [ ˜s0, ˜s1, . . . , ˜sN−1]
T
= H(s) (6)
Among the most widely used filters are linear shift-ivariant (LSI) ones.
The z-transform provides a convenient representation for signals and
filters in DSP. (In short)
An alternative representation for the output signal is given by
˜s = h(C)s (7)
where h(c) =
N−1
n=0 hnCn
(Resultant is a circulant matrix)
Big Data Analysis with Signal Processing on Graphs 8-18
19. Graph Filters and Z-Transform (cont’d)
DSP on Graphs extends the concept of filters to general graphs.
Similarly to the extension of the time shift to the graph shift, filters
are generalized to graph filters as polynomials in the graph shift , and
all LSI graph filters have the form
h(A) =
L−1
l=0
hlAl
(8)
In analogy with signal filters, the graph filter output is given by
˜s = h(A)s (9)
Big Data Analysis with Signal Processing on Graphs 8-19
20. Graph Fourier Transform
Mathematically, a Fourier transform with respect to a set of operators
is the expansion of a signal into a basis of the operators eigen
functions.
Since in signal processing the operators of interest are filters, DSPG
defines the Fourier transform with respect to the graph filters.
˜s = [ ˜s0, ˜s1, . . . , ˜sN−1]
T
= GFT{s} (10)
Big Data Analysis with Signal Processing on Graphs 8-20
21. Graph Fourier Transform
Mathematically, a Fourier transform with respect to a set of operators
is the expansion of a signal into a basis of the operators eigen
functions.
Since in signal processing the operators of interest are filters, DSPG
defines the Fourier transform with respect to the graph filters.
˜s = [ ˜s0, ˜s1, . . . , ˜sN−1]
T
= GFT{s} (10)
Big Data Analysis with Signal Processing on Graphs 8-21
22. Graph Fourier Transform (cont’d)
For simplicity, assume that A is diagonalizable and its decomposition
is
A = V ΛV −1
(11)
where the columns vn of the matrix V = [v0 · · · vN−1] ∈ CN×N
are the eigenvectors of A and Λ = diag(λ0, . . . , λN−1) are
eigenvalues of A
In general A can be diagonalized using Jordan decomposition.
Big Data Analysis with Signal Processing on Graphs 8-22
23. Graph Fourier Transform (cont’d)
For simplicity, assume that A is diagonalizable and its decomposition
is
A = V ΛV −1
(11)
where the columns vn of the matrix V = [v0 · · · vN−1] ∈ CN×N
are the eigenvectors of A and Λ = diag(λ0, . . . , λN−1) are
eigenvalues of A
In general A can be diagonalized using Jordan decomposition.
Big Data Analysis with Signal Processing on Graphs 8-23
24. Graph Fourier Transform (cont’d)
The eigenfunctions of graph filters h(A) are given by the eigenvectors
of the graph shift matrix A
Since the expansion into the eigenbasis is given by the multiplication
with the inverse eigenvector matrix, which always exists, the graph
Fourier transform is well defined and computed as
ˆs = [ ˆs0, ˆs1, . . . , ˆsN−1]
T
= V −1
s (12)
= Fs (13)
where F = V −1
is the graph Fourier transform matrix.
Big Data Analysis with Signal Processing on Graphs 8-24
25. Graph Fourier Transform (cont’d)
The eigenfunctions of graph filters h(A) are given by the eigenvectors
of the graph shift matrix A
Since the expansion into the eigenbasis is given by the multiplication
with the inverse eigenvector matrix, which always exists, the graph
Fourier transform is well defined and computed as
ˆs = [ ˆs0, ˆs1, . . . , ˆsN−1]
T
= V −1
s (12)
= Fs (13)
where F = V −1
is the graph Fourier transform matrix.
Big Data Analysis with Signal Processing on Graphs 8-25
26. Graph Fourier Transform (cont’d)
The eigenfunctions of graph filters h(A) are given by the eigenvectors
of the graph shift matrix A
Since the expansion into the eigenbasis is given by the multiplication
with the inverse eigenvector matrix, which always exists, the graph
Fourier transform is well defined and computed as
ˆs = [ ˆs0, ˆs1, . . . , ˆsN−1]
T
= V −1
s (12)
= Fs (13)
where F = V −1
is the graph Fourier transform matrix.
Big Data Analysis with Signal Processing on Graphs 8-26
27. Graph Fourier Transform (cont’d)
The inverse graph Fourier transform reconstructs the graph signal
from is frequency content by combining graph frequency components
weighted by the coefficients of the signal’s graph Fourier transform:
s = ˆs0v0 + ˆs1v1 + · · · + ˆsN−1vN−1 (14)
= F−1
s = V s (15)
Big Data Analysis with Signal Processing on Graphs 8-27
28. Low and High Frequencies on Graphs
The values ˆsn in (12) are the signal’s expansion in the eigenvector
basis and represent the frequency content of the signal s.
The eigenvalues λn of the shift matrix A represent graph frequency
content, and the eigenvectors vn represent the corresponding graph
frequency component.
To conclude, the higher λn, the higher frequency content and vice
versa.
Big Data Analysis with Signal Processing on Graphs 8-28
29. Low and High Frequencies on Graphs
The values ˆsn in (12) are the signal’s expansion in the eigenvector
basis and represent the frequency content of the signal s.
The eigenvalues λn of the shift matrix A represent graph frequency
content, and the eigenvectors vn represent the corresponding graph
frequency component.
To conclude, the higher λn, the higher frequency content and vice
versa.
Big Data Analysis with Signal Processing on Graphs 8-29
30. Low and High Frequencies on Graphs
The values ˆsn in (12) are the signal’s expansion in the eigenvector
basis and represent the frequency content of the signal s.
The eigenvalues λn of the shift matrix A represent graph frequency
content, and the eigenvectors vn represent the corresponding graph
frequency component.
To conclude, the higher λn, the higher frequency content and vice
versa.
Big Data Analysis with Signal Processing on Graphs 8-30
31. Low and High Frequencies on Graphs
The values ˆsn in (12) are the signal’s expansion in the eigenvector
basis and represent the frequency content of the signal s.
The eigenvalues λn of the shift matrix A represent graph frequency
content, and the eigenvectors vn represent the corresponding graph
frequency component.
To conclude, the higher λn, the higher frequency content and vice
versa.
Big Data Analysis with Signal Processing on Graphs 8-31
32. Frequency Response of Graph Filters
In addition to expressing the frequency content of graph signals, the
graph Fourier transform also characterizes the effect of filters on the
frequency content of signals.
The filtering operation ˜s = h(A)s can be written using
h(A) =
L−1
l=0 hlAl
and ˆs = V −1
s as follows
˜s = h(A)s = h(F−1
AF)s = F−1
h(Λ)Fs (16)
where h(Λ) is a diagonal matrix with values h(λn) =
L−1
l=0 hlλl
n
As a result,
˜s = h(A)s ⇔ Fs = h(Λ)s (17)
Big Data Analysis with Signal Processing on Graphs 8-32
33. Frequency Response of Graph Filters
In addition to expressing the frequency content of graph signals, the
graph Fourier transform also characterizes the effect of filters on the
frequency content of signals.
The filtering operation ˜s = h(A)s can be written using
h(A) =
L−1
l=0 hlAl
and ˆs = V −1
s as follows
˜s = h(A)s = h(F−1
AF)s = F−1
h(Λ)Fs (16)
where h(Λ) is a diagonal matrix with values h(λn) =
L−1
l=0 hlλl
n
As a result,
˜s = h(A)s ⇔ Fs = h(Λ)s (17)
Big Data Analysis with Signal Processing on Graphs 8-33
34. Frequency Response of Graph Filters
In addition to expressing the frequency content of graph signals, the
graph Fourier transform also characterizes the effect of filters on the
frequency content of signals.
The filtering operation ˜s = h(A)s can be written using
h(A) =
L−1
l=0 hlAl
and ˆs = V −1
s as follows
˜s = h(A)s = h(F−1
AF)s = F−1
h(Λ)Fs (16)
where h(Λ) is a diagonal matrix with values h(λn) =
L−1
l=0 hlλl
n
As a result,
˜s = h(A)s ⇔ Fs = h(Λ)s (17)
Big Data Analysis with Signal Processing on Graphs 8-34
35. Frequency Response of Graph Filters (cont’d)
That is, the frequency content of a filtered signal is modified by
multiplying its frequency content element-wise by h(λn) . These
values represent the graph frequency response of the graph
filter.
The relation is a generalization of the classical convolution theorem
to graphs: filtering a graph signal in the graph domain is equivalent in
the frequency domain to multiplying the signal spectrum by the
frequency response of the graph filter. ˜s = h(A)s ⇔ Fs = h(Λ)s
Big Data Analysis with Signal Processing on Graphs 8-35
36. Frequency Response of Graph Filters (cont’d)
That is, the frequency content of a filtered signal is modified by
multiplying its frequency content element-wise by h(λn) . These
values represent the graph frequency response of the graph
filter.
The relation is a generalization of the classical convolution theorem
to graphs: filtering a graph signal in the graph domain is equivalent in
the frequency domain to multiplying the signal spectrum by the
frequency response of the graph filter. ˜s = h(A)s ⇔ Fs = h(Λ)s
Big Data Analysis with Signal Processing on Graphs 8-36
38. Product Graphs
Consider two graphs G1 = (V1, A1) and G2 = (V2, A2) with |V1| = N1
and |V2| = N2 nodes, respectively. The product graph, denoted by , of
G1 and G2 is the graph
G = G1 G2 = (V, A ) (18)
with |V| = N1N2 and dim(A ) = N1N2 × N1N2.
Big Data Analysis with Signal Processing on Graphs 8-38
39. Common Product Graphs Types
1. Kronecker product
A⊗ = A1 ⊗ A2 (19)
Example:
If we have two matrices B ∈ CM×N
and C ∈ CK×L
, then the
Kronecker product is defined as follows
B ⊗ C =
b1,1C
...
bM,1C
· · ·
...
· · ·
b1,M C
...
bM,M C
∈ CMK×NL
(20)
Big Data Analysis with Signal Processing on Graphs 8-39
40. Common Product Graphs Types
1. Cartesian product
A× = A1 ⊗ IN2
+ IN1
⊗ A2 (21)
2. Strong product
A = A1 ⊗ A2 + A1 ⊗ IN2 + IN1 ⊗ A2 (22)
Big Data Analysis with Signal Processing on Graphs 8-40
41. Examples on Product Graphs
Big Data Analysis with Signal Processing on Graphs 8-41
42. Examples on Product Graphs
Big Data Analysis with Signal Processing on Graphs 8-42
43. Examples on Product Graphs
Big Data Analysis with Signal Processing on Graphs 8-43
44. Notes on Product Graphs
Big Data Analysis with Signal Processing on Graphs 8-44
45. Signal Processing on Product Graphs
The computation of filtering and Fourier transform on graphs and
improve algorithms, data storage, and memory access for large data sets
can modularized thanks to graph products. Such as
Filtering
Computation complexity: O(N2
) =⇒ O(N(N1 + N2))
Fourier transform
Computation complexity: O(N3
) =⇒ O(N3
1 + N3
2 )
Big Data Analysis with Signal Processing on Graphs 8-45
46. Signal Processing on Product Graphs
The computation of filtering and Fourier transform on graphs and
improve algorithms, data storage, and memory access for large data sets
can modularized thanks to graph products. Such as
Filtering
Computation complexity: O(N2
) =⇒ O(N(N1 + N2))
Fourier transform
Computation complexity: O(N3
) =⇒ O(N3
1 + N3
2 )
Big Data Analysis with Signal Processing on Graphs 8-46
47. Signal Processing on Product Graphs
The computation of filtering and Fourier transform on graphs and
improve algorithms, data storage, and memory access for large data sets
can modularized thanks to graph products. Such as
Filtering
Computation complexity: O(N2
) =⇒ O(N(N1 + N2))
Fourier transform
Computation complexity: O(N3
) =⇒ O(N3
1 + N3
2 )
Big Data Analysis with Signal Processing on Graphs 8-47
49. Applications
Like-wise traditional DSP problems:
Data compression
Fourier transform or through wavelet expansions, or adaptive filter design
Detection of corrupted data
High pass filter
Big Data Analysis with Signal Processing on Graphs 8-49
50. Applications
Like-wise traditional DSP problems:
Data compression
Fourier transform or through wavelet expansions, or adaptive filter design
Detection of corrupted data
High pass filter
Big Data Analysis with Signal Processing on Graphs 8-50
51. Applications
Like-wise traditional DSP problems:
Data compression
Fourier transform or through wavelet expansions, or adaptive filter design
Detection of corrupted data
High pass filter
Big Data Analysis with Signal Processing on Graphs 8-51
52. Challenges of Big Data
While there is no single, universally agreed upon set of properties that
define big data.
Some of the commonly mentioned ones are volume, velocity, and
variety of data.
Big Data Analysis with Signal Processing on Graphs 8-52
53. Challenges of Big Data
While there is no single, universally agreed upon set of properties that
define big data.
Some of the commonly mentioned ones are volume, velocity, and
variety of data.
Big Data Analysis with Signal Processing on Graphs 8-53
54. Challenges of Big Data
Some of the commonly mentioned ones are volume, velocity, and
variety of data.
First of all, the sheer volume of data to be processed requires efficient
distributed and scalable storage, access, and processing.
High velocity of new data arrival demands fast algorithms to prevent
bottlenecks and explosion of the data volume and to extract valuable
information from the data and incorporate it into the decision-making
process in real time. (FFT in DSP)
Finally, collected data sets contain information in all varieties and forms,
including numerical, textual, and visual data. To generalize data analysis
techniques to diverse data sets, we need a common representation
framework for data sets and their structure.
Big Data Analysis with Signal Processing on Graphs 8-54
55. Challenges of Big Data
Some of the commonly mentioned ones are volume, velocity, and
variety of data.
First of all, the sheer volume of data to be processed requires efficient
distributed and scalable storage, access, and processing.
High velocity of new data arrival demands fast algorithms to prevent
bottlenecks and explosion of the data volume and to extract valuable
information from the data and incorporate it into the decision-making
process in real time. (FFT in DSP)
Finally, collected data sets contain information in all varieties and forms,
including numerical, textual, and visual data. To generalize data analysis
techniques to diverse data sets, we need a common representation
framework for data sets and their structure.
Big Data Analysis with Signal Processing on Graphs 8-55
56. Challenges of Big Data
Some of the commonly mentioned ones are volume, velocity, and
variety of data.
First of all, the sheer volume of data to be processed requires efficient
distributed and scalable storage, access, and processing.
High velocity of new data arrival demands fast algorithms to prevent
bottlenecks and explosion of the data volume and to extract valuable
information from the data and incorporate it into the decision-making
process in real time. (FFT in DSP)
Finally, collected data sets contain information in all varieties and forms,
including numerical, textual, and visual data. To generalize data analysis
techniques to diverse data sets, we need a common representation
framework for data sets and their structure.
Big Data Analysis with Signal Processing on Graphs 8-56
57. Challenges of Big Data
Some of the commonly mentioned ones are volume, velocity, and
variety of data.
First of all, the sheer volume of data to be processed requires efficient
distributed and scalable storage, access, and processing.
High velocity of new data arrival demands fast algorithms to prevent
bottlenecks and explosion of the data volume and to extract valuable
information from the data and incorporate it into the decision-making
process in real time. (FFT in DSP)
Finally, collected data sets contain information in all varieties and forms,
including numerical, textual, and visual data. To generalize data analysis
techniques to diverse data sets, we need a common representation
framework for data sets and their structure.
Big Data Analysis with Signal Processing on Graphs 8-57