Download to read offline
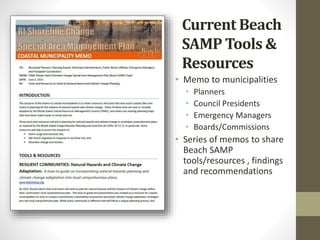
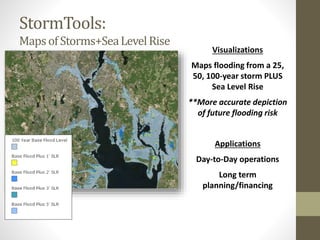
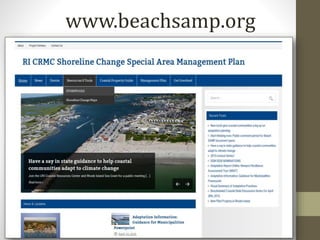
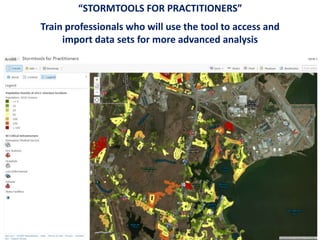
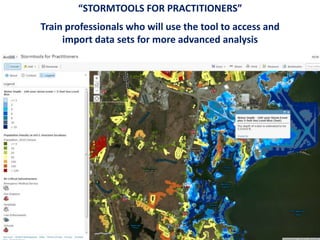
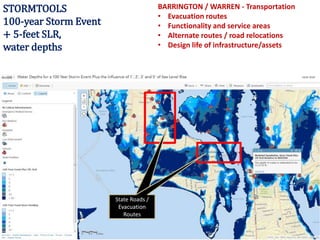
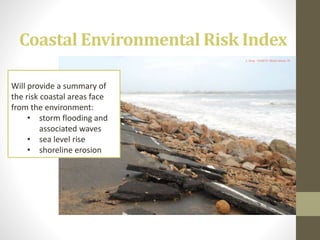
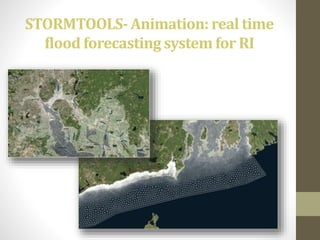
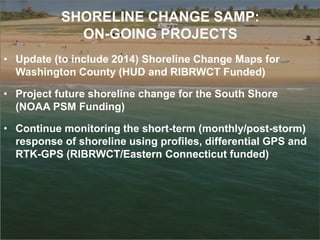
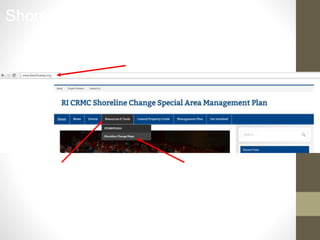
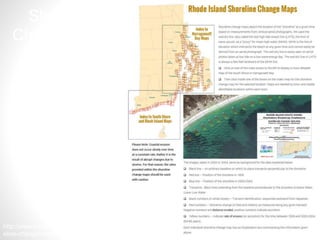
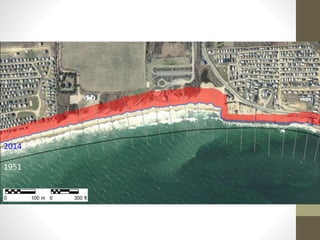
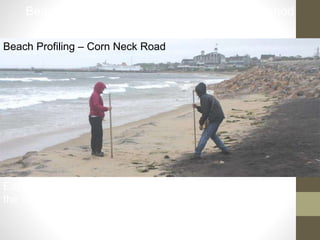

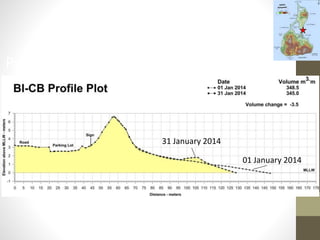
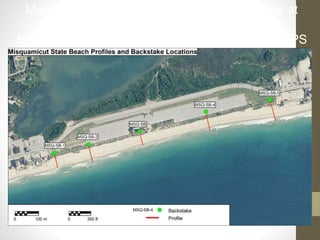
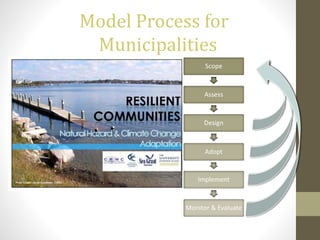
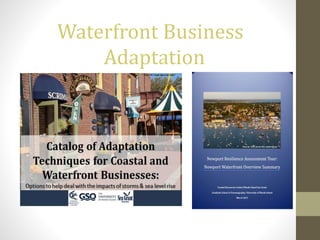


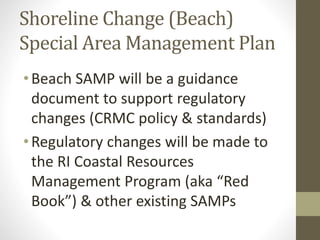
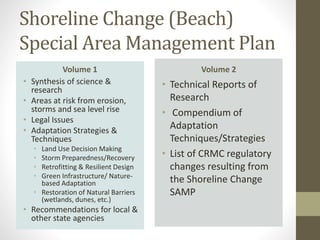
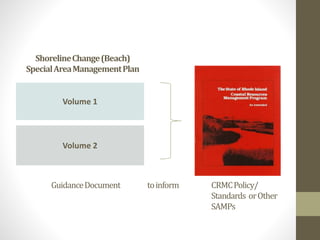
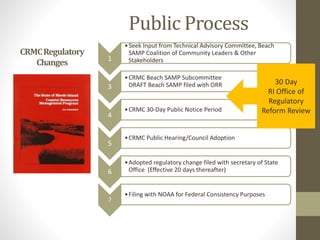
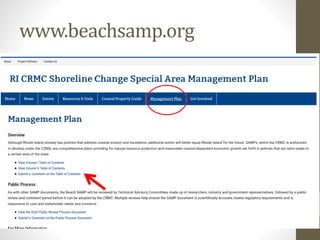
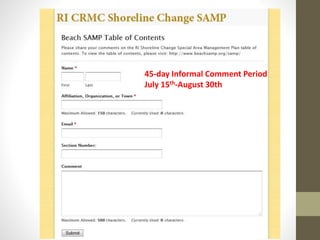


The document outlines the Beach SAMP (Shoreline Change Special Area Management Plan) initiatives aimed at addressing coastal risks due to storms and sea level rise through various tools and resources. It details the use of 'stormtools' for both beginners and practitioners to assess property vulnerability and flooding risk, alongside ongoing shoreline change mapping and monitoring projects in Rhode Island. Additionally, it highlights the adaptation strategies and regulatory changes proposed to enhance coastal resilience and inform local decision-making.


