Download as PDF, PPTX

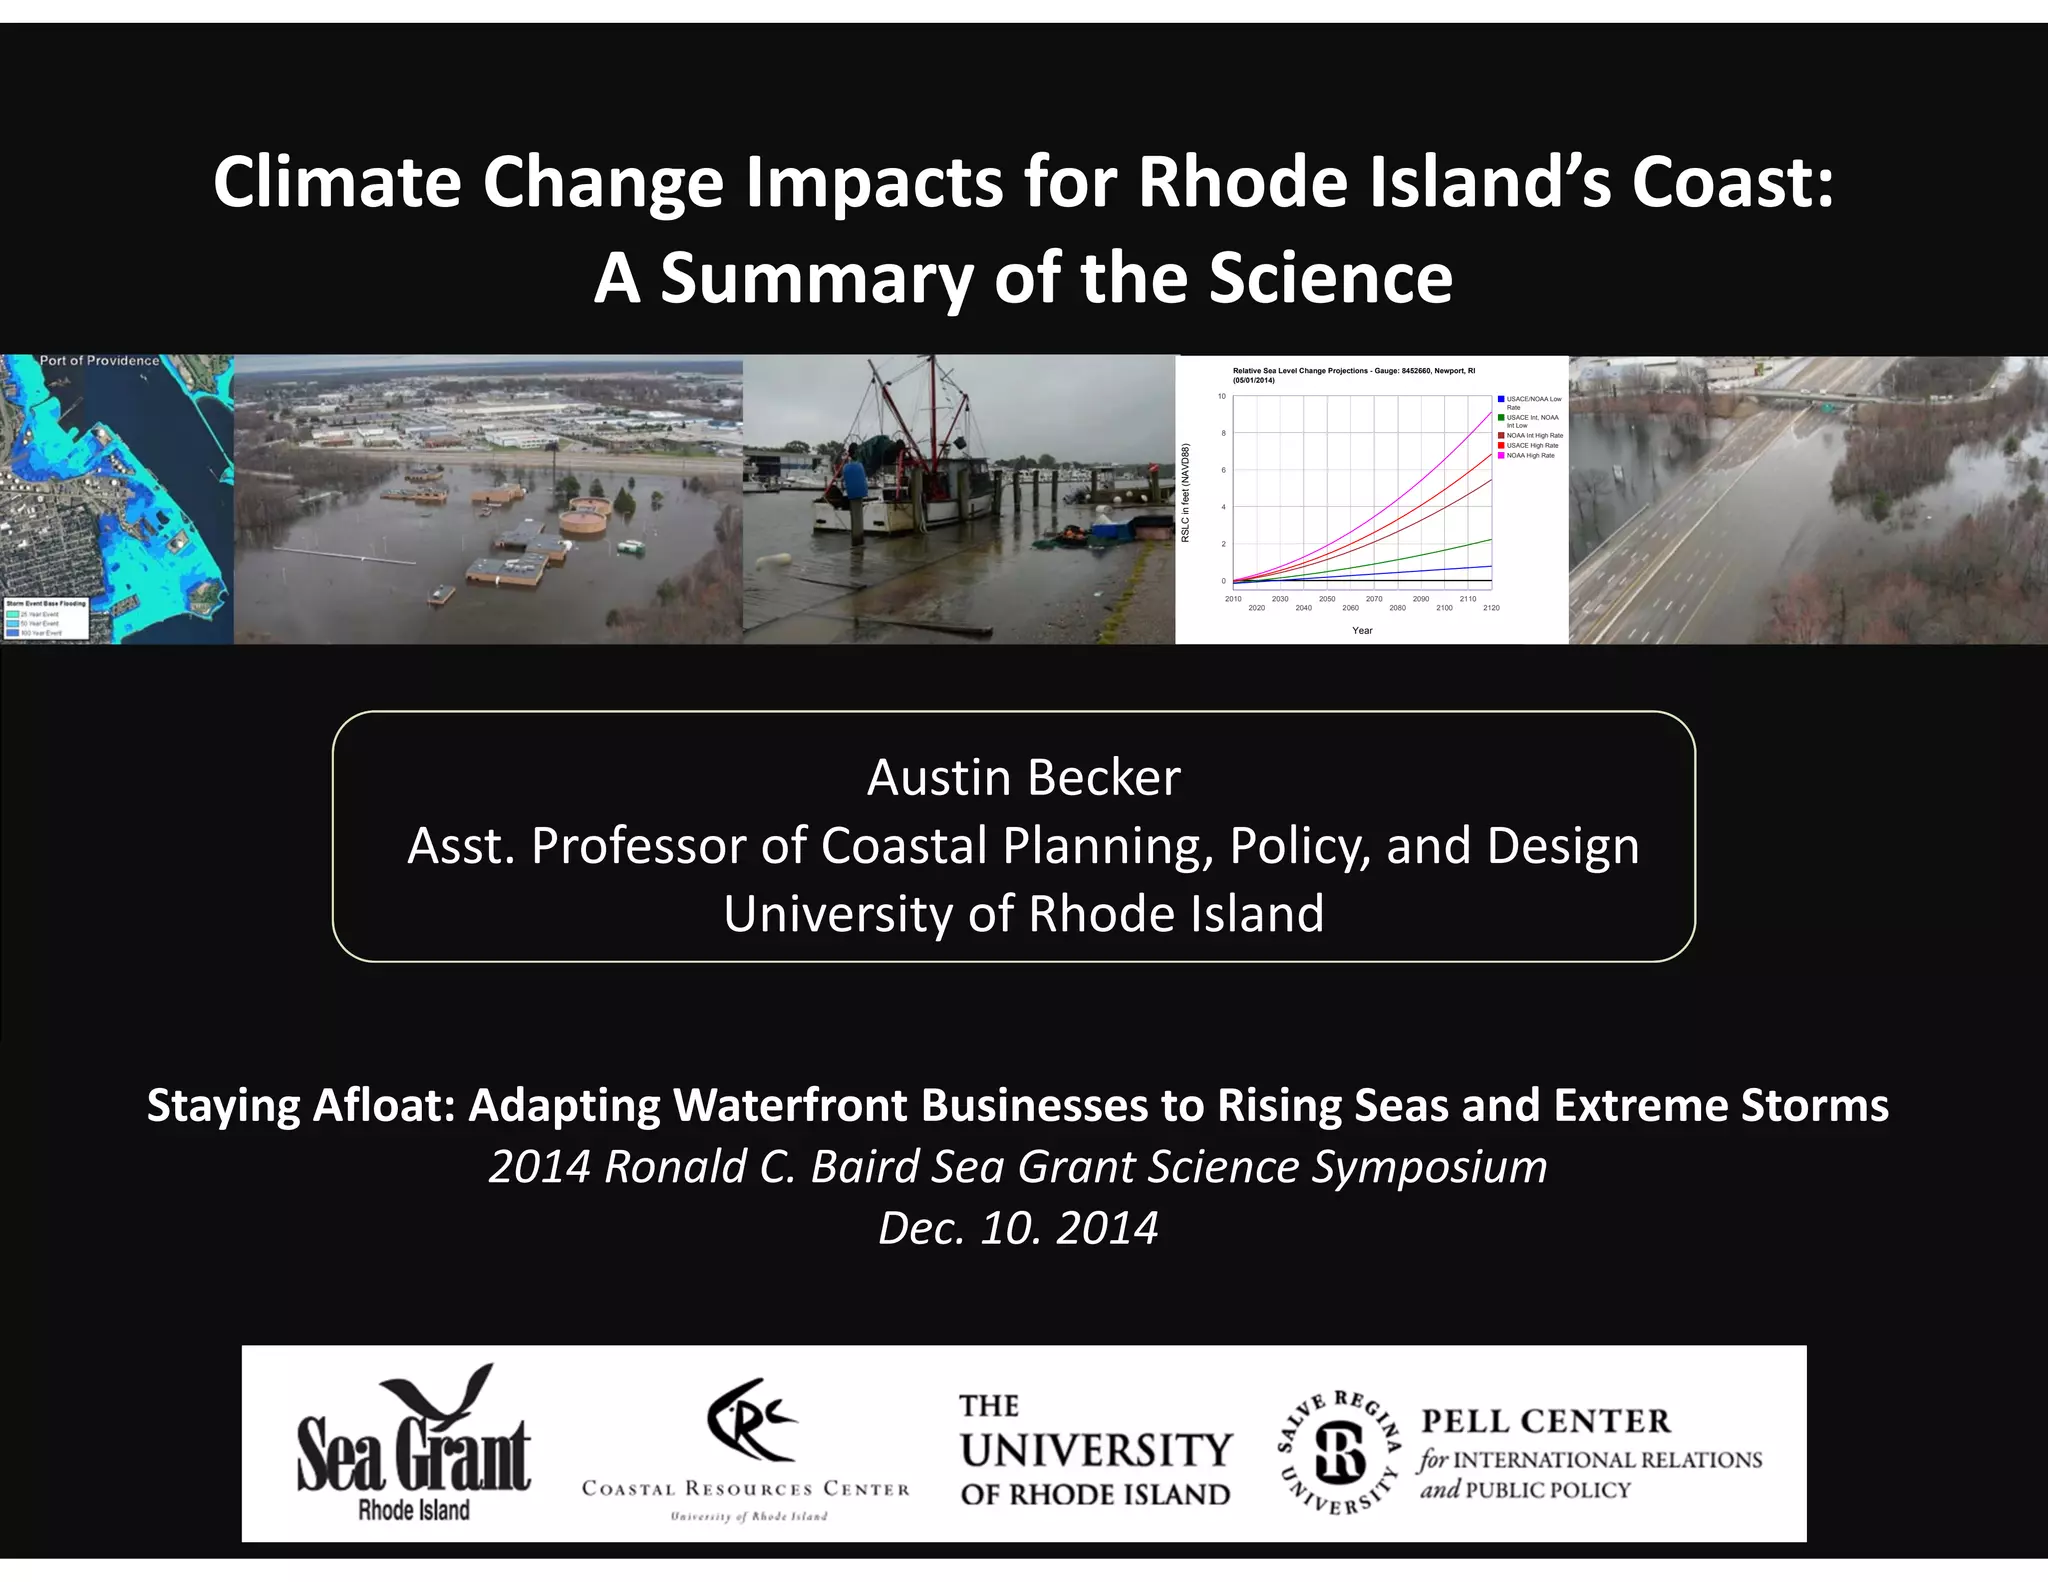

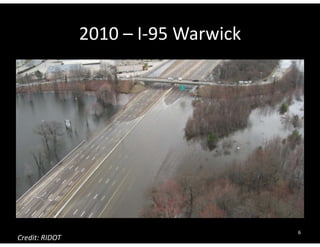
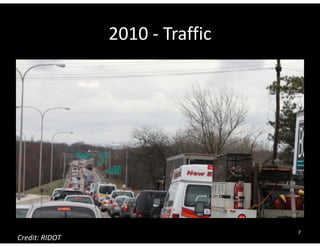
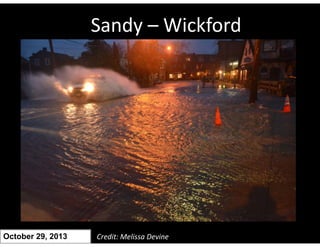
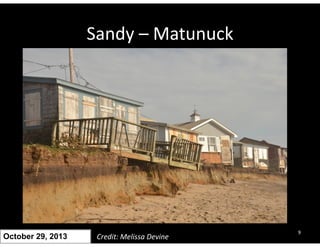
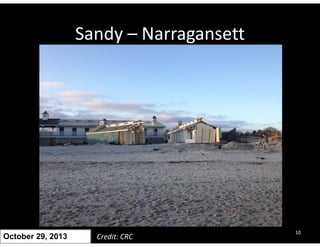
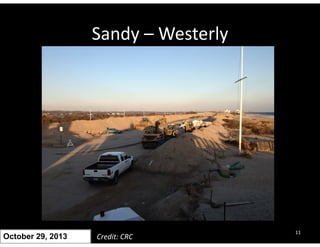
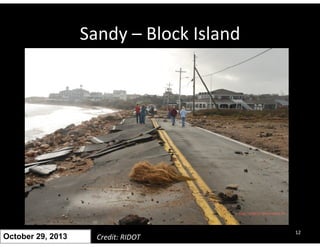
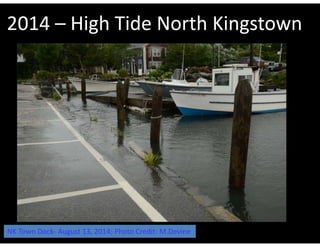

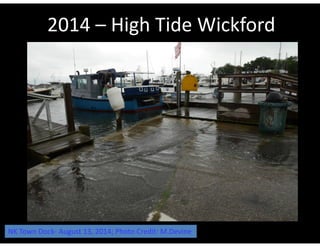
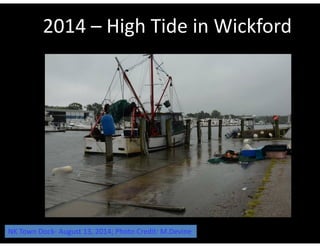

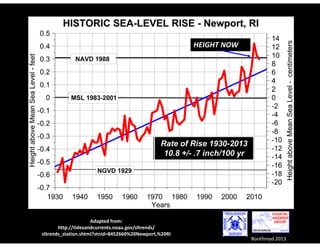
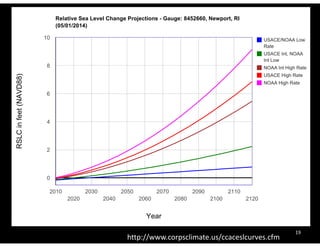
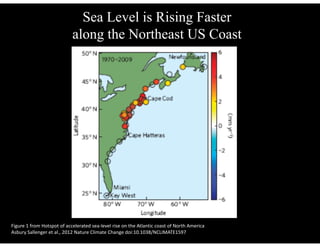
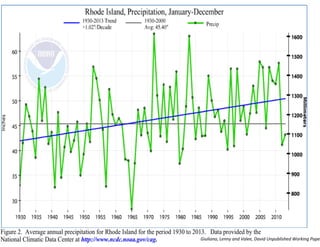
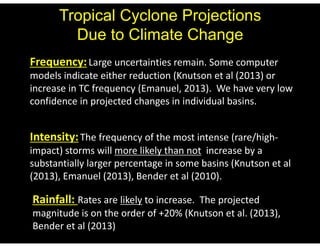
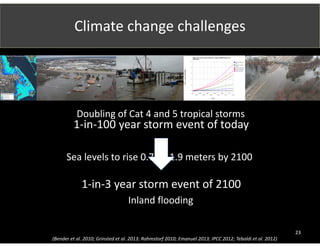
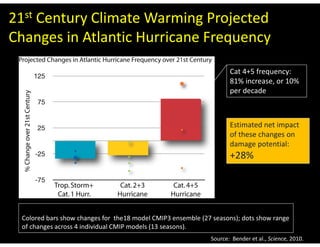
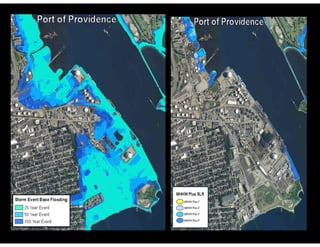
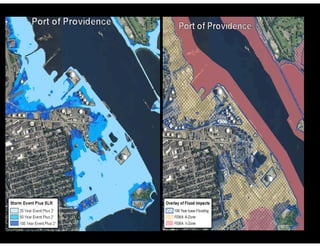
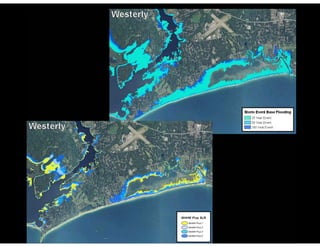
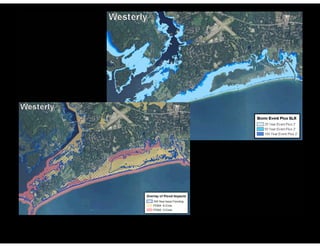
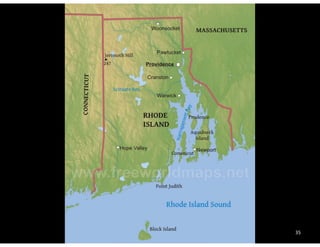
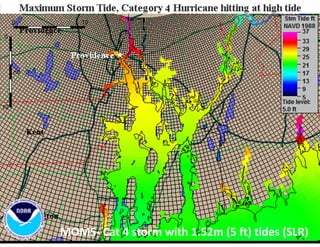
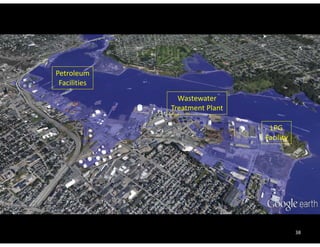

The document presents an overview of climate change impacts on Rhode Island's coastline, highlighting recent extreme weather events, relative sea level change projections, and historical flooding trends. It emphasizes the accelerated rise in sea levels along the Northeast US coast and the projected increase in the intensity and frequency of severe storms due to climate change. The findings urge the need for adaptation measures for coastal businesses and infrastructure in response to future flooding risks.


