Download as PDF, PPTX
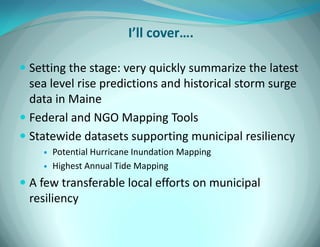
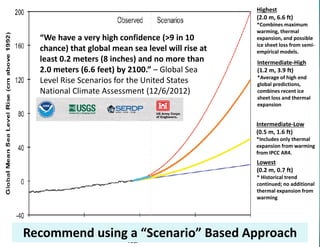
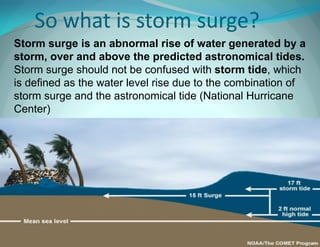
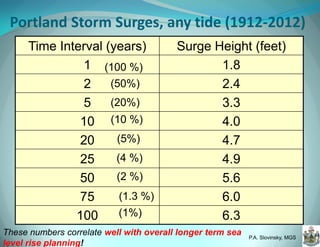
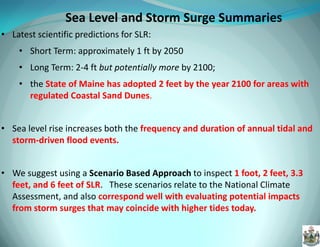
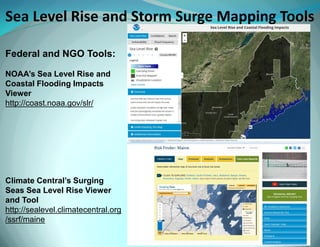
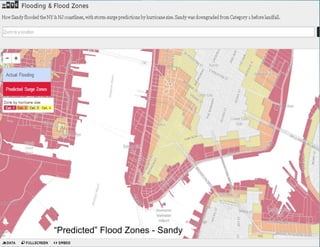
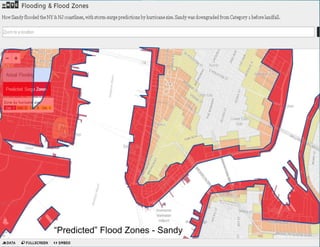
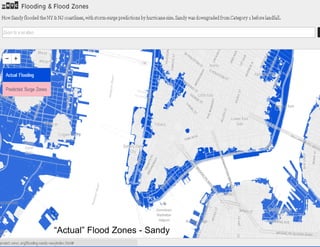
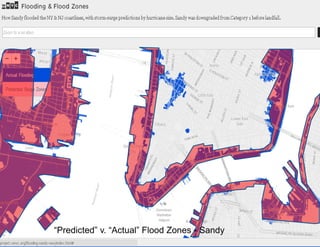
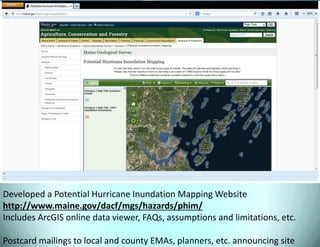
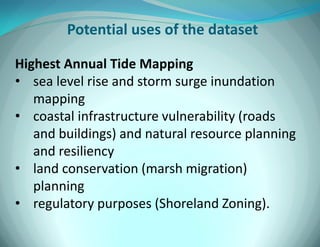
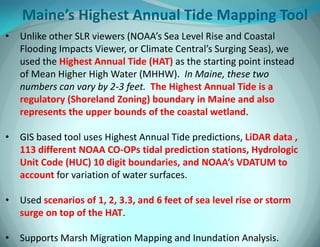
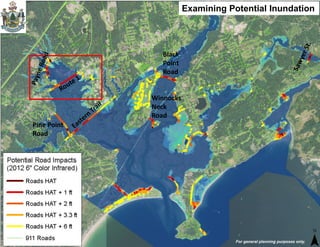
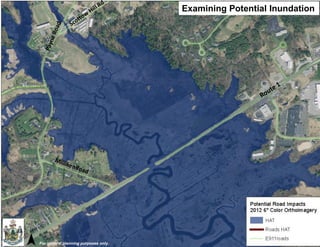
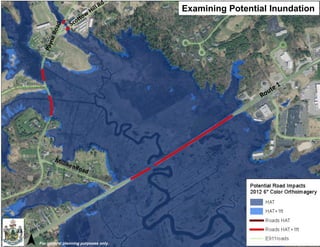
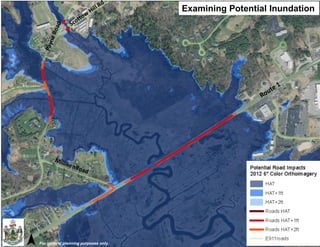
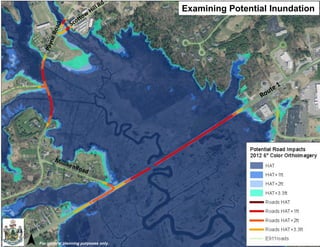
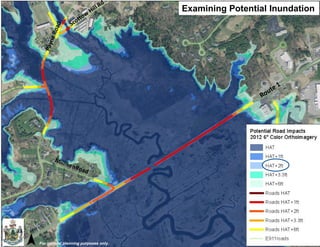
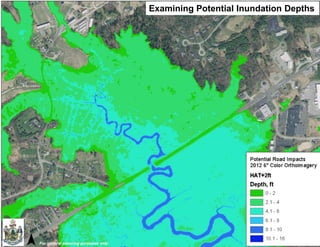
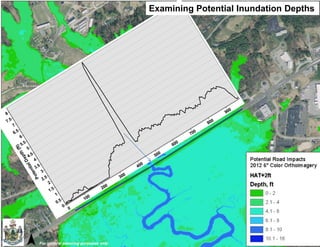
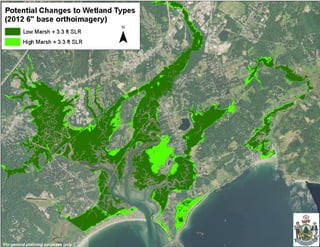
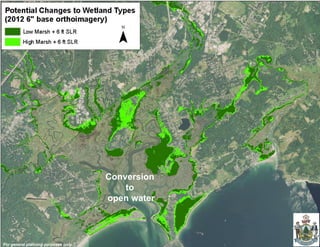
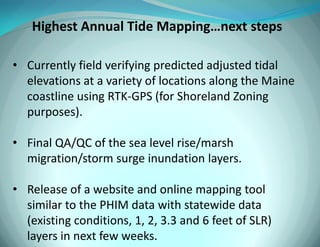
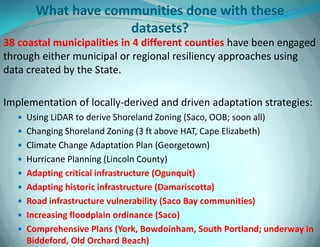
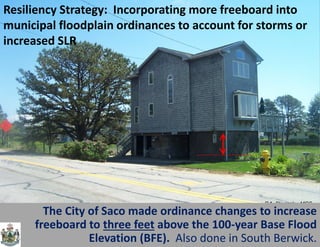
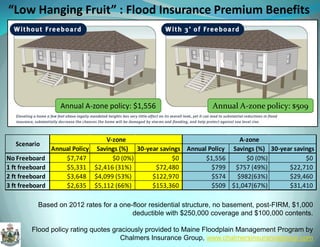
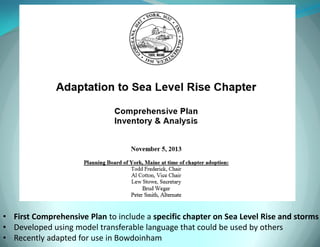
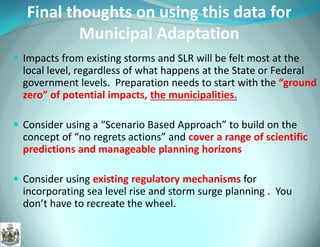

The document presents insights into sea level rise predictions and storm surge data for Maine, highlighting various mapping tools and datasets that enhance municipal resiliency planning. It outlines the implications of sea level rise and storm surges on flooding events, emphasizing the importance of adapting municipal infrastructure through specific land zoning and preparedness strategies. Various municipalities have already begun utilizing state-created datasets to inform local adaptation efforts against climate impacts.


