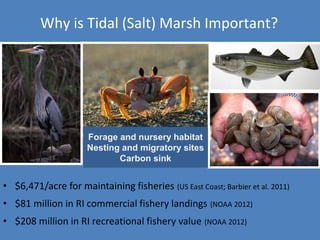
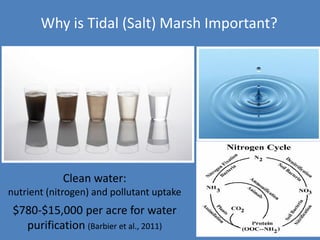
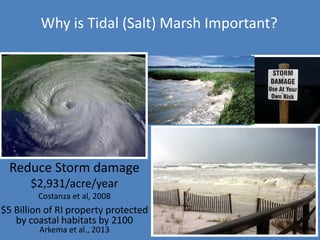
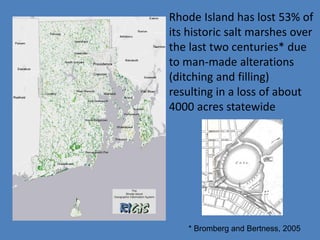
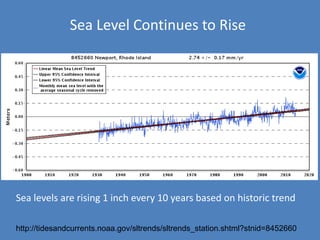
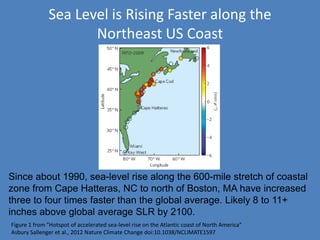
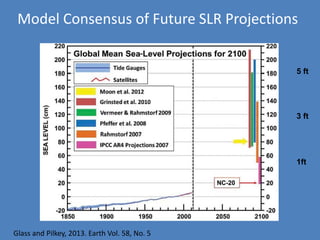
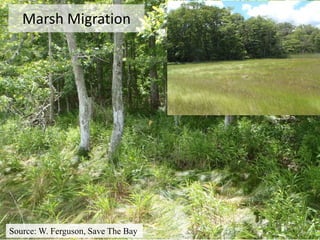
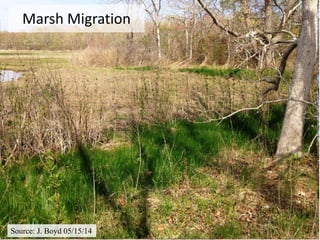
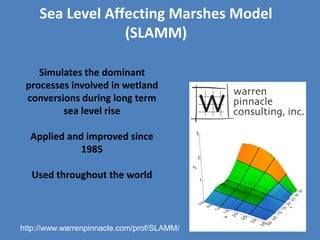
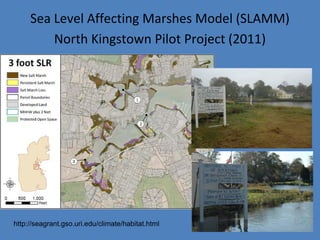
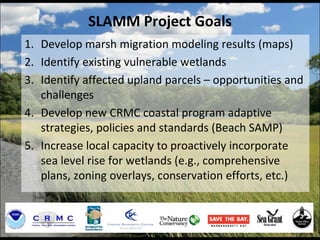
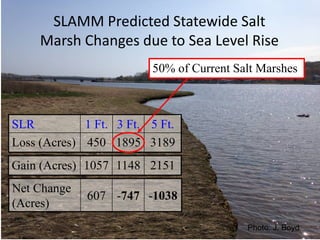
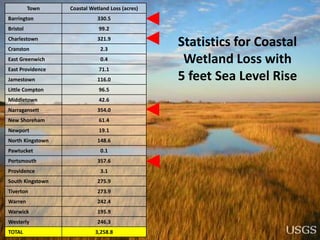
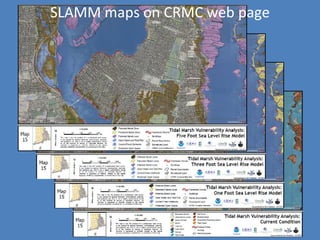
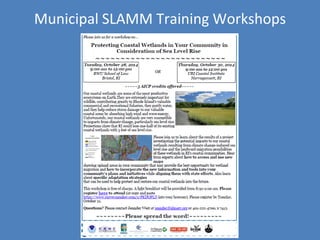
Photo: R. Hancock
Sea Levels Affecting Marshes Model
Using SLAMM to Conserve
Rhode Island’s Coastal Wetlands
Municipal Training Workshops
October 28 & 30, 2014
James Boyd, CRMC Coastal Policy Analyst
Aesthetic Value of Salt Marshes
Painting: Charles Gordon Harris (1891-1963)
Why is Tidal (Salt) Marsh Important?
Forage and nursery habitat
Nesting and migratory sites
Carbon sink
• $6,471/acre for maintaining fisheries (US East Coast; Barbier et al. 2011)
• $81 million in RI commercial fishery landings (NOAA 2012)
• $208 million in RI recreational fishery value (NOAA 2012)
Clean water:
nutrient (nitrogen) and pollutant uptake
$780-$15,000 per acre for water
purification (Barbier et al., 2011)
Why is Tidal (Salt) Marsh Important?
Reduce Storm damage
$2,931/acre/year
Costanza et al, 2008
$5 Billion of RI property protected
by coastal habitats by 2100
Arkema et al., 2013
Why is Tidal (Salt) Marsh Important?
Rhode Island has lost 53% of
its historic salt marshes over
the last two centuries* due
to man-made alterations
(ditching and filling)
resulting in a loss of about
4000 acres statewide
* Bromberg and Bertness, 2005
2010
2004
STB’s 10 years of restoration
monitoring has shown that
conditions can change rapidly in
tidally restricted marshes
Recently, similar degraded
conditions have been observed in
marshes with no tidal restrictions
2010Source: Save The Bay
May 15, 2014
Photo: J. Boyd
August 13, 2014
Photo: J. Boyd
Source: http://tidesandcurrents.noaa.gov/inundation/
1.9-5.4 inches
> 1 foot above MHHW 230+ times
Sea levels are rising 1 inch every 10 years based on historic trend
http://tidesandcurrents.noaa.gov/sltrends/sltrends_station.shtml?stnid=8452660
Sea Level Continues to Rise
Increasing Frequency of Nuisance Flooding
http://tidesandcurrents.noaa.gov/publications/NOAA_Technical_Report_NOS_COOPS_073.pdf
Sea Level is Rising Faster along the
Northeast US Coast
Figure 1 from “Hotspot of accelerated sea-level rise on the Atlantic coast of North America”
Asbury Sallenger et al., 2012 Nature Climate Change doi:10.1038/NCLIMATE1597
Since about 1990, sea-level rise along the 600-mile stretch of coastal
zone from Cape Hatteras, NC to north of Boston, MA have increased
three to four times faster than the global average. Likely 8 to 11+
inches above global average SLR by 2100.
Glass and Pilkey, 2013. Earth Vol. 58, No. 5
1ft
3 ft
5 ft
Model Consensus of Future SLR Projections
USACE and NOAA SLR Curves
http://corpsclimate.us/ccaceslcurves.cfm
Source: Maine SeaGrant
Marsh Migration
Marsh Migration
Source: W. Ferguson, Save The Bay
Marsh Migration
Source: J. Boyd 05/15/14
Sea Level Affecting Marshes Model
(SLAMM)
Simulates the dominant
processes involved in wetland
conversions during long term
sea level rise
Applied and improved since
1985
Used throughout the world
http://www.warrenpinnacle.com/prof/SLAMM/
Sea Level Affecting Marshes Model (SLAMM)
North Kingstown Pilot Project (2011)
http://seagrant.gso.uri.edu/climate/habitat.html
All 21 Coastal Communities Completed
Region 1
Region 2
Region 3
SLAMM Project Goals
1. Develop marsh migration modeling results (maps)
2. Identify existing vulnerable wetlands
3. Identify affected upland parcels – opportunities and
challenges
4. Develop new CRMC coastal program adaptive
strategies, policies and standards (Beach SAMP)
5. Increase local capacity to proactively incorporate
sea level rise for wetlands (e.g., comprehensive
plans, zoning overlays, conservation efforts, etc.)
SLAMM Predicted Statewide Salt
Marsh Changes due to Sea Level Rise
SLR 1 Ft. 3 Ft. 5 Ft.
Loss (Acres) 450 1895 3189
Gain (Acres) 1057 1148 2151
Net Change
(Acres)
607 -747 -1038
50% of Current Salt Marshes
Photo: J. Boyd
Statistics for Coastal
Wetland Loss with
5 feet Sea Level Rise
Town Coastal Wetland Loss (acres)
Barrington 330.5
Bristol 99.2
Charlestown 321.9
Cranston 2.3
East Greenwich 0.4
East Providence 71.1
Jamestown 116.0
Little Compton 96.5
Middletown 42.6
Narragansett 354.0
New Shoreham 61.4
Newport 19.1
North Kingstown 148.6
Pawtucket 0.1
Portsmouth 357.6
Providence 3.1
South Kingstown 275.9
Tiverton 273.9
Warren 242.4
Warwick 195.9
Westerly 246.3
TOTAL 3,258.8
SLAMM maps on CRMC web page
http://www.crmc.ri.gov/maps/maps_slamm.html
Action 6.5.3 - Adopt Sea Level Affecting Marshes Model (SLAMM) data and
projections as planning and decision-making support tool in statewide coastal
wetland monitoring, protection and restoration strategy
RI Executive Climate Change Coordinating Council
http://www.planning.ri.gov/statewideplanning/climate/index.php
Municipal SLAMM Training Workshops
Recent Releases
http://seagrant.gso.uri.edu/projects-2/topics/community-resilience/
www.RIClimateChange.org
www.beachsamp.or
SLAMM Project is part of the
Shoreline Change (Beach) SAMP
http://seagrant.gso.uri.edu/

Sea Levels Affecting Marshes Model Using SLAMM to Conserve Rhode Island’s Coastal Wetlands

  • 1.
    Photo: R. Hancock SeaLevels Affecting Marshes Model Using SLAMM to Conserve Rhode Island’s Coastal Wetlands Municipal Training Workshops October 28 & 30, 2014 James Boyd, CRMC Coastal Policy Analyst
  • 2.
    Aesthetic Value ofSalt Marshes Painting: Charles Gordon Harris (1891-1963)
  • 3.
    Why is Tidal(Salt) Marsh Important? Forage and nursery habitat Nesting and migratory sites Carbon sink • $6,471/acre for maintaining fisheries (US East Coast; Barbier et al. 2011) • $81 million in RI commercial fishery landings (NOAA 2012) • $208 million in RI recreational fishery value (NOAA 2012)
  • 4.
    Clean water: nutrient (nitrogen)and pollutant uptake $780-$15,000 per acre for water purification (Barbier et al., 2011) Why is Tidal (Salt) Marsh Important?
  • 5.
    Reduce Storm damage $2,931/acre/year Costanzaet al, 2008 $5 Billion of RI property protected by coastal habitats by 2100 Arkema et al., 2013 Why is Tidal (Salt) Marsh Important?
  • 6.
    Rhode Island haslost 53% of its historic salt marshes over the last two centuries* due to man-made alterations (ditching and filling) resulting in a loss of about 4000 acres statewide * Bromberg and Bertness, 2005
  • 7.
    2010 2004 STB’s 10 yearsof restoration monitoring has shown that conditions can change rapidly in tidally restricted marshes Recently, similar degraded conditions have been observed in marshes with no tidal restrictions 2010Source: Save The Bay
  • 8.
    May 15, 2014 Photo:J. Boyd August 13, 2014 Photo: J. Boyd
  • 9.
  • 10.
    Sea levels arerising 1 inch every 10 years based on historic trend http://tidesandcurrents.noaa.gov/sltrends/sltrends_station.shtml?stnid=8452660 Sea Level Continues to Rise
  • 11.
    Increasing Frequency ofNuisance Flooding http://tidesandcurrents.noaa.gov/publications/NOAA_Technical_Report_NOS_COOPS_073.pdf
  • 12.
    Sea Level isRising Faster along the Northeast US Coast Figure 1 from “Hotspot of accelerated sea-level rise on the Atlantic coast of North America” Asbury Sallenger et al., 2012 Nature Climate Change doi:10.1038/NCLIMATE1597 Since about 1990, sea-level rise along the 600-mile stretch of coastal zone from Cape Hatteras, NC to north of Boston, MA have increased three to four times faster than the global average. Likely 8 to 11+ inches above global average SLR by 2100.
  • 13.
    Glass and Pilkey,2013. Earth Vol. 58, No. 5 1ft 3 ft 5 ft Model Consensus of Future SLR Projections
  • 14.
    USACE and NOAASLR Curves http://corpsclimate.us/ccaceslcurves.cfm
  • 15.
  • 16.
  • 17.
    Marsh Migration Source: W.Ferguson, Save The Bay
  • 18.
  • 19.
    Sea Level AffectingMarshes Model (SLAMM) Simulates the dominant processes involved in wetland conversions during long term sea level rise Applied and improved since 1985 Used throughout the world http://www.warrenpinnacle.com/prof/SLAMM/
  • 20.
    Sea Level AffectingMarshes Model (SLAMM) North Kingstown Pilot Project (2011) http://seagrant.gso.uri.edu/climate/habitat.html
  • 21.
    All 21 CoastalCommunities Completed Region 1 Region 2 Region 3
  • 22.
    SLAMM Project Goals 1.Develop marsh migration modeling results (maps) 2. Identify existing vulnerable wetlands 3. Identify affected upland parcels – opportunities and challenges 4. Develop new CRMC coastal program adaptive strategies, policies and standards (Beach SAMP) 5. Increase local capacity to proactively incorporate sea level rise for wetlands (e.g., comprehensive plans, zoning overlays, conservation efforts, etc.)
  • 23.
    SLAMM Predicted StatewideSalt Marsh Changes due to Sea Level Rise SLR 1 Ft. 3 Ft. 5 Ft. Loss (Acres) 450 1895 3189 Gain (Acres) 1057 1148 2151 Net Change (Acres) 607 -747 -1038 50% of Current Salt Marshes Photo: J. Boyd
  • 24.
    Statistics for Coastal WetlandLoss with 5 feet Sea Level Rise Town Coastal Wetland Loss (acres) Barrington 330.5 Bristol 99.2 Charlestown 321.9 Cranston 2.3 East Greenwich 0.4 East Providence 71.1 Jamestown 116.0 Little Compton 96.5 Middletown 42.6 Narragansett 354.0 New Shoreham 61.4 Newport 19.1 North Kingstown 148.6 Pawtucket 0.1 Portsmouth 357.6 Providence 3.1 South Kingstown 275.9 Tiverton 273.9 Warren 242.4 Warwick 195.9 Westerly 246.3 TOTAL 3,258.8
  • 25.
    SLAMM maps onCRMC web page
  • 26.
  • 27.
    Action 6.5.3 -Adopt Sea Level Affecting Marshes Model (SLAMM) data and projections as planning and decision-making support tool in statewide coastal wetland monitoring, protection and restoration strategy RI Executive Climate Change Coordinating Council http://www.planning.ri.gov/statewideplanning/climate/index.php
  • 28.
  • 29.
  • 30.
    www.beachsamp.or SLAMM Project ispart of the Shoreline Change (Beach) SAMP http://seagrant.gso.uri.edu/