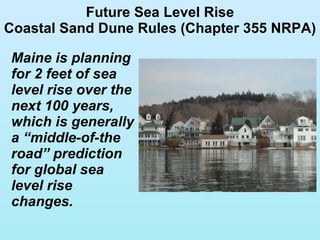
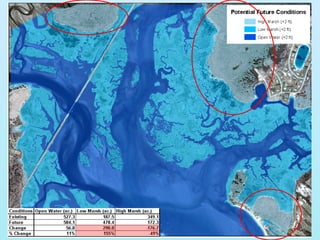
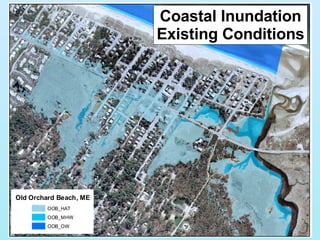
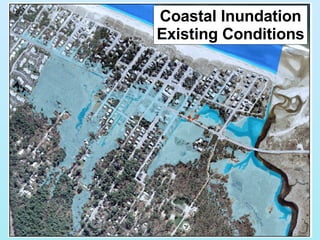
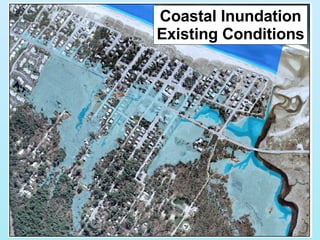
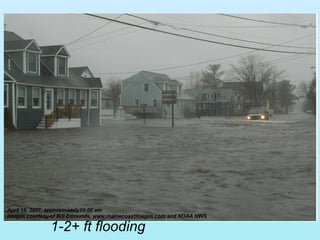
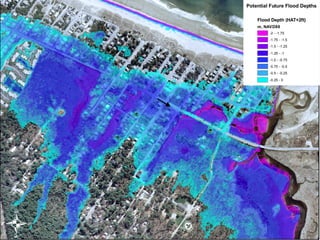
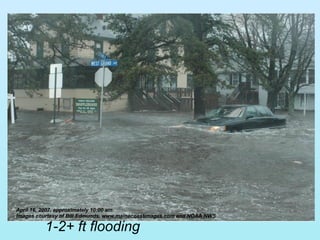
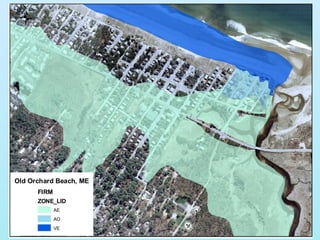
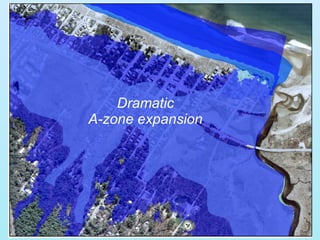
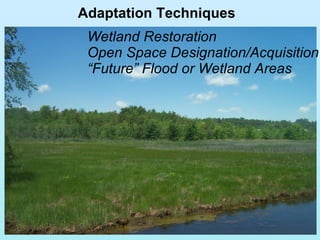
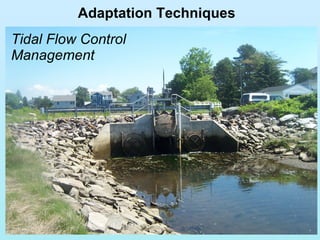
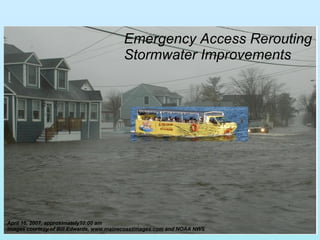
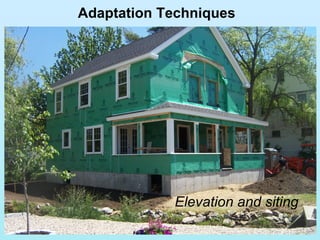
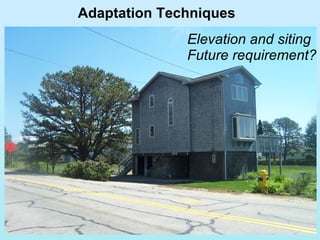
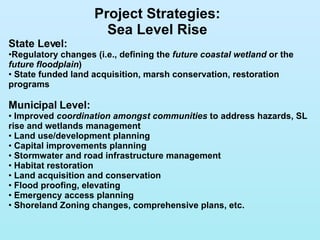
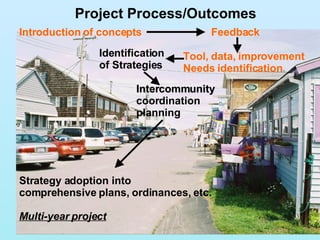
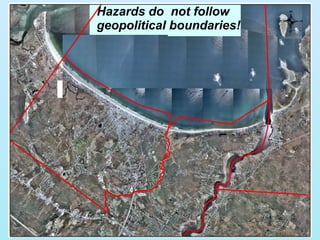
Coastal Resiliency, Science, and Community Planning for Sea Level Rise and the Perfect Storm Peter Slovinsky, Coastal Geologist Maine Geological Survey, Department of Conservation Funding from:
Outreach, Partnership Development, and Education How to achieve said goal? Outreach and Partnership Development State Agencies – Regional Planning Commissions - Municipalities S outhern  M aine  R egional  P lanning  C ommission
Available Hazard Vulnerability Assessment Tools Education – GIS Data and Tools Erosion Hazard Area Designation:   Regulatory GIS coverage.  Coastal Sand Dune Boundaries:  Regulatory GIS coverage.  Shoreline Structures:   GIS coverage LIDAR:  2004 NOAA data available.  GIS data. Digitized Flood Insurance Rate Maps:  “homemade” DFIRMs. GIS data. Maine Beach Scoring System:  guidance/management/decision-making tool to assess hazard vulnerability and management need.  GIS coverage (Historic shorelines, short term erosion, etc.) Sea Level Rise/Inundation Mapping:  GIS coverages simulating the potential impacts of 2 feet of sea level rise.
Portland Sea Level Portland Tide gauge =  global ocean over last century  1.8 mm/yr  (IPCC, 2007). In Maine, this is the fastest in past 3000 years Satellite altimetry (1993-2003) = global sea level  3.1  +  0.7 mm/yr  (IPCC, 2007)
Future Sea Level Rise Coastal Sand Dune Rules (Chapter 355 NRPA) Maine is planning for 2 feet of sea level rise over the next 100 years, which is generally a “middle-of-the road” prediction for global sea level rise changes.
“ Coastal wetlands” means all tidal and subtidal lands; all areas with vegetation present that is tolerant of salt water and occurs primarily in salt water or estuarine habitat; and any swamp, marsh, bog, beach, flat or other contiguous lowland that is subject to tidal action during the  highest tide level for each year  in which an activity is proposed as identified in tide tables published by the National Ocean Service. Coastal wetlands may include portions of coastal sand dunes. Coastal wetlands
Sea Level Rise Inundation Tool Steps : 1) Demonstrate accuracy in simulating existing conditions for tidal elevations and defining marsh habitats 2) Simulate impacts of sea level rise on: a) Existing infrastructure b) Marsh habitat c) Flood Insurance Rate Map boundaries 3) Identify at risk areas 4) Identify adaptation strategies
Saco Bay Ocean Park Scarborough Old Orchard Beach Marshes Saco Biddeford
“ Groundtruthing”
Identify marsh boundaries
Overlay LIDAR
Identify using tidal elevations
Examine Potential Impacts on Marshes
 
 
Ocean Park Old Orchard Beach
Coastal Inundation Existing Conditions 1
1
Coastal Inundation Existing Conditions 2
2
Coastal Inundation Existing Conditions 3
3
Coastal Inundation Existing Conditions 4
4
Existing Inundation Problems
Allow potential marsh transgression? Identify potential future flooding Structure renovation, removal, relocation
2007 Patriots’ Day Storm = HAT+2 ft Indicator of Future Conditions! 100 year storm = 10 year storm +  1 ft SL rise
 
1-2+ ft flooding April 16, 2007, approximately10:00 am Images courtesy of Bill Edmunds,  www.mainecoastimages.com  and NOAA NWS
 
1-2 ft flooding April 16, 2007, approximately10:00 am Images courtesy of Bill Edmunds,  www.mainecoastimages.com  and NOAA NWS
 
1-2+ ft flooding April 16, 2007, approximately 10:00 am Images courtesy of Bill Edmunds,  www.mainecoastimages.com  and NOAA NWS
 
Dramatic A-zone expansion
Potential Responses Adaptation Techniques
Adaptation Techniques Wetland Restoration Open Space Designation/Acquisition “ Future” Flood or Wetland Areas
Adaptation Techniques Tidal Flow Control Management
April 16, 2007, approximately10:00 am Images courtesy of Bill Edwards,  www.mainecoastimages.com  and NOAA NWS Emergency Access Rerouting Stormwater Improvements
Adaptation Techniques Elevation and siting
Adaptation Techniques Elevation and siting Future requirement?
Utility Relocation Adaptation Techniques
State Level: Regulatory changes (i.e., defining the  future coastal wetland  or the  future floodplain ) State funded land acquisition, marsh conservation, restoration programs Municipal Level: Improved  coordination amongst communities  to address hazards, SL rise and wetlands management Land use/development planning Capital improvements planning Stormwater and road infrastructure management Habitat restoration Land acquisition and conservation Flood proofing, elevating  Emergency access planning Shoreland Zoning changes, comprehensive plans, etc. Project Strategies: Sea Level Rise
Introduction of concepts Feedback Project Process/Outcomes Strategy adoption into  comprehensive plans, ordinances, etc. Multi-year project Intercommunity coordination planning Identification of Strategies Tool, data, improvement Needs identification
Hazards do  not follow geopolitical boundaries!

Slovinsky Coastal Resiliency

  • 1.
    Coastal Resiliency, Science,and Community Planning for Sea Level Rise and the Perfect Storm Peter Slovinsky, Coastal Geologist Maine Geological Survey, Department of Conservation Funding from:
  • 2.
    Outreach, Partnership Development,and Education How to achieve said goal? Outreach and Partnership Development State Agencies – Regional Planning Commissions - Municipalities S outhern M aine R egional P lanning C ommission
  • 3.
    Available Hazard VulnerabilityAssessment Tools Education – GIS Data and Tools Erosion Hazard Area Designation: Regulatory GIS coverage. Coastal Sand Dune Boundaries: Regulatory GIS coverage. Shoreline Structures: GIS coverage LIDAR: 2004 NOAA data available. GIS data. Digitized Flood Insurance Rate Maps: “homemade” DFIRMs. GIS data. Maine Beach Scoring System: guidance/management/decision-making tool to assess hazard vulnerability and management need. GIS coverage (Historic shorelines, short term erosion, etc.) Sea Level Rise/Inundation Mapping: GIS coverages simulating the potential impacts of 2 feet of sea level rise.
  • 4.
    Portland Sea LevelPortland Tide gauge = global ocean over last century 1.8 mm/yr (IPCC, 2007). In Maine, this is the fastest in past 3000 years Satellite altimetry (1993-2003) = global sea level 3.1 + 0.7 mm/yr (IPCC, 2007)
  • 5.
    Future Sea LevelRise Coastal Sand Dune Rules (Chapter 355 NRPA) Maine is planning for 2 feet of sea level rise over the next 100 years, which is generally a “middle-of-the road” prediction for global sea level rise changes.
  • 6.
    “ Coastal wetlands”means all tidal and subtidal lands; all areas with vegetation present that is tolerant of salt water and occurs primarily in salt water or estuarine habitat; and any swamp, marsh, bog, beach, flat or other contiguous lowland that is subject to tidal action during the highest tide level for each year in which an activity is proposed as identified in tide tables published by the National Ocean Service. Coastal wetlands may include portions of coastal sand dunes. Coastal wetlands
  • 7.
    Sea Level RiseInundation Tool Steps : 1) Demonstrate accuracy in simulating existing conditions for tidal elevations and defining marsh habitats 2) Simulate impacts of sea level rise on: a) Existing infrastructure b) Marsh habitat c) Flood Insurance Rate Map boundaries 3) Identify at risk areas 4) Identify adaptation strategies
  • 8.
    Saco Bay OceanPark Scarborough Old Orchard Beach Marshes Saco Biddeford
  • 9.
  • 10.
  • 11.
  • 12.
  • 13.
  • 14.
  • 15.
  • 16.
    Ocean Park OldOrchard Beach
  • 17.
  • 18.
  • 19.
  • 20.
  • 21.
  • 22.
  • 23.
  • 24.
  • 25.
  • 26.
    Allow potential marshtransgression? Identify potential future flooding Structure renovation, removal, relocation
  • 27.
    2007 Patriots’ DayStorm = HAT+2 ft Indicator of Future Conditions! 100 year storm = 10 year storm + 1 ft SL rise
  • 28.
  • 29.
    1-2+ ft floodingApril 16, 2007, approximately10:00 am Images courtesy of Bill Edmunds, www.mainecoastimages.com and NOAA NWS
  • 30.
  • 31.
    1-2 ft floodingApril 16, 2007, approximately10:00 am Images courtesy of Bill Edmunds, www.mainecoastimages.com and NOAA NWS
  • 32.
  • 33.
    1-2+ ft floodingApril 16, 2007, approximately 10:00 am Images courtesy of Bill Edmunds, www.mainecoastimages.com and NOAA NWS
  • 34.
  • 35.
  • 36.
  • 37.
    Adaptation Techniques WetlandRestoration Open Space Designation/Acquisition “ Future” Flood or Wetland Areas
  • 38.
    Adaptation Techniques TidalFlow Control Management
  • 39.
    April 16, 2007,approximately10:00 am Images courtesy of Bill Edwards, www.mainecoastimages.com and NOAA NWS Emergency Access Rerouting Stormwater Improvements
  • 40.
  • 41.
    Adaptation Techniques Elevationand siting Future requirement?
  • 42.
  • 43.
    State Level: Regulatorychanges (i.e., defining the future coastal wetland or the future floodplain ) State funded land acquisition, marsh conservation, restoration programs Municipal Level: Improved coordination amongst communities to address hazards, SL rise and wetlands management Land use/development planning Capital improvements planning Stormwater and road infrastructure management Habitat restoration Land acquisition and conservation Flood proofing, elevating Emergency access planning Shoreland Zoning changes, comprehensive plans, etc. Project Strategies: Sea Level Rise
  • 44.
    Introduction of conceptsFeedback Project Process/Outcomes Strategy adoption into comprehensive plans, ordinances, etc. Multi-year project Intercommunity coordination planning Identification of Strategies Tool, data, improvement Needs identification
  • 45.
    Hazards do not follow geopolitical boundaries!