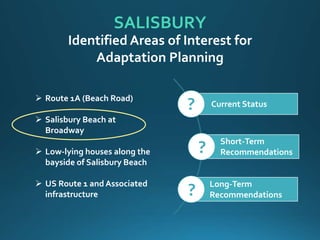
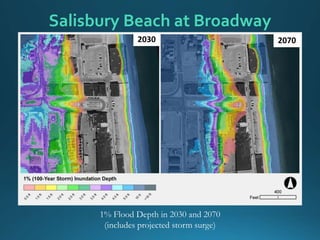
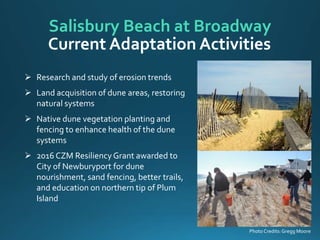
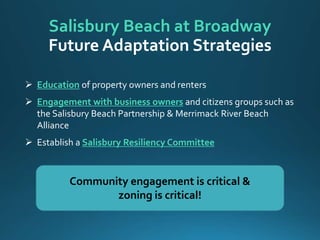
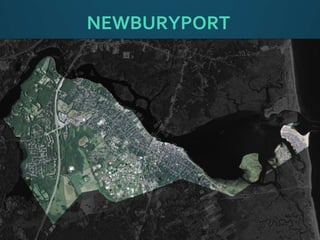
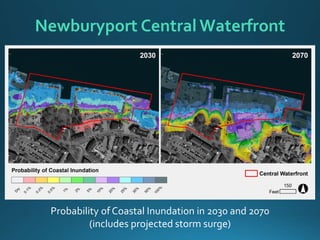
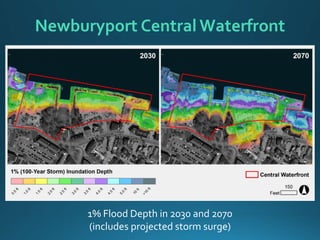
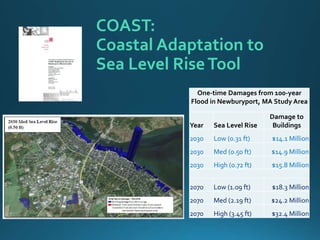
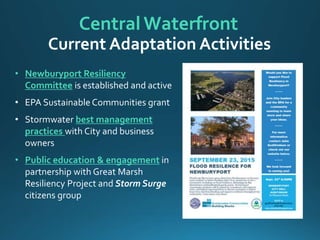
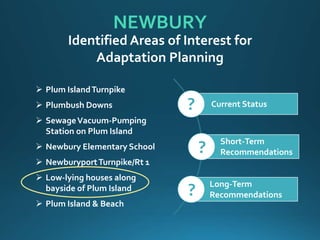
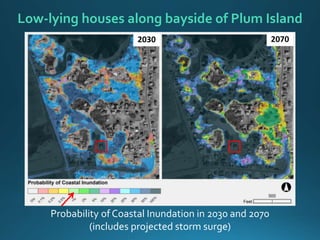
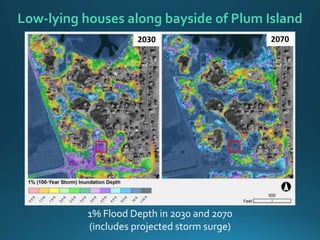
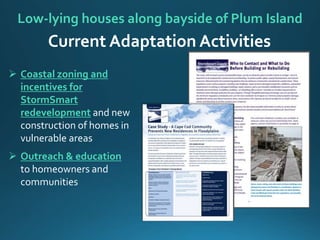
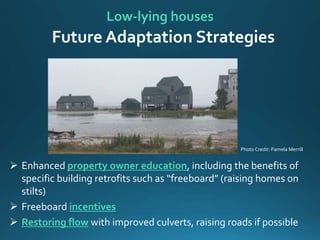
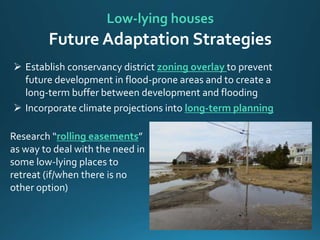
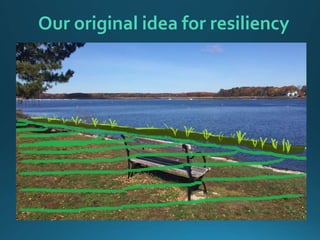
Great Marsh Adaptation Planning
Implications for Quality of Life in our Communities
Salisbury
Newburyport
Newbury
SALISBURY
SALISBURY
 Route 1A (Beach Road)
 Salisbury Beach at
Broadway
 Low-lying houses along the
bayside of Salisbury Beach
 US Route 1 and Associated
infrastructure
Identified Areas of Interest for
Adaptation Planning
Current Status
Short-Term
Recommendations
Long-Term
Recommendations
?
?
?
Salisbury
Beach
at Broadway
VULNERABILITIES:
• Erosion – chronic and
storm-related
• Storm surge flooding
Photo Credit:Gregg Moore
Photo Credits: SandyTilton
Barrier beach erosion
also on Plum Island
in Newburyport and
Newbury
Salisbury Beach at Broadway
Probability of Coastal Inundation in 2030 and 2070
(includes projected storm surge)
2030 2070
1% Flood Depth in 2030 and 2070
(includes projected storm surge)
2030 2070
Salisbury Beach at Broadway
Photo Credits:Gregg Moore
 Research and study of erosion trends
 Land acquisition of dune areas, restoring
natural systems
 Native dune vegetation planting and
fencing to enhance health of the dune
systems
 2016 CZM ResiliencyGrant awarded to
City of Newburyport for dune
nourishment, sand fencing, better trails,
and education on northern tip of Plum
Island
Salisbury Beach at Broadway
Current Adaptation Activities
 Continue acquisition of land if/when available and install dunes
 Continue dune grass planting & fencing
 Planning & Zoning: local enforcement of existing state barrier
beach regulations & exploration of other zoning regulations
including Beach Overlay Districts
 Incentives for developers to build “climate smart”, e.g. raising
buildings
Salisbury Beach at Broadway
Future Adaptation Strategies
 Education of property owners and renters
 Engagement with business owners and citizens groups such as
the Salisbury Beach Partnership & Merrimack River Beach
Alliance
 Establish a Salisbury Resiliency Committee
Salisbury Beach at Broadway
Community engagement is critical &
zoning is critical!
Future Adaptation Strategies
Need to incorporate climate projections into everyday
discussions, decisions and planning, including economic
development
NEWBURYPORT
NEWBURYPORT
 Plum IslandTurnpike
 Waste water treatment
facility
 Lower Artichoke & Bartlett
Spring Pond
 Business Park
 CentralWaterfront
 Water Street
 Plum Island & Beach
Identified Areas of Interest for
Adaptation Planning
Current Status
Short-Term
Recommendations
Long-Term
Recommendations
?
?
?
Newburyport
Central
Waterfront
Photo Credits: JoeTeixeira
VULNERABILITIES:
Flooding during astronomical tides
that coincide with multiday storm
events, affecting businesses, parks
and other recreational areas
Newburyport Central Waterfront
Probability of Coastal Inundation in 2030 and 2070
(includes projected storm surge)
1% Flood Depth in 2030 and 2070
(includes projected storm surge)
Newburyport Central Waterfront
COAST:
Coastal Adaptation to
Sea Level RiseTool
One-time Damages from 100-year
Flood in Newburyport, MA Study Area
Year Sea Level Rise
Damage to
Buildings
2030 Low (0.31 ft) $14.1 Million
2030 Med (0.50 ft) $14.9 Million
2030 High (0.72 ft) $15.8 Million
2070 Low (1.09 ft) $18.3 Million
2070 Med (2.19 ft) $24.2 Million
2070 High (3.45 ft) $32.4 Million
• Newburyport Resiliency
Committee is established and active
• EPA Sustainable Communities grant
• Stormwater best management
practices with City and business
owners
• Public education & engagement in
partnership with Great Marsh
Resiliency Project and Storm Surge
citizens group
Central Waterfront
Current Adaptation Activities
 Incorporate climate projections into master planning &
future development
 Business owner engagement
 Better overall stormwater management & best practices
 Explore building retrofits (e.g. drop-in flood barriers & longer
term floodproofing) to reduce impacts of flooding
 Explore opportunities for hybrid adaptation strategies in
“hardened” areas of riverbank (e.g. Joppa Park)
Future Adaptation Strategies
Central Waterfront
NEWBURY
NEWBURY
 Plum IslandTurnpike
 Plumbush Downs
 SewageVacuum-Pumping
Station on Plum Island
 Newbury Elementary School
 NewburyportTurnpike/Rt 1
 Low-lying houses along
bayside of Plum Island
 Plum Island & Beach
Identified Areas of Interest for
Adaptation Planning
Current Status
Short-Term
Recommendations
Long-Term
Recommendations
?
?
?
VULNERABILITIES:
• Flooding from the river-
side (storm surge plus sea
level rise) affects homes,
roads, & the PI sewage
pump station
Low-lying houses
along bayside of
Plum Island
Probability of Coastal Inundation in 2030 and 2070
(includes projected storm surge)
Low-lying houses along bayside of Plum Island
2030 2070
Low-lying houses along bayside of Plum Island
1% Flood Depth in 2030 and 2070
(includes projected storm surge)
2030 2070
Low-lying houses along bayside of Plum Island
Current Adaptation Activities
 Coastal zoning and
incentives for
StormSmart
redevelopment and new
construction of homes in
vulnerable areas
 Outreach & education
to homeowners and
communities
Low-lying houses
Future Adaptation Strategies
 Enhanced property owner education, including the benefits of
specific building retrofits such as “freeboard” (raising homes on
stilts)
 Freeboard incentives
 Restoring flow with improved culverts, raising roads if possible
Photo Credit: Pamela Merrill
Low-lying houses
Future Adaptation Strategies
 Establish conservancy district zoning overlay to prevent
future development in flood-prone areas and to create a
long-term buffer between development and flooding
 Incorporate climate projections into long-term planning
Research “rolling easements”
as way to deal with the need in
some low-lying places to
retreat (if/when there is no
other option)
Cashman Park, Newburyport
Today
Our original idea for resiliency
Our revised post-election idea

GM Symposium - Jon-Eric White

  • 1.
    Great Marsh AdaptationPlanning Implications for Quality of Life in our Communities Salisbury Newburyport Newbury
  • 2.
  • 3.
    SALISBURY  Route 1A(Beach Road)  Salisbury Beach at Broadway  Low-lying houses along the bayside of Salisbury Beach  US Route 1 and Associated infrastructure Identified Areas of Interest for Adaptation Planning Current Status Short-Term Recommendations Long-Term Recommendations ? ? ?
  • 4.
    Salisbury Beach at Broadway VULNERABILITIES: • Erosion– chronic and storm-related • Storm surge flooding Photo Credit:Gregg Moore
  • 5.
    Photo Credits: SandyTilton Barrierbeach erosion also on Plum Island in Newburyport and Newbury
  • 6.
    Salisbury Beach atBroadway Probability of Coastal Inundation in 2030 and 2070 (includes projected storm surge) 2030 2070
  • 7.
    1% Flood Depthin 2030 and 2070 (includes projected storm surge) 2030 2070 Salisbury Beach at Broadway
  • 8.
    Photo Credits:Gregg Moore Research and study of erosion trends  Land acquisition of dune areas, restoring natural systems  Native dune vegetation planting and fencing to enhance health of the dune systems  2016 CZM ResiliencyGrant awarded to City of Newburyport for dune nourishment, sand fencing, better trails, and education on northern tip of Plum Island Salisbury Beach at Broadway Current Adaptation Activities
  • 9.
     Continue acquisitionof land if/when available and install dunes  Continue dune grass planting & fencing  Planning & Zoning: local enforcement of existing state barrier beach regulations & exploration of other zoning regulations including Beach Overlay Districts  Incentives for developers to build “climate smart”, e.g. raising buildings Salisbury Beach at Broadway Future Adaptation Strategies
  • 10.
     Education ofproperty owners and renters  Engagement with business owners and citizens groups such as the Salisbury Beach Partnership & Merrimack River Beach Alliance  Establish a Salisbury Resiliency Committee Salisbury Beach at Broadway Community engagement is critical & zoning is critical! Future Adaptation Strategies
  • 11.
    Need to incorporateclimate projections into everyday discussions, decisions and planning, including economic development
  • 12.
  • 13.
    NEWBURYPORT  Plum IslandTurnpike Waste water treatment facility  Lower Artichoke & Bartlett Spring Pond  Business Park  CentralWaterfront  Water Street  Plum Island & Beach Identified Areas of Interest for Adaptation Planning Current Status Short-Term Recommendations Long-Term Recommendations ? ? ?
  • 14.
    Newburyport Central Waterfront Photo Credits: JoeTeixeira VULNERABILITIES: Floodingduring astronomical tides that coincide with multiday storm events, affecting businesses, parks and other recreational areas
  • 15.
    Newburyport Central Waterfront Probabilityof Coastal Inundation in 2030 and 2070 (includes projected storm surge)
  • 16.
    1% Flood Depthin 2030 and 2070 (includes projected storm surge) Newburyport Central Waterfront
  • 17.
    COAST: Coastal Adaptation to SeaLevel RiseTool One-time Damages from 100-year Flood in Newburyport, MA Study Area Year Sea Level Rise Damage to Buildings 2030 Low (0.31 ft) $14.1 Million 2030 Med (0.50 ft) $14.9 Million 2030 High (0.72 ft) $15.8 Million 2070 Low (1.09 ft) $18.3 Million 2070 Med (2.19 ft) $24.2 Million 2070 High (3.45 ft) $32.4 Million
  • 18.
    • Newburyport Resiliency Committeeis established and active • EPA Sustainable Communities grant • Stormwater best management practices with City and business owners • Public education & engagement in partnership with Great Marsh Resiliency Project and Storm Surge citizens group Central Waterfront Current Adaptation Activities
  • 19.
     Incorporate climateprojections into master planning & future development  Business owner engagement  Better overall stormwater management & best practices  Explore building retrofits (e.g. drop-in flood barriers & longer term floodproofing) to reduce impacts of flooding  Explore opportunities for hybrid adaptation strategies in “hardened” areas of riverbank (e.g. Joppa Park) Future Adaptation Strategies Central Waterfront
  • 20.
  • 21.
    NEWBURY  Plum IslandTurnpike Plumbush Downs  SewageVacuum-Pumping Station on Plum Island  Newbury Elementary School  NewburyportTurnpike/Rt 1  Low-lying houses along bayside of Plum Island  Plum Island & Beach Identified Areas of Interest for Adaptation Planning Current Status Short-Term Recommendations Long-Term Recommendations ? ? ?
  • 22.
    VULNERABILITIES: • Flooding fromthe river- side (storm surge plus sea level rise) affects homes, roads, & the PI sewage pump station Low-lying houses along bayside of Plum Island
  • 23.
    Probability of CoastalInundation in 2030 and 2070 (includes projected storm surge) Low-lying houses along bayside of Plum Island 2030 2070
  • 24.
    Low-lying houses alongbayside of Plum Island 1% Flood Depth in 2030 and 2070 (includes projected storm surge) 2030 2070
  • 25.
    Low-lying houses alongbayside of Plum Island Current Adaptation Activities  Coastal zoning and incentives for StormSmart redevelopment and new construction of homes in vulnerable areas  Outreach & education to homeowners and communities
  • 26.
    Low-lying houses Future AdaptationStrategies  Enhanced property owner education, including the benefits of specific building retrofits such as “freeboard” (raising homes on stilts)  Freeboard incentives  Restoring flow with improved culverts, raising roads if possible Photo Credit: Pamela Merrill
  • 27.
    Low-lying houses Future AdaptationStrategies  Establish conservancy district zoning overlay to prevent future development in flood-prone areas and to create a long-term buffer between development and flooding  Incorporate climate projections into long-term planning Research “rolling easements” as way to deal with the need in some low-lying places to retreat (if/when there is no other option)
  • 28.
  • 29.
    Our original ideafor resiliency
  • 30.

Editor's Notes

  • #2 Hello everyone – I’m …. (introduction, member of the municipal task force, etc) Now you’ve heard about the bog picture of socio-economic vulnerability from Nate Wood, and you’ve heard about the resiliency planning process from Taj and the breadth of adaptation strategies from Melissa. Now, we are going to walk you through some of the most significant vulnerabilities to be found in the Great Marsh, by walking you through each of the six towns. In each town we will focus on one issue in that town that is relevant throughout other towns as well, and we will look closely at the strategies and activities we are focusing on for the communities to address and adapt to the future impacts of climate change. We’ll start with Salisbury.
  • #3 Salisbury is the northernmost coastal community in MA – bordered by Seabrook, NH to the north and Merrimack River on the south Majority of the town’s infrastructure is located in two sections: Salisbury Beach and Salisbury Square Salisbury Beach is a 3.8-mile barrier beach, accessed along Route 1A also called Beach Road 8,283 year-round residents, grows to as many as 24,000 in summer, heavily concentrated along the Beach Salisbury Beach has extreme importance to the economic health of the town – summer residents as well as seasonal tourism
  • #4 As you have heard from Taj and Melissa, the Municipal Task Forces worked in a northerly group (Salisbury, Newburyport and Newbury), but we also help break-out discussions to identify issues most important to each specific municipality. ….Show range of assets/areas being focused on for adaptation planning. We identified the priority Vulnerable Areas, we identified any Current Activities underway to address the problems, and then identified short-term and long-term Solutions. Now I am going to walk you through on of the priority issues in Salisbury. “in the interest of time” we’re going to be highlighting one particular area of interest for reasons X, Y, Z and the range of adaptation strategies we’re looking at therein
  • #5 One of the priority areas of town most vulnerable to climate impacts is Salisbury Beach at Broadway, also called the Broadway Mall Vulnerabilities include: Erosion - chronic and storm-related Storm surge flooding, causing pavement to be ripped up, debris, etc. This area is regularly flooded during regular north-easters & high tides. Flooding pools at the intersection of Beach Road/Route 1A and the roads that run parallel to the beach; usually floods for 1 or 2 days. Flooding often lasts for about 6 hours at a time during these tidal events Direct Consequences of Hazard: Intersection is not drivable during peak of flood; requires access via Route 286 in northern part of town. Will get much worse as sea level rise continues. Debris and maintenance from everyday storms is repetitive and costly to town, impacts which will be exacerbated by sea level rise and heavier storms.
  • #6 Erosion is occurring throughout the barrier beaches of the Great Marsh – Salisbury Beach, Plum Island, and Crane Beach/ Sand is moving all around, shifting from dunes to beach to ocean sand bars; used to change every year - now changes are visible seasonally. The movement of the sand impacts resources and species, and the general health of the beach and dunes as a protective ecosystem is threatened and vulnerable. As you can see in these photos of Plum Island, erosion is having severe consequences to beach communities. Currently, the retreating shoreline is encroaching on residences, particularly in this northern Plum Island neighborhood called Reservation Terrace
  • #7 You can see here the Broadway Mall area. The darkest color shows the areas that have the highest probability of flooding – the dark gray color denotes 100% probability of flooding at least once during the designated year. The map on the left shows probabilities for 2030 and the right map shows 2070. As you can see, flooding of Route 1A, the access road to the Beach Center, increases and spreads west in the future, while flooding coming in from both the ocean side and the Merrimack River also expands. Point out that the probability of coastal inundation doesn’t take into account erosion. That probability of flooding assumes a static shoreline with no dune erosion. But we all know dunes erode during storms, especially unvegetated dunes that are heavily traversed. So along barrier beaches that are protected by dunes, the probability of coastal inundation could actually be higher than what is shown in the map.
  • #8 Here’s a closer look at the actual DEPTH of flooding at this location. The purple and blue colors range between a depth of 3 ft to 10 ft, the darkest blue color on the left side of the 2070 image show depths greater than 10 feet. You can see that much of the flooding is actually due to storm surge that travels easterly from the salt marshes on the back side of the beach development. Meanwhile, along the beach side, you can see that as sea levels rise, increased flooding from the oceans and storm surge impact the beach community in an increasingly concerning way. The structures built along the beach become increasingly vulnerable. With increased storm surge comes increased erosion of the beach. We are seeing this issue currently and vividly along the northern beaches of Plum Island.
  • #9 There are many folks currently working on strategies to help Salisbury and Plum Island address erosion of the beaches. Strategies are focused on ways to build up the resiliency of the beach and dune system so it can serve as a protective buffer against storms. RESEARCH/STUDY: Researchers are seeking to learn more about how the erosion is occurring over time. Studies show there is a cyclic process, where erosion changes with the degradation of & repair of the rock jetty system at the mouth of the Merrimack River. Sand movement trends are being studied in the Great Marsh modelling project as well as an Army Corps study. In addition to research and study that is ongoing and seeking to learn more about the causes of erosion, individuals, communities, and their state and regional partners are finding ways to improve the resiliency of the beach system. DCR recently acquired a former building site on Salisbury Beach, land just south of Beach Center, to enlarge beach area to compensate for erosion from storms State and reginal partners such as UNH are leading efforts to plant dune grass, engaging with community groups and schools Newburyport has been awarded a CZM Resiliency Grant to complete a focused effort along the Reservation Terrace neighborhood of Plum Island, including dune nourishment, sand fencing, and education and engagement of the residents about ways they can help preserve the health of the beach and dunes
  • #10 Also: Zoning should focus on incentives, including raising buildings
  • #11 Work with neighborhoods to establish delineated public trails to the beach, so as to protect the dunes from overuse
  • #12 Communities are making decisions about these issues every day! In October, Salisbury Town Meeting passed new Beach Center zoning amendments aimed at encouraging economic development of the downtown – new rules allow 89-foot high buildings (versus 65-foot) by special permit. Two Planning Initiatives are underway currently that NEED TO INCLUDE and CONSIDER CLIMATE PROJECTIONS: - Voters approved town funding to hire consultants to redesign the Broadway Mall. - The town has received funding from the State for a new Boardwalk and Welcome Center at the Beach Center.
  • #13 City of Newburyport Bordered by Merrimack River to north, Newbury to south - includes northern tip of Plum Island 17,800 year-round residents Historic downtown waterfront district is the civic and commercial center of the city However, the Newburyport Business Park is the hub of the industrial and business economy of the City, home to approx. 60 industrial businesses Business Park is along the border with Newbury, bounded to the south and west by the Little River and the “Common Pasture” farmland, to the east are the important transportation hubs of the MBTA Train Station and Route 1
  • #14 Show range of assets/areas being focused on for adaptation planning. We identified the priority Vulnerable Areas, we identified any Current Activities underway to address the problems, and then identified short-term and long-term Solutions. Now I am going to walk you through on of the priority issues in Salisbury. “in the interest of time” we’re going to be highlighting one particular area of interest for reasons X, Y, Z and the range of adaptation strategies we’re looking at therein
  • #15 Flooding during astronomical tides that coincide with multiday storm events * River Jetty system impairs discharge of storm water. Storm surge on ocean raises sea level above river Frequency of Hazard: Every 5 years or so Typical Duration of Hazard: 1-3 days Direct Consequences of Hazard: Waterfront and park inaccessible. Rivers Edge condos flood as well as waterfront businesses. Cumulative Consequences of Hazard: Over time, as sea levels rise, usefulness of parks will be impacted & businesses may tire of flooding impacts
  • #16 Infrastructure located immediately along the bank of the Merrimack, including the Black Cow Restaurant and bordering businesses, are quite vulnerable to flooding and sea level rise. In particular, the waterfront includes a boardwalk that has high community and tourist use for recreational and cultural events. The future of a large open parking lot abutting the riverfront boardwalk has been a subject of discussion for many years, with plans for a hotel and commercial elements in conflict with support for an “open waterfront.” Infrastructure located along Water Street and Merrimack Street is less vulnerable than the direct waterfront, however this area is also subject to occasional flooding. Infrastructure further inland doesn’t flood from the river’s storm surge but is vulnerable to flooding caused by heavy precipitation events. Outdated and insufficient drainage systems don’t have the capacity to remove flood waters quickly enough, increasing the vulnerability of downtown areas such as Market Square. The USGS analysis indicates this area is already vulnerable to inundation during a 1% or 0.2% storm, likely flooding up to 48% of the area with approximately less than four feet of water. By 2070, up to 91% of the area is susceptible to flooding during a major 1% or 0.2% storm, sending between 5-20 feet of water over much of the area.
  • #17 Here’s a closer look at the actual DEPTH of flooding at this location. The purple and blue colors range between a depth of 3 ft to 10 ft, the darkest blue color on the left side of the 2070 image show depths greater than 10 feet. You can see that much of the flooding is actually due to storm surge that travels easterly from the salt marshes on the back side of the beach development. Meanwhile, along the beach side, you can see that as sea levels rise, increased flooding from the oceans and storm surge impact the beach community in an increasingly concerning way. The structures built along the beach become increasingly vulnerable. With increased storm surge comes increased erosion of the beach. We are seeing this issue currently and vividly along the northern beaches of Plum Island.
  • #18 COAST project is a subcomponent of the Great Marsh Resiliency Planning effort, a contract with GEI consultants to explore how the COAST tool can be used by a community to understand potential real estate damages from sea level rise and storm surge events. Time horizons chosen based on feedback from CZM and others; These align with DOT time horizons they’re using to assess risk as well as what other towns are using. This image shows one-time damage estimate for 100-year flood in 2030 with medium sea level rise 100-year storm in 2030 will cause between 14 and 16 million. SLR doesn’t have a huge impact yet. In 2070, low SLR or high SLR makes a big difference. 18 million or 32 million. Based on these numbers, Newburyport has some significant vulnerability to storm surge that will be exacerbated by SLR. Other communities can consider using the COAST tool to inform their understanding of impacts to real estate values from climate change.
  • #19 Newburyport Resiliency Committee is established and active EPA Sustainable Communities grant Stormwater management with City and business owners Public education & engagement in partnership with Storm Surge citizen group
  • #20 Engage and educate central waterfront committees, associations, property owners, waterfront trust and redevelopment authority so that future development/planning incorporates climate projections Joppa Park – opportunities for hybrid strategies, e.g. vegetated berms or rebuilding sea walls
  • #21 Newbury 24.2 square miles, 30% of land area is Great Marsh 6,666 year-round residents, swells in summer due to Plum Island’s seasonal homes, many located along coast of island Town’s infrastructure is located in three distinct sections: Old Town, Byfield, and Plum Island Low-lying topography (Parker River & Little River & back side of Plum Island) contribute to tidal & inland flooding
  • #23 We’ve talked a bit about the erosion issues being faced by both Newburyport and Newbury in the beach-side neighborhoods of Plum Island, as well as some adaptation strategies underway to address them. Here we want to also highlight the impact that the low-lying areas of Plum Island face from flooding from the BACK side of Plum Island, floodwaters that come into residential areas from the Merrimack River and the salt marsh to the north and west of the island. The flooding affects roads and transportation, homes, and municipal infrastructure such as the Plum Island sewage pumping station.
  • #24 We’ve talked a bit about the erosion issues being faced by both Newburyport and Newbury in the beach-side neighborhoods of Plum Island, as well as some adaptation strategies underway to address them. Here we want to also highlight the impact that the low-lying areas of Plum Island face from flooding from the BACK side of Plum Island, floodwaters that come into residential areas from the Merrimack River and the salt marsh to the north and west of the island. The flooding affects roads and transportation, homes, and municipal infrastructure such as the Plum Island sewage pumping station. This pump station (located in the red sqaure in the middle of a residential neighborhood) brings sewage from Newbury into the Newburyport sewage treatment, so it is an asset that is of significant importance to both communities. Reminder that the dark blue or black color denotes 100% likelihood of flooding at least once in that year
  • #25 Here’s a closer look at the actual DEPTH of flooding at this location. The purple and blue colors range between a depth of 3 ft to 10 ft, the darkest blue color on the left side of the 2070 image show depths greater than 10 feet.
  • #26 Current adaptation activities include coastal zoning and incentives for stormsmart redevelopment and new construction of homes in vulnerable areas. This photo shows homes at Plumbush Downs along Plum Island Turnpike, some of which have been rebuilt on stilts The Office of Coastal Zone Management has also produced an array of educational resources, available on their website, for both homeowners and communities interested in “Storm Smart” development: StormSmart Coasts. Question to all: do we want to talk about the sea wall at Blackwater in Salisbury as an example of what not to do?? Greay infrastructure doesn’t always work?
  • #27 Building retrofits can include installing backflow valves on drains, elevating utilities to prevent flood damage, and breakaway walls to prevent structural damage. It will be important to provide INCENTIVES for freeboard which will encourage homeowners and developers to raise their homes on stilts
  • #28 It is important to note that the issue of flooding that impacts low-lying homes is one that affects communities throughout the Great Marsh as well as on Plum Island. The photo here is of flooding along Conomo Point and Robbins Road in Essex. As communities are revising their master plans (as both Newburyport and Newbury are currently in the midst of) climate projections need to be incorporated. Rolling easements: town or state pays some amount to landowners in vulnerable locations today, when house finally totally floods, town demolishes it and land returns to open space THANK YOU Now we’ll turn to my colleague who will talk about our southern Great Marsh communities