Download to read offline

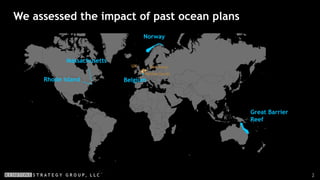
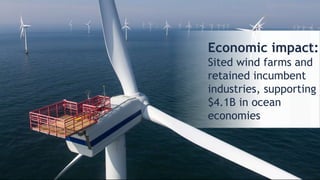

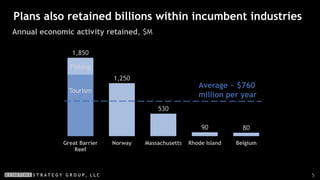
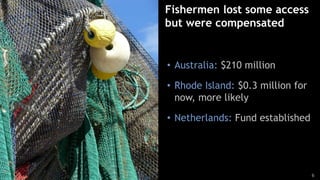

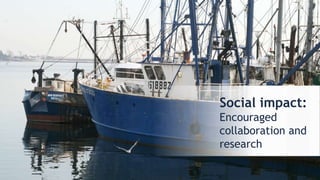
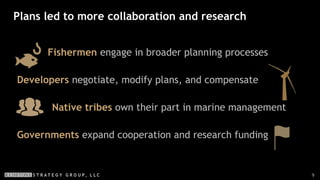
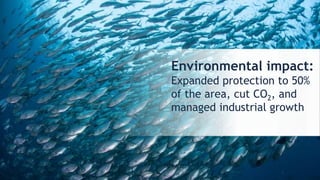
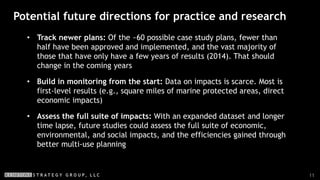


This document assessed the impact of past ocean management plans in several countries and U.S. states. It found that the plans supported $4.1 billion in ocean economies by siting wind farms and retaining existing industries. The plans also generated hundreds of millions of dollars annually in economic gains for new industries like wind power and retained billions within existing industries like fishing and tourism. While fishermen lost some access, they were compensated. The plans encouraged collaboration among stakeholders and expanded environmental protections over 50% of the planned areas while managing industrial growth. Future research on newer plans is needed to fully understand the long-term economic, environmental and social impacts of comprehensive ocean management.