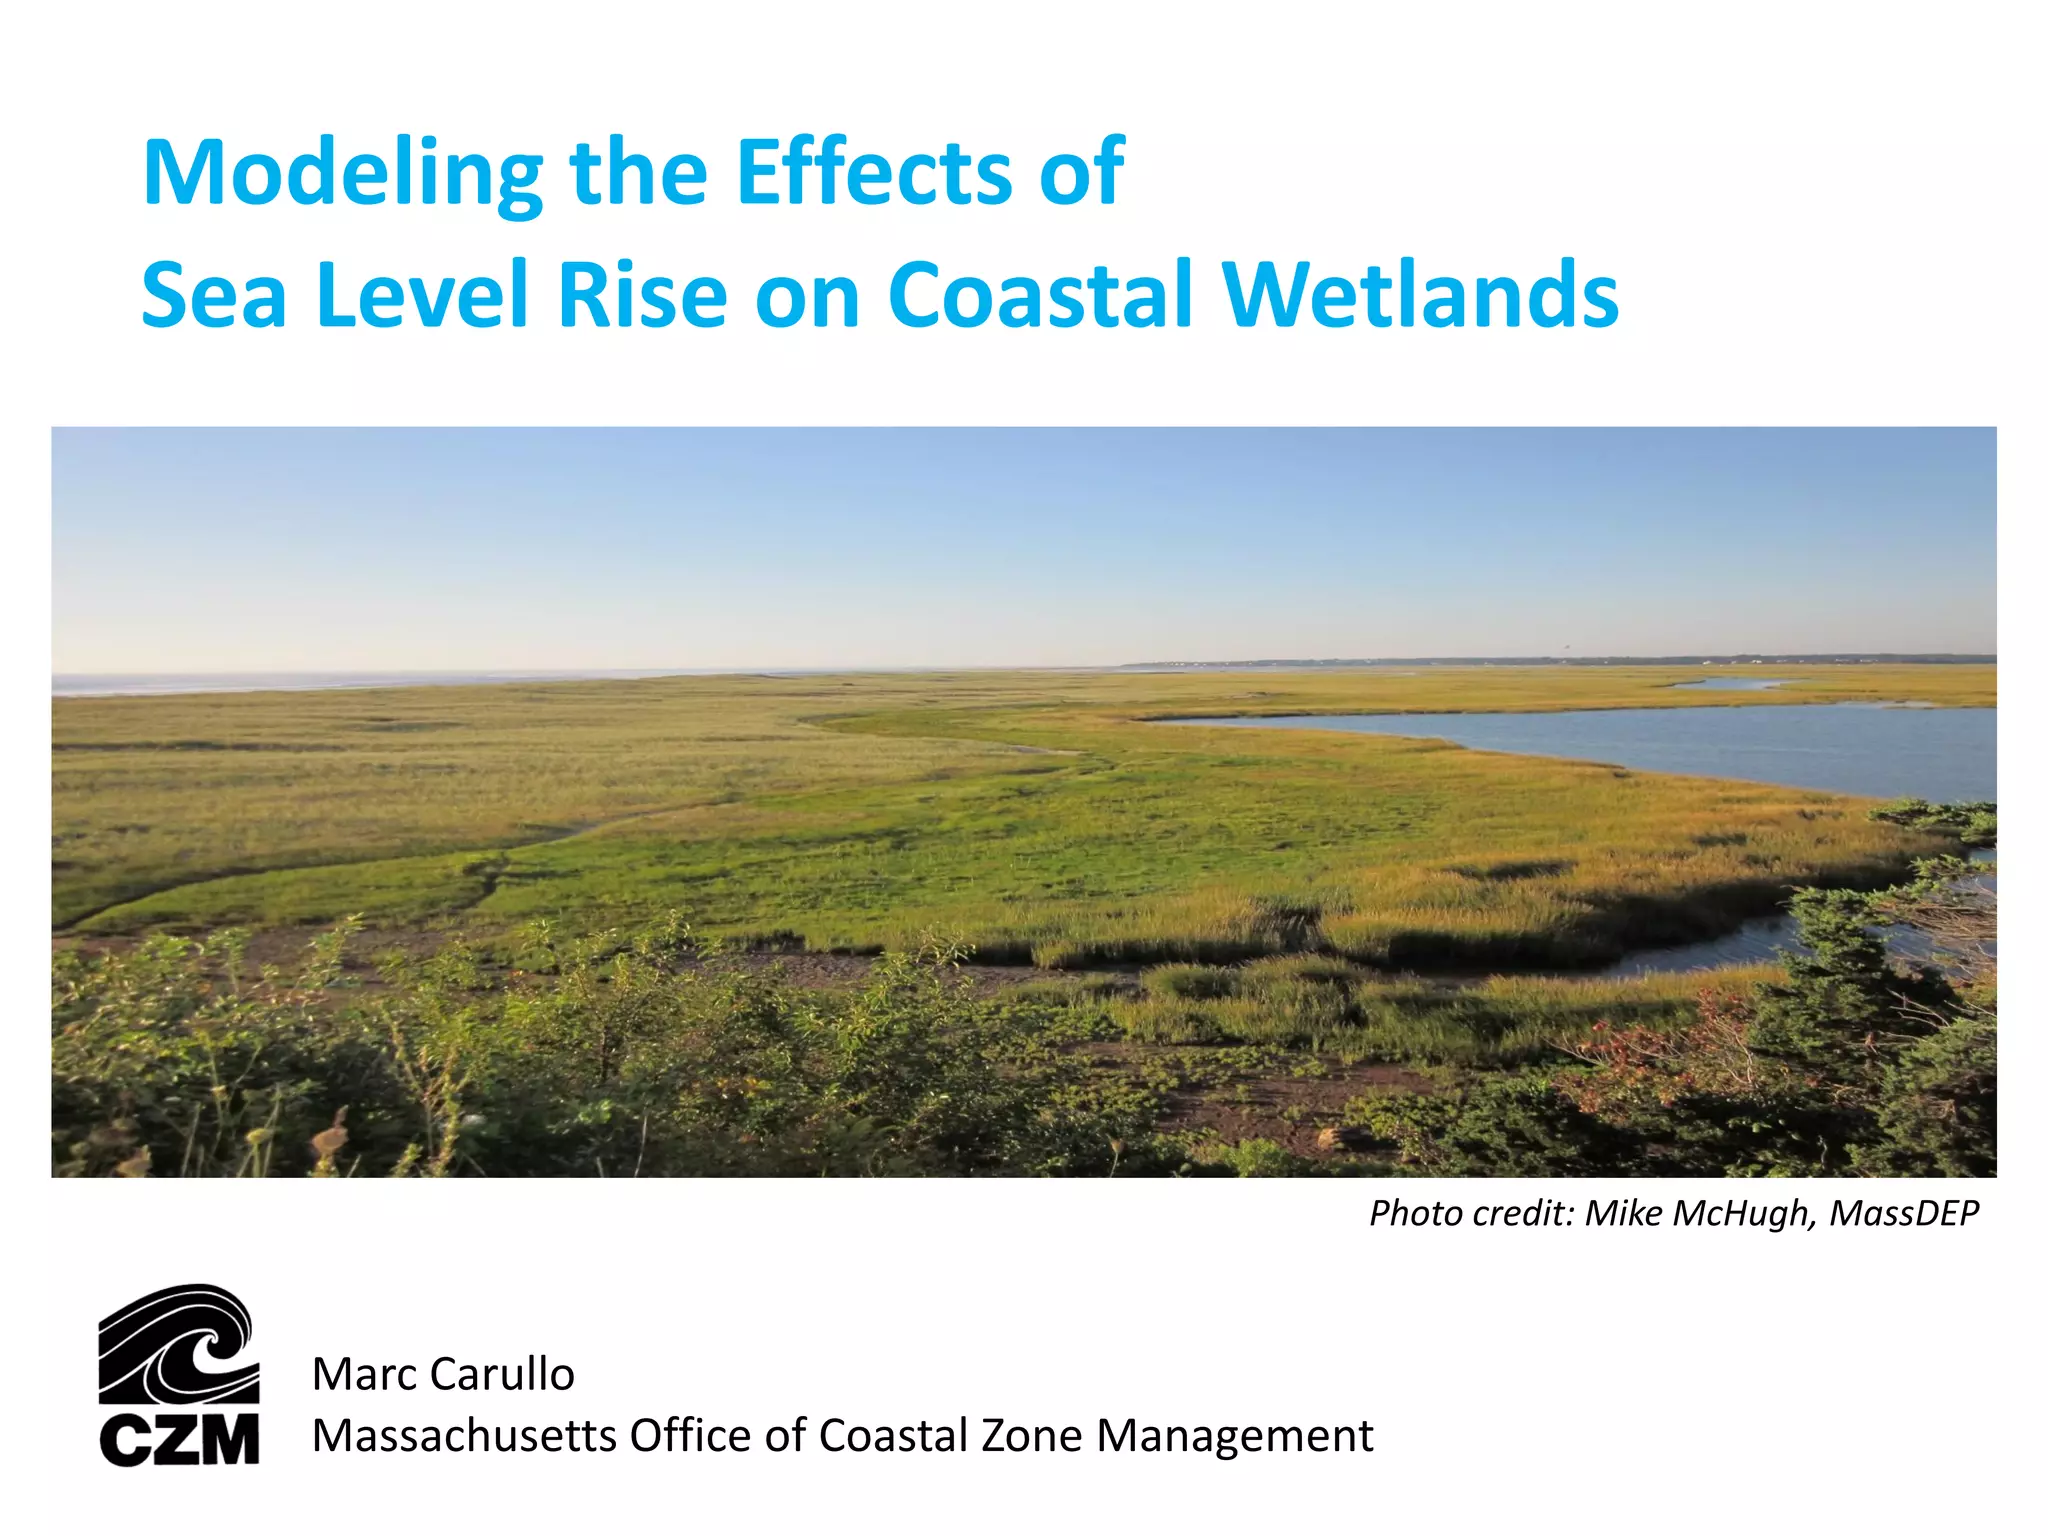
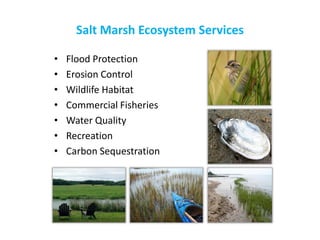
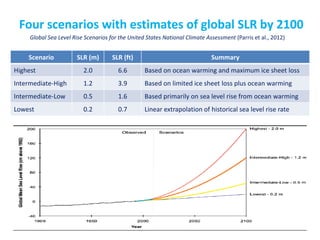
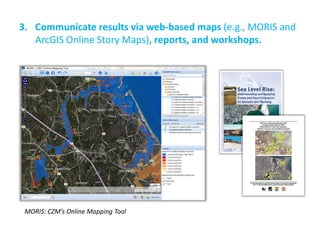
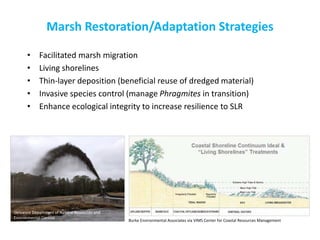
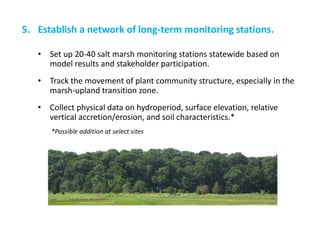
Modeling the Effects of Sea Level Rise on Coastal Wetlands 
Marc Carullo 
Massachusetts Office of Coastal Zone Management 
Photo credit: Mike McHugh, MassDEP
Salt Marsh Ecosystem Services 
•Flood Protection 
•Erosion Control 
•Wildlife Habitat 
•Commercial Fisheries 
•Water Quality 
•Recreation 
•Carbon Sequestration 
USFWS
Wetland Status & Trends 
Photo: National Park Service 
Photo: Bertness Lab – Brown University 
Photo: CZM
Four scenarios with estimates of global SLR by 2100 
Scenario 
SLR (m) 
SLR (ft) 
Summary 
Highest 
2.0 
6.6 
Based on ocean warming and maximum ice sheet loss 
Intermediate-High 
1.2 
3.9 
Based on limited ice sheet loss plus ocean warming 
Intermediate-Low 
0.5 
1.6 
Based primarily on sea level rise from ocean warming 
Lowest 
0.2 
0.7 
Linear extrapolation of historical sea level rise rate 
Global Sea Level Rise Scenarios for the United States National Climate Assessment (Parris et al., 2012)
Massachusetts Climate Change Adaptation Report 
Identify and protect undeveloped areas that are upgradient from coastal wetlands to allow wetland migration and buffer intact ecosystems 
Identify, assess and mitigate existing impediments to inland migration of coastal wetlands 
Track the movement of tidal resources as they respond to sea level rise 
Select adaptation strategies identified for coastal ecosystems:
Modeling the Effects of Sea Level Rise on Coastal Wetlands to Improve Protection, Management, and Adaptation Planning 
Project Goals 
1.Identify potential changes to wetland type across multiple temporal and spatial scales. 
2.Identify barriers to and opportunities for landward marsh migration. 
3.Communicate results via web-based maps, reports, and workshops/ meetings. 
4.Begin to develop and implement adaptation strategies to address potential SLR impacts to coastal wetlands. 
5.Establish a network of long-term monitoring stations to measure impacts of sea level rise and potential marsh migration.
1.Identify potential changes to wetland type across multiple temporal and spatial scales. 
Current MHHW 
Potential MHHW + 6 ft SLR 
*North and South Rivers in Marshfield and Scituate
Model Selection 
•Things to consider 
–Time step/simulation period 
–Spatial Resolution 
–Parameters simulated 
–Input data requirements 
–Typical scenarios/applications 
•Models considered 
–Salt Marsh Assessment & Restoration Tool (SMART) 
–Polygon-Based Spatial Model (PBS) 
–Everglades Landscape Model (ELM) 
–Marsh Equilibrium Model (MEM) 
–Sea Level Affecting Marshes Model (SLAMM)
SLAMM 6.2 
Simulates the dominant processes involved in wetland conversions and shoreline modifications during long-term sea level rise. 
Spatial Model 
Six primary processes that affect wetland fate under different SLR scenarios: 
Warren Pinnacle Consulting, Inc. 
•Inundation 
•Erosion 
•Overwash 
•Saturation 
•Accretion 
•Salinity
Data Compilation 
Contributors 
• NOAA (CO-OPS) 
• MBL/PIE LTER 
• USFWS (NWI, PRNWR) 
• MassGIS 
• USGS 
• Waquoit Bay NERR 
• NPS (CACO) 
• Others 
Additional data inputs 
• Dam locations 
• Dam crest elevations 
• SLR Historic Trend 
• Beach sedimentation rate 
• MEM accretion rates 
• Other 
Freshwater parameters (flow, etc.) 
Digital Elevation Model (lidar-derived) 
Wetland Map Data 
Impervious Surface 
Erosion rates (horizontal) 
Accretion rates (vertical) 
GD Tide Range (MHHW-MLLW) 
Data Inputs 
Salt Elevation (+ MTL)
NWI-SLAMM Crosswalk 
•NWI Hierarchical classification of wetland and deepwater habitats 
•Updated using 2008/11 imagery 
•777 unique NWI codes used within CZM project area 
•Binned into 19 out of 24 SLAMM categories for this project (not all applicable to MA)
Model Application to Pilot Site 
• Compare 2 m and 5 m grids 
• Parameter Sensitivity Analysis 
• Elevation Uncertainty Analysis
Model Application to Pilot Site 
Statewide application will include dozens of subsites due to one or more variables (accretion, erosion, tidal range, etc.).
• Coastal structures 
• Roads and railroads 
• Buildings and parking lots 
• Berms and dikes 
• Natural features (bank, rock) 
2.Identify barriers and opportunities for marsh migration.
3.Communicate results via web-based maps (e.g., MORIS and ArcGIS Online Story Maps), reports, and workshops. 
MORIS: CZM’s Online Mapping Tool
Anticipated Outcomes 
Regulatory and Restoration 
1.Support for regulatory decisions, federal consistency determinations, and the interpretation and implementation of specific performance standards. 
2.Augmented or new coastal program policies. 
3.Determination of priority restoration areas. 
4.Assessment of current wetland buffer and setback regulations.
Anticipated Outcomes 
Land Management and Education 
5.Identification of sites for land acquisition, conservation easement actions, and/or changes in land management practices. 
6.Improved management of hardened coastal structures (proposal, maintenance, or removal). 
7.Better integration of salt marshes into CZM’s StormSmart Coasts program. 
8.Public outreach and education on the fate of coastal wetlands using the latest SLR projections and local data.
Marsh Restoration/Adaptation Strategies 
•Facilitated marsh migration 
•Living shorelines 
•Thin-layer deposition (beneficial reuse of dredged material) 
•Invasive species control (manage Phragmites in transition) 
•Enhance ecological integrity to increase resilience to SLR 
Delaware Department of Natural Resources and Environmental Control 
Burke Environmental Associates via VIMS Center for Coastal Resources Management
•Set up 20-40 salt marsh monitoring stations statewide based on model results and stakeholder participation. 
•Track the movement of plant community structure, especially in the marsh-upland transition zone. 
•Collect physical data on hydroperiod, surface elevation, relative vertical accretion/erosion, and soil characteristics.* 
5.Establish a network of long-term monitoring stations. 
*Possible addition at select sites
marc.carullo@state.ma.us 
Photo credit: Adrienne Pappal, CZM

Carullo gsm 111314

  • 1.
    Modeling the Effectsof Sea Level Rise on Coastal Wetlands Marc Carullo Massachusetts Office of Coastal Zone Management Photo credit: Mike McHugh, MassDEP
  • 2.
    Salt Marsh EcosystemServices •Flood Protection •Erosion Control •Wildlife Habitat •Commercial Fisheries •Water Quality •Recreation •Carbon Sequestration USFWS
  • 3.
    Wetland Status &Trends Photo: National Park Service Photo: National Park Service Photo: Bertness Lab – Brown University Photo: CZM
  • 4.
    Four scenarios withestimates of global SLR by 2100 Scenario SLR (m) SLR (ft) Summary Highest 2.0 6.6 Based on ocean warming and maximum ice sheet loss Intermediate-High 1.2 3.9 Based on limited ice sheet loss plus ocean warming Intermediate-Low 0.5 1.6 Based primarily on sea level rise from ocean warming Lowest 0.2 0.7 Linear extrapolation of historical sea level rise rate Global Sea Level Rise Scenarios for the United States National Climate Assessment (Parris et al., 2012)
  • 5.
    Massachusetts Climate ChangeAdaptation Report Identify and protect undeveloped areas that are upgradient from coastal wetlands to allow wetland migration and buffer intact ecosystems Identify, assess and mitigate existing impediments to inland migration of coastal wetlands Track the movement of tidal resources as they respond to sea level rise Select adaptation strategies identified for coastal ecosystems:
  • 6.
    Modeling the Effectsof Sea Level Rise on Coastal Wetlands to Improve Protection, Management, and Adaptation Planning Project Goals 1.Identify potential changes to wetland type across multiple temporal and spatial scales. 2.Identify barriers to and opportunities for landward marsh migration. 3.Communicate results via web-based maps, reports, and workshops/ meetings. 4.Begin to develop and implement adaptation strategies to address potential SLR impacts to coastal wetlands. 5.Establish a network of long-term monitoring stations to measure impacts of sea level rise and potential marsh migration.
  • 7.
    1.Identify potential changesto wetland type across multiple temporal and spatial scales. Current MHHW Potential MHHW + 6 ft SLR *North and South Rivers in Marshfield and Scituate
  • 8.
    Model Selection •Thingsto consider –Time step/simulation period –Spatial Resolution –Parameters simulated –Input data requirements –Typical scenarios/applications •Models considered –Salt Marsh Assessment & Restoration Tool (SMART) –Polygon-Based Spatial Model (PBS) –Everglades Landscape Model (ELM) –Marsh Equilibrium Model (MEM) –Sea Level Affecting Marshes Model (SLAMM)
  • 9.
    SLAMM 6.2 Simulatesthe dominant processes involved in wetland conversions and shoreline modifications during long-term sea level rise. Spatial Model Six primary processes that affect wetland fate under different SLR scenarios: Warren Pinnacle Consulting, Inc. •Inundation •Erosion •Overwash •Saturation •Accretion •Salinity
  • 10.
    Data Compilation Contributors • NOAA (CO-OPS) • MBL/PIE LTER • USFWS (NWI, PRNWR) • MassGIS • USGS • Waquoit Bay NERR • NPS (CACO) • Others Additional data inputs • Dam locations • Dam crest elevations • SLR Historic Trend • Beach sedimentation rate • MEM accretion rates • Other Freshwater parameters (flow, etc.) Digital Elevation Model (lidar-derived) Wetland Map Data Impervious Surface Erosion rates (horizontal) Accretion rates (vertical) GD Tide Range (MHHW-MLLW) Data Inputs Salt Elevation (+ MTL)
  • 11.
    NWI-SLAMM Crosswalk •NWIHierarchical classification of wetland and deepwater habitats •Updated using 2008/11 imagery •777 unique NWI codes used within CZM project area •Binned into 19 out of 24 SLAMM categories for this project (not all applicable to MA)
  • 14.
    Model Application toPilot Site • Compare 2 m and 5 m grids • Parameter Sensitivity Analysis • Elevation Uncertainty Analysis
  • 15.
    Model Application toPilot Site Statewide application will include dozens of subsites due to one or more variables (accretion, erosion, tidal range, etc.).
  • 16.
    • Coastal structures • Roads and railroads • Buildings and parking lots • Berms and dikes • Natural features (bank, rock) 2.Identify barriers and opportunities for marsh migration.
  • 17.
    3.Communicate results viaweb-based maps (e.g., MORIS and ArcGIS Online Story Maps), reports, and workshops. MORIS: CZM’s Online Mapping Tool
  • 18.
    Anticipated Outcomes Regulatoryand Restoration 1.Support for regulatory decisions, federal consistency determinations, and the interpretation and implementation of specific performance standards. 2.Augmented or new coastal program policies. 3.Determination of priority restoration areas. 4.Assessment of current wetland buffer and setback regulations.
  • 19.
    Anticipated Outcomes LandManagement and Education 5.Identification of sites for land acquisition, conservation easement actions, and/or changes in land management practices. 6.Improved management of hardened coastal structures (proposal, maintenance, or removal). 7.Better integration of salt marshes into CZM’s StormSmart Coasts program. 8.Public outreach and education on the fate of coastal wetlands using the latest SLR projections and local data.
  • 20.
    Marsh Restoration/Adaptation Strategies •Facilitated marsh migration •Living shorelines •Thin-layer deposition (beneficial reuse of dredged material) •Invasive species control (manage Phragmites in transition) •Enhance ecological integrity to increase resilience to SLR Delaware Department of Natural Resources and Environmental Control Burke Environmental Associates via VIMS Center for Coastal Resources Management
  • 21.
    •Set up 20-40salt marsh monitoring stations statewide based on model results and stakeholder participation. •Track the movement of plant community structure, especially in the marsh-upland transition zone. •Collect physical data on hydroperiod, surface elevation, relative vertical accretion/erosion, and soil characteristics.* 5.Establish a network of long-term monitoring stations. *Possible addition at select sites
  • 22.