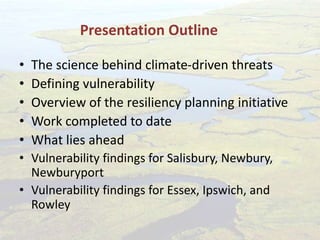
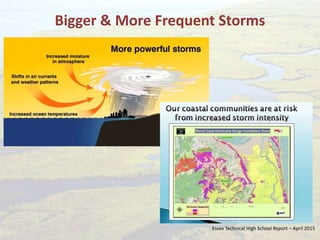
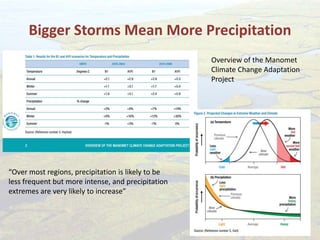
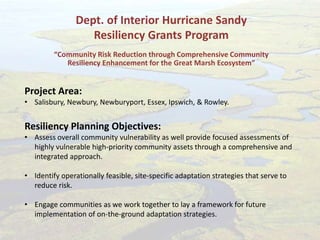
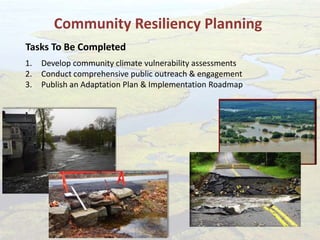
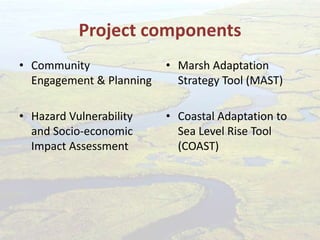
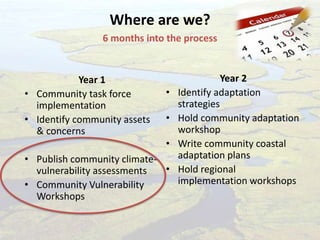
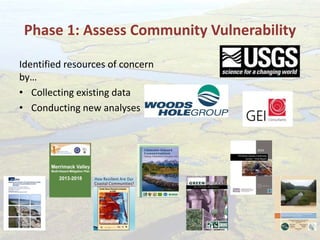
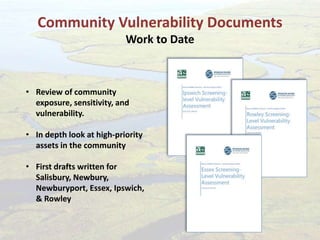
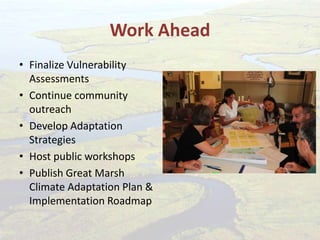
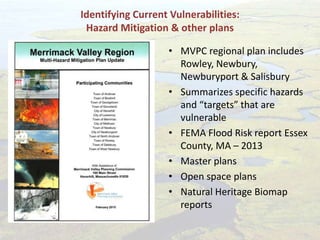
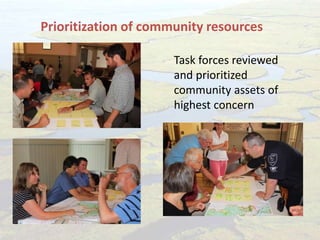
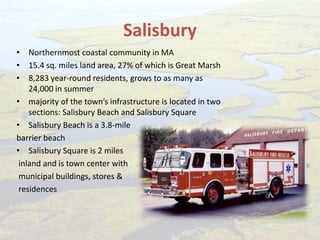
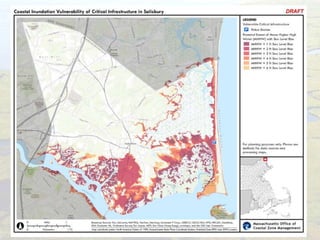
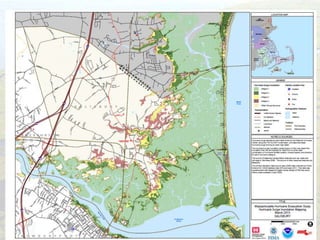
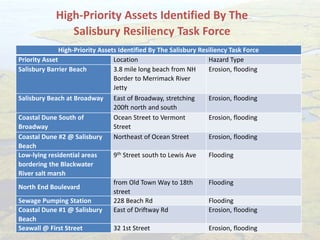
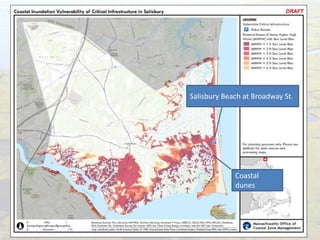
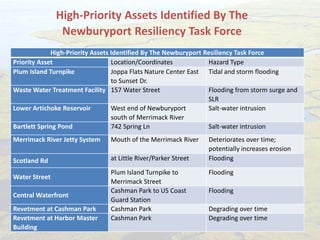
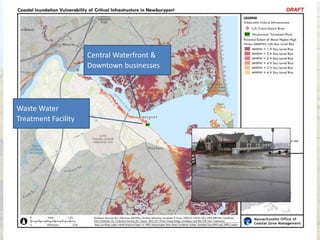
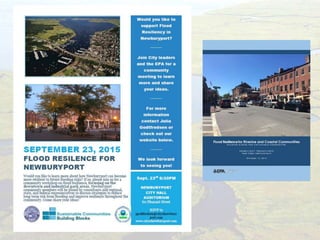
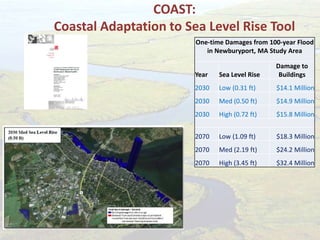
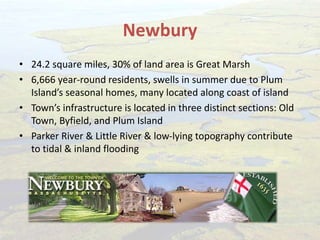
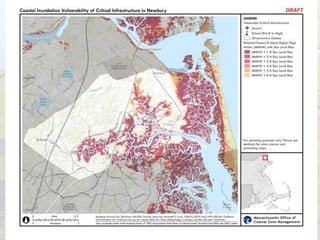
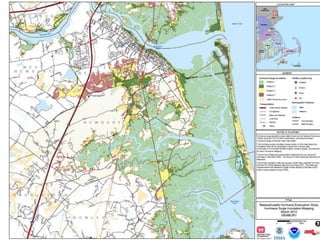
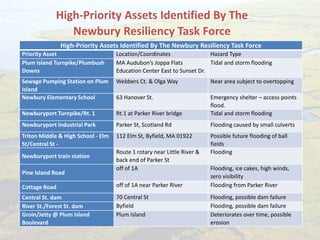
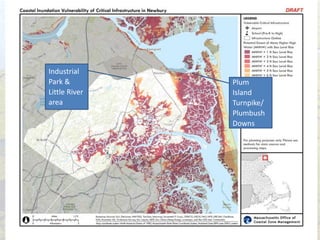
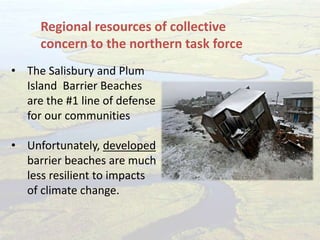
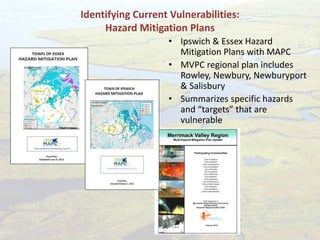
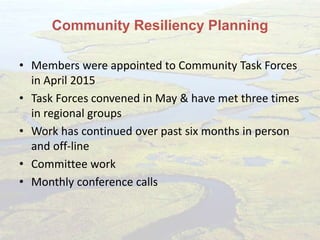
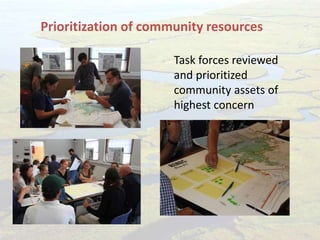
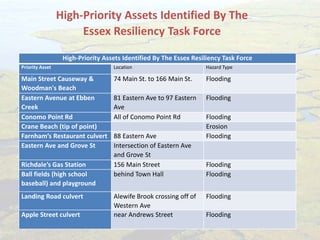
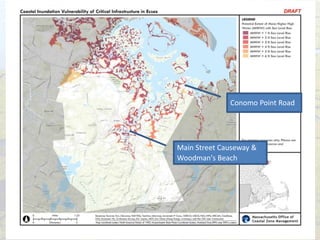
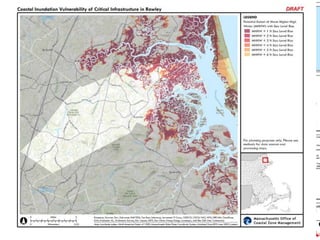
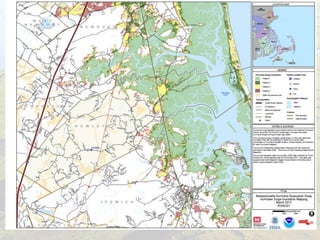
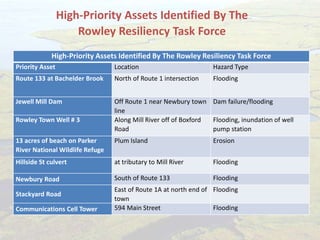
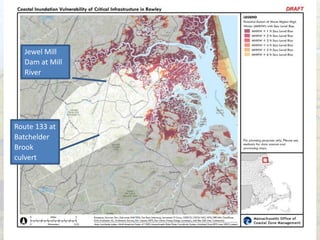
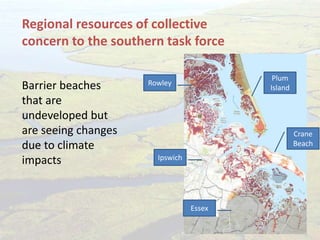
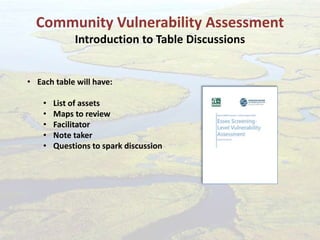
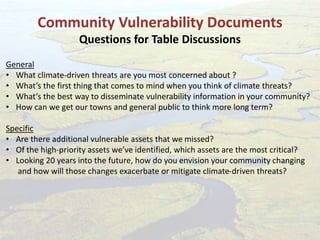
SlideShare a Scribd company logo
1 of 62
Great Marsh Symposium
November 12, 2015
Great Marsh
Coastal Community Resiliency
and Adaptation Planning
Presentation Outline
• The science behind climate-driven threats
• Defining vulnerability
• Overview of the resiliency planning initiative
• Work completed to date
• What lies ahead
• Vulnerability findings for Salisbury, Newbury,
Newburyport
• Vulnerability findings for Essex, Ipswich, and
Rowley
Why Here? Why Now?
Essex Technical High School Report – April 2015
Bigger & More Frequent Storms
Bigger Storms Mean More Precipitation
Overview of the Manomet
Climate Change Adaptation
Project
“Over most regions, precipitation is likely to be
less frequent but more intense, and precipitation
extremes are very likely to increase”
Sea Level Rise
Historical & Longer-term Projections
NewHampshireCoastalRisks
&HazardsCommission
Erosion
Climate Change is the Great Accelerator
Vulnerability =
sensitivity + exposure + adaptive capacity
A resource is
vulnerable if it is
exposed and sensitive
to the effects of
climate change and at
the same time has only
limited capacity to
adapt.
Dept. of Interior Hurricane Sandy
Resiliency Grants Program
“Community Risk Reduction through Comprehensive Community
Resiliency Enhancement for the Great Marsh Ecosystem”
Project Area:
• Salisbury, Newbury, Newburyport, Essex, Ipswich, & Rowley.
Resiliency Planning Objectives:
• Assess overall community vulnerability as well provide focused assessments of
highly vulnerable high-priority community assets through a comprehensive and
integrated approach.
• Identify operationally feasible, site-specific adaptation strategies that serve to
reduce risk.
• Engage communities as we work together to lay a framework for future
implementation of on-the-ground adaptation strategies.
1. Develop community climate vulnerability assessments
2. Conduct comprehensive public outreach & engagement
3. Publish an Adaptation Plan & Implementation Roadmap
Community Resiliency Planning
Tasks To Be Completed
Project components
• Community
Engagement & Planning
• Hazard Vulnerability
and Socio-economic
Impact Assessment
• Marsh Adaptation
Strategy Tool (MAST)
• Coastal Adaptation to
Sea Level Rise Tool
(COAST)
Year 1
• Community task force
implementation
• Identify community assets
& concerns
• Publish community climate-
vulnerability assessments
• Community Vulnerability
Workshops
Year 2
• Identify adaptation
strategies
• Hold community adaptation
workshop
• Write community coastal
adaptation plans
• Hold regional
implementation workshops
Where are we?
6 months into the process
Phase 1: Assess Community Vulnerability
Identified resources of concern
by…
• Collecting existing data
• Conducting new analyses
Community Vulnerability Documents
Work to Date
• Review of community
exposure, sensitivity, and
vulnerability.
• In depth look at high-priority
assets in the community
• First drafts written for
Salisbury, Newbury,
Newburyport, Essex, Ipswich,
& Rowley
Work Ahead
• Finalize Vulnerability
Assessments
• Continue community
outreach
• Develop Adaptation
Strategies
• Host public workshops
• Publish Great Marsh
Climate Adaptation Plan &
Implementation Roadmap
Community Resiliency Task Force
Northern Region
(Salisbury-Newburyport-Newbury)
Great Marsh
Coastal Community Resiliency
and Adaptation Planning
Community Resiliency Planning
• Members were appointed to Community Task Forces
in April 2015
• Task Forces convened in May & have met three times
in regional groups
• Work has continued over past six months in person
and off-line
• Committee work
• Sub-projects (MAST & COAST)
• Monthly conference calls
Identifying Current Vulnerabilities:
Hazard Mitigation & other plans
• MVPC regional plan includes
Rowley, Newbury,
Newburyport & Salisbury
• Summarizes specific hazards
and “targets” that are
vulnerable
• FEMA Flood Risk report Essex
County, MA – 2013
• Master plans
• Open space plans
• Natural Heritage Biomap
reports
Task forces reviewed
and prioritized
community assets of
highest concern
Prioritization of community resources
Salisbury
• Northernmost coastal community in MA
• 15.4 sq. miles land area, 27% of which is Great Marsh
• 8,283 year-round residents, grows to as many as
24,000 in summer
• majority of the town’s infrastructure is located in two
sections: Salisbury Beach and Salisbury Square
• Salisbury Beach is a 3.8-mile
barrier beach
• Salisbury Square is 2 miles
inland and is town center with
municipal buildings, stores &
residences
High-Priority Assets Identified By The
Salisbury Resiliency Task Force
High-Priority Assets Identified By The Salisbury Resiliency Task Force
Priority Asset Location Hazard Type
Salisbury Barrier Beach 3.8 mile long beach from NH
Border to Merrimack River
Jetty
Erosion, flooding
Salisbury Beach at Broadway East of Broadway, stretching
200ft north and south
Erosion, flooding
Coastal Dune South of
Broadway
Ocean Street to Vermont
Street
Erosion, flooding
Coastal Dune #2 @ Salisbury
Beach
Northeast of Ocean Street Erosion, flooding
Low-lying residential areas
bordering the Blackwater
River salt marsh
9th Street south to Lewis Ave Flooding
North End Boulevard
from Old Town Way to 18th
street
Flooding
Sewage Pumping Station 228 Beach Rd Flooding
Coastal Dune #1 @ Salisbury
Beach
East of Driftway Rd Erosion, flooding
Seawall @ First Street 32 1st Street Erosion, flooding
Salisbury Beach at Broadway St.
Coastal
dunes
Newburyport
• Bordered by Merrimack River to north, Newbury to
south
• Includes northern tip of Plum Island
• 17,800 year-round residents
• historic downtown
• waterfront district is
the civic and commercial
center of the city
• Industrial Park along
border with Newbury is
home to approx. 60
industrial businesses
High-Priority Assets Identified By The
Newburyport Resiliency Task Force
High-Priority Assets Identified By The Newburyport Resiliency Task Force
Priority Asset Location/Coordinates Hazard Type
Plum Island Turnpike Joppa Flats Nature Center East
to Sunset Dr.
Tidal and storm flooding
Waste Water Treatment Facility 157 Water Street Flooding from storm surge and
SLR
Lower Artichoke Reservoir West end of Newburyport
south of Merrimack River
Salt-water intrusion
Bartlett Spring Pond 742 Spring Ln Salt-water intrusion
Merrimack River Jetty System Mouth of the Merrimack River Deteriorates over time;
potentially increases erosion
Scotland Rd at Little River/Parker Street Flooding
Water Street
Plum Island Turnpike to
Merrimack Street
Flooding
Central Waterfront
Cashman Park to US Coast
Guard Station
Flooding
Revetment at Cashman Park Cashman Park Degrading over time
Revetment at Harbor Master
Building
Cashman Park Degrading over time
Waste Water
Treatment Facility
Central Waterfront &
Downtown businesses
COAST:
Coastal Adaptation to Sea Level Rise Tool
One-time Damages from 100-year Flood
in Newburyport, MA Study Area
Year Sea Level Rise
Damage to
Buildings
2030 Low (0.31 ft) $14.1 Million
2030 Med (0.50 ft) $14.9 Million
2030 High (0.72 ft) $15.8 Million
2070 Low (1.09 ft) $18.3 Million
2070 Med (2.19 ft) $24.2 Million
2070 High (3.45 ft) $32.4 Million
Newbury
• 24.2 square miles, 30% of land area is Great Marsh
• 6,666 year-round residents, swells in summer due to Plum
Island’s seasonal homes, many located along coast of island
• Town’s infrastructure is located in three distinct sections: Old
Town, Byfield, and Plum Island
• Parker River & Little River & low-lying topography contribute
to tidal & inland flooding
High-Priority Assets Identified By The
Newbury Resiliency Task Force
High-Priority Assets Identified By The Newbury Resiliency Task Force
Priority Asset Location/Coordinates Hazard Type
Plum Island Turnpike/Plumbush
Downs
MA Audubon’s Joppa Flats
Education Center East to Sunset Dr.
Tidal and storm flooding
Sewage Pumping Station on Plum
Island
Webbers Ct. & Olga Way Near area subject to overtopping
Newbury Elementary School 63 Hanover St. Emergency shelter – access points
flood.
Newburyport Turnpike/Rt. 1 Rt.1 at Parker River bridge Tidal and storm flooding
Newburyport Industrial Park Parker St, Scotland Rd Flooding caused by small culverts
Triton Middle & High School - Elm
St/Central St -
112 Elm St, Byfield, MA 01922 Possible future flooding of ball
fields
Newburyport train station
Route 1 rotary near Little River &
back end of Parker St
Flooding
Pine Island Road
off of 1A Flooding, ice cakes, high winds,
zero visibility
Cottage Road off of 1A near Parker River Flooding from Parker River
Central St. dam 70 Central St Flooding, possible dam failure
River St./Forest St. dam Byfield Flooding, possible dam failure
Groin/Jetty @ Plum Island
Boulevard
Plum Island Deteriorates over time, possible
erosion
Plum
Island
Turnpike/
Plumbush
Downs
Industrial
Park &
Little River
area
• The Salisbury and Plum
Island Barrier Beaches
are the #1 line of defense
for our communities
• Unfortunately, developed
barrier beaches are much
less resilient to impacts
of climate change.
Regional resources of collective
concern to the northern task force
Community Resiliency Task Force
Southern Region
(Essex-Ipswich-Rowley)
Great Marsh
Coastal Community Resiliency
and Adaptation Planning
Identifying Current Vulnerabilities:
Hazard Mitigation Plans
• Ipswich & Essex Hazard
Mitigation Plans with MAPC
• MVPC regional plan includes
Rowley, Newbury, Newburyport
& Salisbury
• Summarizes specific hazards
and “targets” that are
vulnerable
Community Resiliency Planning
• Members were appointed to Community Task Forces
in April 2015
• Task Forces convened in May & have met three times
in regional groups
• Work has continued over past six months in person
and off-line
• Committee work
• Monthly conference calls
Task forces reviewed
and prioritized
community assets of
highest concern
Prioritization of community resources
Essex
• 16 sq. miles of which 48%
is forested and 34% is
Great Marsh
• 3504 residents
• Majority of infrastructure
located along Rt 133/
Main St Causeway
spanning salt marsh and
Essex River
• Causeway is a critical
transportation corridor
High-Priority Assets Identified By The
Essex Resiliency Task Force
High-Priority Assets Identified By The Essex Resiliency Task Force
Priority Asset Location Hazard Type
Main Street Causeway &
Woodman's Beach
74 Main St. to 166 Main St. Flooding
Eastern Avenue at Ebben
Creek
81 Eastern Ave to 97 Eastern
Ave
Flooding
Conomo Point Rd All of Conomo Point Rd Flooding
Crane Beach (tip of point) Erosion
Farnham’s Restaurant culvert 88 Eastern Ave Flooding
Eastern Ave and Grove St Intersection of Eastern Ave
and Grove St
Richdale’s Gas Station 156 Main Street Flooding
Ball fields (high school
baseball) and playground
behind Town Hall Flooding
Landing Road culvert Alewife Brook crossing off of
Western Ave
Flooding
Apple Street culvert near Andrews Street Flooding
Main Street Causeway &
Woodman's Beach
Conomo Point Road
Ipswich
• 33 sq. miles, 21% of land
area is Great Marsh
• 13,175 residents
• Dense downtown along
the banks of Ipswich River
house most of town
infrastructure
• Crane Beach is important
community resource for
recreation and tourism
High-Priority Assets Identified By The
Ipswich Resiliency Task Force
High-Priority Assets Identified By The Ipswich Resiliency Task Force
Priority Asset Location/Coordinates Hazard Type
Jeffrey’s Neck Road Beachview Lane northeast
to 144 Jeffrey's Neck Rd
Flooding
Downtown Ipswich Main St businesses and
County Rd near Choate
Bridge
Flooding
Crane Beach End of Argilla Road Erosion
Route 1A at Muddy Run 188 High Street Flooding
South Main Street 45 S Main Street Flooding
Town Wharf + pumping
station
68 East St Flooding
Labor in Vain Road Bridge 80 Labor In vain Road Flooding
Fox Creek Bridge 200 Argilla Road Flooding
Choate Bridge Downtown Flooding
Crane Beach
Town Wharf
& Sewage
Pumping
Station
Rowley
• Rural coastal community of
5856 residents, located
between Newbury and
Ipswich
• 19 sq. miles in size, of which
20% is Great Marsh
• 90% of town is zoned for
residential use; business
development along Route 1
& Route 1A corridors
High-Priority Assets Identified By The
Rowley Resiliency Task Force
High-Priority Assets Identified By The Rowley Resiliency Task Force
Priority Asset Location Hazard Type
Route 133 at Bachelder Brook North of Route 1 intersection Flooding
Jewell Mill Dam Off Route 1 near Newbury town
line
Dam failure/flooding
Rowley Town Well # 3 Along Mill River off of Boxford
Road
Flooding, inundation of well
pump station
13 acres of beach on Parker
River National Wildlife Refuge
Plum Island Erosion
Hillside St culvert at tributary to Mill River Flooding
Newbury Road South of Route 133 Flooding
Stackyard Road
East of Route 1A at north end of
town
Flooding
Communications Cell Tower 594 Main Street Flooding
Jewel Mill
Dam at Mill
River
Route 133 at
Batchelder
Brook
culvert
Barrier beaches
that are
undeveloped but
are seeing changes
due to climate
impacts
Regional resources of collective
concern to the southern task force
Plum
Island
Crane
Beach
Rowley
Ipswich
Essex
Thank You!
Great Marsh Resiliency Partnership
Community Vulnerability Assessment
Introduction to Table Discussions
• Each table will have:
• List of assets
• Maps to review
• Facilitator
• Note taker
• Questions to spark discussion
Community Vulnerability Documents
Questions for Table Discussions
General
• What climate-driven threats are you most concerned about ?
• What’s the first thing that comes to mind when you think of climate threats?
• What’s the best way to disseminate vulnerability information in your community?
• How can we get our towns and general public to think more long term?
Specific
• Are there additional vulnerable assets that we missed?
• Of the high-priority assets we’ve identified, which assets are the most critical?
• Looking 20 years into the future, how do you envision your community changing
and how will those changes exacerbate or mitigate climate-driven threats?
Thank You!
Great Marsh Resiliency Partnership

More Related Content

What's hot

Strategic Interventions of an RCE in Environmental Assessment, RCE Saskatchew...
Strategic Interventions of an RCE in Environmental Assessment, RCE Saskatchew...Strategic Interventions of an RCE in Environmental Assessment, RCE Saskatchew...
Strategic Interventions of an RCE in Environmental Assessment, RCE Saskatchew...Hanna Stahlberg
 
Julia Knisel storm reporter
Julia Knisel storm reporterJulia Knisel storm reporter
Julia Knisel storm reportergreenbelt82
 
May 5 2016 NPS presentation-update on west pond breach repairs
May 5 2016 NPS presentation-update on west pond breach repairsMay 5 2016 NPS presentation-update on west pond breach repairs
May 5 2016 NPS presentation-update on west pond breach repairsecowatchers
 
PPL26 Bayou La Loutre Ridge & Marsh Restoration Nomination Fact Sheet for 1_8_16
PPL26 Bayou La Loutre Ridge & Marsh Restoration Nomination Fact Sheet for 1_8_16PPL26 Bayou La Loutre Ridge & Marsh Restoration Nomination Fact Sheet for 1_8_16
PPL26 Bayou La Loutre Ridge & Marsh Restoration Nomination Fact Sheet for 1_8_16Blaise Pezold
 
Sunset cove phase 2 advocacy
Sunset cove phase 2 advocacySunset cove phase 2 advocacy
Sunset cove phase 2 advocacyecowatchers
 
Peter Phippen Sandy Update - November 2015
Peter Phippen Sandy Update - November 2015Peter Phippen Sandy Update - November 2015
Peter Phippen Sandy Update - November 2015greenbelt82
 
Losing Ground: Methods for Leeville
Losing Ground: Methods for LeevilleLosing Ground: Methods for Leeville
Losing Ground: Methods for Leevillearch7004
 
Dep head of bay oyster project jam bay task force fall 2017 update
Dep head of bay oyster project jam bay task force fall 2017 updateDep head of bay oyster project jam bay task force fall 2017 update
Dep head of bay oyster project jam bay task force fall 2017 updateecowatchers
 
Responses to Public Comments About Beach Restoration at Quogue
Responses to Public Comments About Beach Restoration at QuogueResponses to Public Comments About Beach Restoration at Quogue
Responses to Public Comments About Beach Restoration at QuogueQuogueBeaches
 
Holderness coast
Holderness coastHolderness coast
Holderness coastMrOHanlon
 
Green Hollow Court Outfall Restoration
Green Hollow Court Outfall RestorationGreen Hollow Court Outfall Restoration
Green Hollow Court Outfall RestorationFairfax County
 
Crestleigh Way Outfall Restoration
Crestleigh Way Outfall RestorationCrestleigh Way Outfall Restoration
Crestleigh Way Outfall RestorationFairfax County
 
Black wall rulers bar presentation final
Black wall rulers bar presentation finalBlack wall rulers bar presentation final
Black wall rulers bar presentation finalecowatchers
 

What's hot (20)

Strategic Interventions of an RCE in Environmental Assessment, RCE Saskatchew...
Strategic Interventions of an RCE in Environmental Assessment, RCE Saskatchew...Strategic Interventions of an RCE in Environmental Assessment, RCE Saskatchew...
Strategic Interventions of an RCE in Environmental Assessment, RCE Saskatchew...
 
Stream rehabilitation seminar june 11 2014
Stream rehabilitation seminar june 11 2014Stream rehabilitation seminar june 11 2014
Stream rehabilitation seminar june 11 2014
 
Julia Knisel storm reporter
Julia Knisel storm reporterJulia Knisel storm reporter
Julia Knisel storm reporter
 
Making Connections Across Our Watersheds
Making Connections Across Our WatershedsMaking Connections Across Our Watersheds
Making Connections Across Our Watersheds
 
May 5 2016 NPS presentation-update on west pond breach repairs
May 5 2016 NPS presentation-update on west pond breach repairsMay 5 2016 NPS presentation-update on west pond breach repairs
May 5 2016 NPS presentation-update on west pond breach repairs
 
PPL26 Bayou La Loutre Ridge & Marsh Restoration Nomination Fact Sheet for 1_8_16
PPL26 Bayou La Loutre Ridge & Marsh Restoration Nomination Fact Sheet for 1_8_16PPL26 Bayou La Loutre Ridge & Marsh Restoration Nomination Fact Sheet for 1_8_16
PPL26 Bayou La Loutre Ridge & Marsh Restoration Nomination Fact Sheet for 1_8_16
 
Sunset cove phase 2 advocacy
Sunset cove phase 2 advocacySunset cove phase 2 advocacy
Sunset cove phase 2 advocacy
 
Peter Phippen Sandy Update - November 2015
Peter Phippen Sandy Update - November 2015Peter Phippen Sandy Update - November 2015
Peter Phippen Sandy Update - November 2015
 
Losing Ground: Methods for Leeville
Losing Ground: Methods for LeevilleLosing Ground: Methods for Leeville
Losing Ground: Methods for Leeville
 
Insera elj's on the nooksack victor insera
Insera  elj's on the nooksack victor inseraInsera  elj's on the nooksack victor insera
Insera elj's on the nooksack victor insera
 
Rap presentation yc 28,3, 2013
Rap presentation yc 28,3, 2013Rap presentation yc 28,3, 2013
Rap presentation yc 28,3, 2013
 
Dep head of bay oyster project jam bay task force fall 2017 update
Dep head of bay oyster project jam bay task force fall 2017 updateDep head of bay oyster project jam bay task force fall 2017 update
Dep head of bay oyster project jam bay task force fall 2017 update
 
Responses to Public Comments About Beach Restoration at Quogue
Responses to Public Comments About Beach Restoration at QuogueResponses to Public Comments About Beach Restoration at Quogue
Responses to Public Comments About Beach Restoration at Quogue
 
Holderness coast
Holderness coastHolderness coast
Holderness coast
 
Green Hollow Court Outfall Restoration
Green Hollow Court Outfall RestorationGreen Hollow Court Outfall Restoration
Green Hollow Court Outfall Restoration
 
Crestleigh Way Outfall Restoration
Crestleigh Way Outfall RestorationCrestleigh Way Outfall Restoration
Crestleigh Way Outfall Restoration
 
Muskegon Lake Restoration: A Success Story
Muskegon Lake Restoration: A Success StoryMuskegon Lake Restoration: A Success Story
Muskegon Lake Restoration: A Success Story
 
Presentation 3: Impact Assessment Findings
Presentation 3: Impact Assessment FindingsPresentation 3: Impact Assessment Findings
Presentation 3: Impact Assessment Findings
 
Black wall rulers bar presentation final
Black wall rulers bar presentation finalBlack wall rulers bar presentation final
Black wall rulers bar presentation final
 
Pnacp687
Pnacp687Pnacp687
Pnacp687
 

Similar to Great Marsh Coastal Resiliency Planning

Barbara warren mas 2017 DALR
Barbara warren mas 2017 DALRBarbara warren mas 2017 DALR
Barbara warren mas 2017 DALRGWT
 
Sustainability East - East of England Climate Change Adaptation
Sustainability East - East of England Climate Change AdaptationSustainability East - East of England Climate Change Adaptation
Sustainability East - East of England Climate Change AdaptationSustainability East
 
Sage may 18 2017 bennett webinarfinal
Sage may 18 2017 bennett webinarfinalSage may 18 2017 bennett webinarfinal
Sage may 18 2017 bennett webinarfinalRick Bennett
 
Rccas presentation gm 11_14_13sm
Rccas presentation gm 11_14_13smRccas presentation gm 11_14_13sm
Rccas presentation gm 11_14_13smgreenbelt82
 
Duke Bitsko - Alewife Stormwater Wetland
Duke Bitsko - Alewife Stormwater WetlandDuke Bitsko - Alewife Stormwater Wetland
Duke Bitsko - Alewife Stormwater Wetlandbio4climate
 
Coastal Wetland Adaptation Strategies
Coastal Wetland Adaptation StrategiesCoastal Wetland Adaptation Strategies
Coastal Wetland Adaptation Strategiesriseagrant
 
WAMM North East Regional Workshop York 29 Jan 2020
WAMM North East Regional Workshop York 29 Jan 2020WAMM North East Regional Workshop York 29 Jan 2020
WAMM North East Regional Workshop York 29 Jan 2020CaBASupport
 
Restoring Westmeadows Meander
Restoring Westmeadows MeanderRestoring Westmeadows Meander
Restoring Westmeadows MeanderTony Smith
 
Somerset levels flood final
Somerset levels flood finalSomerset levels flood final
Somerset levels flood finalclemaitre
 
Sustainable approaches to coastal design and adaption to sea level rise
Sustainable approaches to coastal design and adaption to sea level riseSustainable approaches to coastal design and adaption to sea level rise
Sustainable approaches to coastal design and adaption to sea level rise Shannon Cunniff
 
Helping people, economies & the environment thrive
Helping people, economies & the environment thriveHelping people, economies & the environment thrive
Helping people, economies & the environment thriveShannon Cunniff
 
Beach samp stakeholder_tools_071415
Beach samp stakeholder_tools_071415Beach samp stakeholder_tools_071415
Beach samp stakeholder_tools_071415riseagrant
 
Coastal landscapes
Coastal landscapesCoastal landscapes
Coastal landscapesScott Handy
 
Phippen castonguay gmrp gmc slr symposium 2
Phippen castonguay gmrp gmc slr symposium 2Phippen castonguay gmrp gmc slr symposium 2
Phippen castonguay gmrp gmc slr symposium 2greenbelt82
 
004 Future Coastal Flood and Erosion Risk Management Schemes at Southsea and ...
004 Future Coastal Flood and Erosion Risk Management Schemes at Southsea and ...004 Future Coastal Flood and Erosion Risk Management Schemes at Southsea and ...
004 Future Coastal Flood and Erosion Risk Management Schemes at Southsea and ...djhutch
 
Healthy Coastal Ecosystems
Healthy Coastal EcosystemsHealthy Coastal Ecosystems
Healthy Coastal EcosystemsOregon Sea Grant
 
Rob Thieler, Changing Climate, Changing Coasts
Rob Thieler, Changing Climate, Changing CoastsRob Thieler, Changing Climate, Changing Coasts
Rob Thieler, Changing Climate, Changing Coastsriseagrant
 

Similar to Great Marsh Coastal Resiliency Planning (20)

Coastal Management
Coastal ManagementCoastal Management
Coastal Management
 
The Shifting Sands of Noosa
The Shifting Sands of Noosa The Shifting Sands of Noosa
The Shifting Sands of Noosa
 
Barbara warren mas 2017 DALR
Barbara warren mas 2017 DALRBarbara warren mas 2017 DALR
Barbara warren mas 2017 DALR
 
Sustainability East - East of England Climate Change Adaptation
Sustainability East - East of England Climate Change AdaptationSustainability East - East of England Climate Change Adaptation
Sustainability East - East of England Climate Change Adaptation
 
Sage may 18 2017 bennett webinarfinal
Sage may 18 2017 bennett webinarfinalSage may 18 2017 bennett webinarfinal
Sage may 18 2017 bennett webinarfinal
 
Rccas presentation gm 11_14_13sm
Rccas presentation gm 11_14_13smRccas presentation gm 11_14_13sm
Rccas presentation gm 11_14_13sm
 
Duke Bitsko - Alewife Stormwater Wetland
Duke Bitsko - Alewife Stormwater WetlandDuke Bitsko - Alewife Stormwater Wetland
Duke Bitsko - Alewife Stormwater Wetland
 
Coastal Wetland Adaptation Strategies
Coastal Wetland Adaptation StrategiesCoastal Wetland Adaptation Strategies
Coastal Wetland Adaptation Strategies
 
WAMM North East Regional Workshop York 29 Jan 2020
WAMM North East Regional Workshop York 29 Jan 2020WAMM North East Regional Workshop York 29 Jan 2020
WAMM North East Regional Workshop York 29 Jan 2020
 
Restoring Westmeadows Meander
Restoring Westmeadows MeanderRestoring Westmeadows Meander
Restoring Westmeadows Meander
 
Vinalhaven, Maine Resilience Strategy
Vinalhaven, Maine Resilience StrategyVinalhaven, Maine Resilience Strategy
Vinalhaven, Maine Resilience Strategy
 
Somerset levels flood final
Somerset levels flood finalSomerset levels flood final
Somerset levels flood final
 
Sustainable approaches to coastal design and adaption to sea level rise
Sustainable approaches to coastal design and adaption to sea level riseSustainable approaches to coastal design and adaption to sea level rise
Sustainable approaches to coastal design and adaption to sea level rise
 
Helping people, economies & the environment thrive
Helping people, economies & the environment thriveHelping people, economies & the environment thrive
Helping people, economies & the environment thrive
 
Beach samp stakeholder_tools_071415
Beach samp stakeholder_tools_071415Beach samp stakeholder_tools_071415
Beach samp stakeholder_tools_071415
 
Coastal landscapes
Coastal landscapesCoastal landscapes
Coastal landscapes
 
Phippen castonguay gmrp gmc slr symposium 2
Phippen castonguay gmrp gmc slr symposium 2Phippen castonguay gmrp gmc slr symposium 2
Phippen castonguay gmrp gmc slr symposium 2
 
004 Future Coastal Flood and Erosion Risk Management Schemes at Southsea and ...
004 Future Coastal Flood and Erosion Risk Management Schemes at Southsea and ...004 Future Coastal Flood and Erosion Risk Management Schemes at Southsea and ...
004 Future Coastal Flood and Erosion Risk Management Schemes at Southsea and ...
 
Healthy Coastal Ecosystems
Healthy Coastal EcosystemsHealthy Coastal Ecosystems
Healthy Coastal Ecosystems
 
Rob Thieler, Changing Climate, Changing Coasts
Rob Thieler, Changing Climate, Changing CoastsRob Thieler, Changing Climate, Changing Coasts
Rob Thieler, Changing Climate, Changing Coasts
 

More from greenbelt82

Traditional Uses of The Great Marsh, Geoff Walker, Selectman, Town of Newbury
Traditional Uses of The Great Marsh, Geoff Walker, Selectman, Town of NewburyTraditional Uses of The Great Marsh, Geoff Walker, Selectman, Town of Newbury
Traditional Uses of The Great Marsh, Geoff Walker, Selectman, Town of Newburygreenbelt82
 
Creative Great Marsh Susan Quateman, SQ & LB Artists Collaborative
Creative Great Marsh Susan Quateman, SQ & LB Artists CollaborativeCreative Great Marsh Susan Quateman, SQ & LB Artists Collaborative
Creative Great Marsh Susan Quateman, SQ & LB Artists Collaborativegreenbelt82
 
Fish and Fisheries of The Great Marsh David Rimmer, Essex County Greenbelt As...
Fish and Fisheries of The Great Marsh David Rimmer, Essex County Greenbelt As...Fish and Fisheries of The Great Marsh David Rimmer, Essex County Greenbelt As...
Fish and Fisheries of The Great Marsh David Rimmer, Essex County Greenbelt As...greenbelt82
 
Birds & Birding in The Great Marsh, Chris Leahy, Mass Audubon
Birds & Birding in The Great Marsh, Chris Leahy, Mass AudubonBirds & Birding in The Great Marsh, Chris Leahy, Mass Audubon
Birds & Birding in The Great Marsh, Chris Leahy, Mass Audubongreenbelt82
 
Native Americans and The Great Marsh
Native Americans and The Great MarshNative Americans and The Great Marsh
Native Americans and The Great Marshgreenbelt82
 
Tourism & Recreation in The Great Marsh
Tourism & Recreation in The Great MarshTourism & Recreation in The Great Marsh
Tourism & Recreation in The Great Marshgreenbelt82
 
Citizen Engagement in The Great Marsh
Citizen Engagement in The Great MarshCitizen Engagement in The Great Marsh
Citizen Engagement in The Great Marshgreenbelt82
 
Shellfish Industry and the Fried Clam
Shellfish Industry and the Fried ClamShellfish Industry and the Fried Clam
Shellfish Industry and the Fried Clamgreenbelt82
 
Resilient Taunton Watershed Network: Shaping the Future of Your Community
Resilient Taunton Watershed Network: Shaping the Future of Your CommunityResilient Taunton Watershed Network: Shaping the Future of Your Community
Resilient Taunton Watershed Network: Shaping the Future of Your Communitygreenbelt82
 
NH Coastal Adaptation Working Group: Assisting NH’s Coastal Communities
NH Coastal Adaptation Working Group: Assisting NH’s Coastal CommunitiesNH Coastal Adaptation Working Group: Assisting NH’s Coastal Communities
NH Coastal Adaptation Working Group: Assisting NH’s Coastal Communitiesgreenbelt82
 
Melissa Gaydos Merriam
Melissa Gaydos MerriamMelissa Gaydos Merriam
Melissa Gaydos Merriamgreenbelt82
 
Golf of Maine Great Marsh Presentation
Golf of Maine Great Marsh PresentationGolf of Maine Great Marsh Presentation
Golf of Maine Great Marsh Presentationgreenbelt82
 
Regional Solutions: How a Resilient Great Marsh is our Number One Defense
Regional Solutions: How a Resilient Great Marsh is our Number One DefenseRegional Solutions: How a Resilient Great Marsh is our Number One Defense
Regional Solutions: How a Resilient Great Marsh is our Number One Defensegreenbelt82
 
Christopher Hilke, Great Marsh Climate Adaptation Plan
Christopher Hilke, Great Marsh Climate Adaptation Plan Christopher Hilke, Great Marsh Climate Adaptation Plan
Christopher Hilke, Great Marsh Climate Adaptation Plan greenbelt82
 
Keynote Presentation: Climate Adaptation Planning in Massachusetts.
Keynote Presentation: Climate Adaptation Planning in Massachusetts. Keynote Presentation: Climate Adaptation Planning in Massachusetts.
Keynote Presentation: Climate Adaptation Planning in Massachusetts. greenbelt82
 
GM Symposium 2016: Nate Wood, Research Geographer, USGS
GM Symposium 2016: Nate Wood, Research Geographer, USGSGM Symposium 2016: Nate Wood, Research Geographer, USGS
GM Symposium 2016: Nate Wood, Research Geographer, USGSgreenbelt82
 
Great Marsh Symposium 2016_ NWF
Great Marsh Symposium 2016_ NWFGreat Marsh Symposium 2016_ NWF
Great Marsh Symposium 2016_ NWFgreenbelt82
 
Tonna-Marie Rogers: Great Marsh Symposium
Tonna-Marie Rogers: Great Marsh SymposiumTonna-Marie Rogers: Great Marsh Symposium
Tonna-Marie Rogers: Great Marsh Symposiumgreenbelt82
 
Greg Cademartori Great Marsh Symposium
Greg Cademartori Great Marsh SymposiumGreg Cademartori Great Marsh Symposium
Greg Cademartori Great Marsh Symposiumgreenbelt82
 
Cynthia McHale Great Marsh Syposium: November 2015
Cynthia McHale Great Marsh Syposium: November 2015Cynthia McHale Great Marsh Syposium: November 2015
Cynthia McHale Great Marsh Syposium: November 2015greenbelt82
 

More from greenbelt82 (20)

Traditional Uses of The Great Marsh, Geoff Walker, Selectman, Town of Newbury
Traditional Uses of The Great Marsh, Geoff Walker, Selectman, Town of NewburyTraditional Uses of The Great Marsh, Geoff Walker, Selectman, Town of Newbury
Traditional Uses of The Great Marsh, Geoff Walker, Selectman, Town of Newbury
 
Creative Great Marsh Susan Quateman, SQ & LB Artists Collaborative
Creative Great Marsh Susan Quateman, SQ & LB Artists CollaborativeCreative Great Marsh Susan Quateman, SQ & LB Artists Collaborative
Creative Great Marsh Susan Quateman, SQ & LB Artists Collaborative
 
Fish and Fisheries of The Great Marsh David Rimmer, Essex County Greenbelt As...
Fish and Fisheries of The Great Marsh David Rimmer, Essex County Greenbelt As...Fish and Fisheries of The Great Marsh David Rimmer, Essex County Greenbelt As...
Fish and Fisheries of The Great Marsh David Rimmer, Essex County Greenbelt As...
 
Birds & Birding in The Great Marsh, Chris Leahy, Mass Audubon
Birds & Birding in The Great Marsh, Chris Leahy, Mass AudubonBirds & Birding in The Great Marsh, Chris Leahy, Mass Audubon
Birds & Birding in The Great Marsh, Chris Leahy, Mass Audubon
 
Native Americans and The Great Marsh
Native Americans and The Great MarshNative Americans and The Great Marsh
Native Americans and The Great Marsh
 
Tourism & Recreation in The Great Marsh
Tourism & Recreation in The Great MarshTourism & Recreation in The Great Marsh
Tourism & Recreation in The Great Marsh
 
Citizen Engagement in The Great Marsh
Citizen Engagement in The Great MarshCitizen Engagement in The Great Marsh
Citizen Engagement in The Great Marsh
 
Shellfish Industry and the Fried Clam
Shellfish Industry and the Fried ClamShellfish Industry and the Fried Clam
Shellfish Industry and the Fried Clam
 
Resilient Taunton Watershed Network: Shaping the Future of Your Community
Resilient Taunton Watershed Network: Shaping the Future of Your CommunityResilient Taunton Watershed Network: Shaping the Future of Your Community
Resilient Taunton Watershed Network: Shaping the Future of Your Community
 
NH Coastal Adaptation Working Group: Assisting NH’s Coastal Communities
NH Coastal Adaptation Working Group: Assisting NH’s Coastal CommunitiesNH Coastal Adaptation Working Group: Assisting NH’s Coastal Communities
NH Coastal Adaptation Working Group: Assisting NH’s Coastal Communities
 
Melissa Gaydos Merriam
Melissa Gaydos MerriamMelissa Gaydos Merriam
Melissa Gaydos Merriam
 
Golf of Maine Great Marsh Presentation
Golf of Maine Great Marsh PresentationGolf of Maine Great Marsh Presentation
Golf of Maine Great Marsh Presentation
 
Regional Solutions: How a Resilient Great Marsh is our Number One Defense
Regional Solutions: How a Resilient Great Marsh is our Number One DefenseRegional Solutions: How a Resilient Great Marsh is our Number One Defense
Regional Solutions: How a Resilient Great Marsh is our Number One Defense
 
Christopher Hilke, Great Marsh Climate Adaptation Plan
Christopher Hilke, Great Marsh Climate Adaptation Plan Christopher Hilke, Great Marsh Climate Adaptation Plan
Christopher Hilke, Great Marsh Climate Adaptation Plan
 
Keynote Presentation: Climate Adaptation Planning in Massachusetts.
Keynote Presentation: Climate Adaptation Planning in Massachusetts. Keynote Presentation: Climate Adaptation Planning in Massachusetts.
Keynote Presentation: Climate Adaptation Planning in Massachusetts.
 
GM Symposium 2016: Nate Wood, Research Geographer, USGS
GM Symposium 2016: Nate Wood, Research Geographer, USGSGM Symposium 2016: Nate Wood, Research Geographer, USGS
GM Symposium 2016: Nate Wood, Research Geographer, USGS
 
Great Marsh Symposium 2016_ NWF
Great Marsh Symposium 2016_ NWFGreat Marsh Symposium 2016_ NWF
Great Marsh Symposium 2016_ NWF
 
Tonna-Marie Rogers: Great Marsh Symposium
Tonna-Marie Rogers: Great Marsh SymposiumTonna-Marie Rogers: Great Marsh Symposium
Tonna-Marie Rogers: Great Marsh Symposium
 
Greg Cademartori Great Marsh Symposium
Greg Cademartori Great Marsh SymposiumGreg Cademartori Great Marsh Symposium
Greg Cademartori Great Marsh Symposium
 
Cynthia McHale Great Marsh Syposium: November 2015
Cynthia McHale Great Marsh Syposium: November 2015Cynthia McHale Great Marsh Syposium: November 2015
Cynthia McHale Great Marsh Syposium: November 2015
 

Recently uploaded

Soil pollution causes effects remedial measures
Soil pollution causes effects remedial measuresSoil pollution causes effects remedial measures
Soil pollution causes effects remedial measuresvasubhanot1234
 
webinaire-green-mirror-episode-2-Smart contracts and virtual purchase agreeme...
webinaire-green-mirror-episode-2-Smart contracts and virtual purchase agreeme...webinaire-green-mirror-episode-2-Smart contracts and virtual purchase agreeme...
webinaire-green-mirror-episode-2-Smart contracts and virtual purchase agreeme...Cluster TWEED
 
9873940964 High Profile Call Girls Delhi |Defence Colony ( MAYA CHOPRA ) DE...
9873940964 High Profile  Call Girls  Delhi |Defence Colony ( MAYA CHOPRA ) DE...9873940964 High Profile  Call Girls  Delhi |Defence Colony ( MAYA CHOPRA ) DE...
9873940964 High Profile Call Girls Delhi |Defence Colony ( MAYA CHOPRA ) DE...Delhi Escorts
 
Russian Call Girls Nashik Anjali 7001305949 Independent Escort Service Nashik
Russian Call Girls Nashik Anjali 7001305949 Independent Escort Service NashikRussian Call Girls Nashik Anjali 7001305949 Independent Escort Service Nashik
Russian Call Girls Nashik Anjali 7001305949 Independent Escort Service Nashikranjana rawat
 
Sustainable Clothing Strategies and Challenges
Sustainable Clothing Strategies and ChallengesSustainable Clothing Strategies and Challenges
Sustainable Clothing Strategies and ChallengesDr. Salem Baidas
 
NO1 Famous Kala Jadu specialist Expert in Pakistan kala ilam specialist Exper...
NO1 Famous Kala Jadu specialist Expert in Pakistan kala ilam specialist Exper...NO1 Famous Kala Jadu specialist Expert in Pakistan kala ilam specialist Exper...
NO1 Famous Kala Jadu specialist Expert in Pakistan kala ilam specialist Exper...Amil baba
 
(AISHA) Wagholi Call Girls Just Call 7001035870 [ Cash on Delivery ] Pune Esc...
(AISHA) Wagholi Call Girls Just Call 7001035870 [ Cash on Delivery ] Pune Esc...(AISHA) Wagholi Call Girls Just Call 7001035870 [ Cash on Delivery ] Pune Esc...
(AISHA) Wagholi Call Girls Just Call 7001035870 [ Cash on Delivery ] Pune Esc...ranjana rawat
 
Abu Dhabi Sea Beach Visitor Community pp
Abu Dhabi Sea Beach Visitor Community ppAbu Dhabi Sea Beach Visitor Community pp
Abu Dhabi Sea Beach Visitor Community pp202215407
 
(PARI) Viman Nagar Call Girls Just Call 7001035870 [ Cash on Delivery ] Pune ...
(PARI) Viman Nagar Call Girls Just Call 7001035870 [ Cash on Delivery ] Pune ...(PARI) Viman Nagar Call Girls Just Call 7001035870 [ Cash on Delivery ] Pune ...
(PARI) Viman Nagar Call Girls Just Call 7001035870 [ Cash on Delivery ] Pune ...ranjana rawat
 
ENVIRONMENTAL LAW ppt on laws of environmental law
ENVIRONMENTAL LAW ppt on laws of environmental lawENVIRONMENTAL LAW ppt on laws of environmental law
ENVIRONMENTAL LAW ppt on laws of environmental lawnitinraj1000000
 
VIP Call Girl Gorakhpur Aashi 8250192130 Independent Escort Service Gorakhpur
VIP Call Girl Gorakhpur Aashi 8250192130 Independent Escort Service GorakhpurVIP Call Girl Gorakhpur Aashi 8250192130 Independent Escort Service Gorakhpur
VIP Call Girl Gorakhpur Aashi 8250192130 Independent Escort Service GorakhpurSuhani Kapoor
 
Hi FI Call Girl Ahmedabad 7397865700 Independent Call Girls
Hi FI Call Girl Ahmedabad 7397865700 Independent Call GirlsHi FI Call Girl Ahmedabad 7397865700 Independent Call Girls
Hi FI Call Girl Ahmedabad 7397865700 Independent Call Girlsssuser7cb4ff
 
VIP Call Girls Service Bandlaguda Hyderabad Call +91-8250192130
VIP Call Girls Service Bandlaguda Hyderabad Call +91-8250192130VIP Call Girls Service Bandlaguda Hyderabad Call +91-8250192130
VIP Call Girls Service Bandlaguda Hyderabad Call +91-8250192130Suhani Kapoor
 
VIP Call Girls Ramanthapur ( Hyderabad ) Phone 8250192130 | ₹5k To 25k With R...
VIP Call Girls Ramanthapur ( Hyderabad ) Phone 8250192130 | ₹5k To 25k With R...VIP Call Girls Ramanthapur ( Hyderabad ) Phone 8250192130 | ₹5k To 25k With R...
VIP Call Girls Ramanthapur ( Hyderabad ) Phone 8250192130 | ₹5k To 25k With R...Suhani Kapoor
 
See How do animals kill their prey for food
See How do animals kill their prey for foodSee How do animals kill their prey for food
See How do animals kill their prey for fooddrsk203
 

Recently uploaded (20)

Soil pollution causes effects remedial measures
Soil pollution causes effects remedial measuresSoil pollution causes effects remedial measures
Soil pollution causes effects remedial measures
 
webinaire-green-mirror-episode-2-Smart contracts and virtual purchase agreeme...
webinaire-green-mirror-episode-2-Smart contracts and virtual purchase agreeme...webinaire-green-mirror-episode-2-Smart contracts and virtual purchase agreeme...
webinaire-green-mirror-episode-2-Smart contracts and virtual purchase agreeme...
 
9873940964 High Profile Call Girls Delhi |Defence Colony ( MAYA CHOPRA ) DE...
9873940964 High Profile  Call Girls  Delhi |Defence Colony ( MAYA CHOPRA ) DE...9873940964 High Profile  Call Girls  Delhi |Defence Colony ( MAYA CHOPRA ) DE...
9873940964 High Profile Call Girls Delhi |Defence Colony ( MAYA CHOPRA ) DE...
 
Russian Call Girls Nashik Anjali 7001305949 Independent Escort Service Nashik
Russian Call Girls Nashik Anjali 7001305949 Independent Escort Service NashikRussian Call Girls Nashik Anjali 7001305949 Independent Escort Service Nashik
Russian Call Girls Nashik Anjali 7001305949 Independent Escort Service Nashik
 
Sustainable Clothing Strategies and Challenges
Sustainable Clothing Strategies and ChallengesSustainable Clothing Strategies and Challenges
Sustainable Clothing Strategies and Challenges
 
NO1 Famous Kala Jadu specialist Expert in Pakistan kala ilam specialist Exper...
NO1 Famous Kala Jadu specialist Expert in Pakistan kala ilam specialist Exper...NO1 Famous Kala Jadu specialist Expert in Pakistan kala ilam specialist Exper...
NO1 Famous Kala Jadu specialist Expert in Pakistan kala ilam specialist Exper...
 
(AISHA) Wagholi Call Girls Just Call 7001035870 [ Cash on Delivery ] Pune Esc...
(AISHA) Wagholi Call Girls Just Call 7001035870 [ Cash on Delivery ] Pune Esc...(AISHA) Wagholi Call Girls Just Call 7001035870 [ Cash on Delivery ] Pune Esc...
(AISHA) Wagholi Call Girls Just Call 7001035870 [ Cash on Delivery ] Pune Esc...
 
Abu Dhabi Sea Beach Visitor Community pp
Abu Dhabi Sea Beach Visitor Community ppAbu Dhabi Sea Beach Visitor Community pp
Abu Dhabi Sea Beach Visitor Community pp
 
(PARI) Viman Nagar Call Girls Just Call 7001035870 [ Cash on Delivery ] Pune ...
(PARI) Viman Nagar Call Girls Just Call 7001035870 [ Cash on Delivery ] Pune ...(PARI) Viman Nagar Call Girls Just Call 7001035870 [ Cash on Delivery ] Pune ...
(PARI) Viman Nagar Call Girls Just Call 7001035870 [ Cash on Delivery ] Pune ...
 
ENVIRONMENTAL LAW ppt on laws of environmental law
ENVIRONMENTAL LAW ppt on laws of environmental lawENVIRONMENTAL LAW ppt on laws of environmental law
ENVIRONMENTAL LAW ppt on laws of environmental law
 
Model Call Girl in Rajiv Chowk Delhi reach out to us at 🔝9953056974🔝
Model Call Girl in Rajiv Chowk Delhi reach out to us at 🔝9953056974🔝Model Call Girl in Rajiv Chowk Delhi reach out to us at 🔝9953056974🔝
Model Call Girl in Rajiv Chowk Delhi reach out to us at 🔝9953056974🔝
 
Gandhi Nagar (Delhi) 9953330565 Escorts, Call Girls Services
Gandhi Nagar (Delhi) 9953330565 Escorts, Call Girls ServicesGandhi Nagar (Delhi) 9953330565 Escorts, Call Girls Services
Gandhi Nagar (Delhi) 9953330565 Escorts, Call Girls Services
 
VIP Call Girl Gorakhpur Aashi 8250192130 Independent Escort Service Gorakhpur
VIP Call Girl Gorakhpur Aashi 8250192130 Independent Escort Service GorakhpurVIP Call Girl Gorakhpur Aashi 8250192130 Independent Escort Service Gorakhpur
VIP Call Girl Gorakhpur Aashi 8250192130 Independent Escort Service Gorakhpur
 
Hi FI Call Girl Ahmedabad 7397865700 Independent Call Girls
Hi FI Call Girl Ahmedabad 7397865700 Independent Call GirlsHi FI Call Girl Ahmedabad 7397865700 Independent Call Girls
Hi FI Call Girl Ahmedabad 7397865700 Independent Call Girls
 
Call Girls In Dhaula Kuan꧁❤ 🔝 9953056974🔝❤꧂ Escort ServiCe
Call Girls In Dhaula Kuan꧁❤ 🔝 9953056974🔝❤꧂ Escort ServiCeCall Girls In Dhaula Kuan꧁❤ 🔝 9953056974🔝❤꧂ Escort ServiCe
Call Girls In Dhaula Kuan꧁❤ 🔝 9953056974🔝❤꧂ Escort ServiCe
 
VIP Call Girls Service Bandlaguda Hyderabad Call +91-8250192130
VIP Call Girls Service Bandlaguda Hyderabad Call +91-8250192130VIP Call Girls Service Bandlaguda Hyderabad Call +91-8250192130
VIP Call Girls Service Bandlaguda Hyderabad Call +91-8250192130
 
VIP Call Girls Ramanthapur ( Hyderabad ) Phone 8250192130 | ₹5k To 25k With R...
VIP Call Girls Ramanthapur ( Hyderabad ) Phone 8250192130 | ₹5k To 25k With R...VIP Call Girls Ramanthapur ( Hyderabad ) Phone 8250192130 | ₹5k To 25k With R...
VIP Call Girls Ramanthapur ( Hyderabad ) Phone 8250192130 | ₹5k To 25k With R...
 
See How do animals kill their prey for food
See How do animals kill their prey for foodSee How do animals kill their prey for food
See How do animals kill their prey for food
 
Call Girls In R.K. Puram 9953056974 Escorts ServiCe In Delhi Ncr
Call Girls In R.K. Puram 9953056974 Escorts ServiCe In Delhi NcrCall Girls In R.K. Puram 9953056974 Escorts ServiCe In Delhi Ncr
Call Girls In R.K. Puram 9953056974 Escorts ServiCe In Delhi Ncr
 
Sexy Call Girls Patel Nagar New Delhi +918448380779 Call Girls Service in Del...
Sexy Call Girls Patel Nagar New Delhi +918448380779 Call Girls Service in Del...Sexy Call Girls Patel Nagar New Delhi +918448380779 Call Girls Service in Del...
Sexy Call Girls Patel Nagar New Delhi +918448380779 Call Girls Service in Del...
 

Great Marsh Coastal Resiliency Planning

  • 1. Great Marsh Symposium November 12, 2015 Great Marsh Coastal Community Resiliency and Adaptation Planning
  • 2. Presentation Outline • The science behind climate-driven threats • Defining vulnerability • Overview of the resiliency planning initiative • Work completed to date • What lies ahead • Vulnerability findings for Salisbury, Newbury, Newburyport • Vulnerability findings for Essex, Ipswich, and Rowley
  • 4. Essex Technical High School Report – April 2015 Bigger & More Frequent Storms
  • 5. Bigger Storms Mean More Precipitation Overview of the Manomet Climate Change Adaptation Project “Over most regions, precipitation is likely to be less frequent but more intense, and precipitation extremes are very likely to increase”
  • 6. Sea Level Rise Historical & Longer-term Projections NewHampshireCoastalRisks &HazardsCommission
  • 7. Erosion Climate Change is the Great Accelerator
  • 8. Vulnerability = sensitivity + exposure + adaptive capacity A resource is vulnerable if it is exposed and sensitive to the effects of climate change and at the same time has only limited capacity to adapt.
  • 9.
  • 10. Dept. of Interior Hurricane Sandy Resiliency Grants Program “Community Risk Reduction through Comprehensive Community Resiliency Enhancement for the Great Marsh Ecosystem” Project Area: • Salisbury, Newbury, Newburyport, Essex, Ipswich, & Rowley. Resiliency Planning Objectives: • Assess overall community vulnerability as well provide focused assessments of highly vulnerable high-priority community assets through a comprehensive and integrated approach. • Identify operationally feasible, site-specific adaptation strategies that serve to reduce risk. • Engage communities as we work together to lay a framework for future implementation of on-the-ground adaptation strategies.
  • 11. 1. Develop community climate vulnerability assessments 2. Conduct comprehensive public outreach & engagement 3. Publish an Adaptation Plan & Implementation Roadmap Community Resiliency Planning Tasks To Be Completed
  • 12. Project components • Community Engagement & Planning • Hazard Vulnerability and Socio-economic Impact Assessment • Marsh Adaptation Strategy Tool (MAST) • Coastal Adaptation to Sea Level Rise Tool (COAST)
  • 13. Year 1 • Community task force implementation • Identify community assets & concerns • Publish community climate- vulnerability assessments • Community Vulnerability Workshops Year 2 • Identify adaptation strategies • Hold community adaptation workshop • Write community coastal adaptation plans • Hold regional implementation workshops Where are we? 6 months into the process
  • 14. Phase 1: Assess Community Vulnerability Identified resources of concern by… • Collecting existing data • Conducting new analyses
  • 15. Community Vulnerability Documents Work to Date • Review of community exposure, sensitivity, and vulnerability. • In depth look at high-priority assets in the community • First drafts written for Salisbury, Newbury, Newburyport, Essex, Ipswich, & Rowley
  • 16. Work Ahead • Finalize Vulnerability Assessments • Continue community outreach • Develop Adaptation Strategies • Host public workshops • Publish Great Marsh Climate Adaptation Plan & Implementation Roadmap
  • 17. Community Resiliency Task Force Northern Region (Salisbury-Newburyport-Newbury) Great Marsh Coastal Community Resiliency and Adaptation Planning
  • 18. Community Resiliency Planning • Members were appointed to Community Task Forces in April 2015 • Task Forces convened in May & have met three times in regional groups • Work has continued over past six months in person and off-line • Committee work • Sub-projects (MAST & COAST) • Monthly conference calls
  • 19. Identifying Current Vulnerabilities: Hazard Mitigation & other plans • MVPC regional plan includes Rowley, Newbury, Newburyport & Salisbury • Summarizes specific hazards and “targets” that are vulnerable • FEMA Flood Risk report Essex County, MA – 2013 • Master plans • Open space plans • Natural Heritage Biomap reports
  • 20. Task forces reviewed and prioritized community assets of highest concern Prioritization of community resources
  • 21. Salisbury • Northernmost coastal community in MA • 15.4 sq. miles land area, 27% of which is Great Marsh • 8,283 year-round residents, grows to as many as 24,000 in summer • majority of the town’s infrastructure is located in two sections: Salisbury Beach and Salisbury Square • Salisbury Beach is a 3.8-mile barrier beach • Salisbury Square is 2 miles inland and is town center with municipal buildings, stores & residences
  • 22.
  • 23.
  • 24. High-Priority Assets Identified By The Salisbury Resiliency Task Force High-Priority Assets Identified By The Salisbury Resiliency Task Force Priority Asset Location Hazard Type Salisbury Barrier Beach 3.8 mile long beach from NH Border to Merrimack River Jetty Erosion, flooding Salisbury Beach at Broadway East of Broadway, stretching 200ft north and south Erosion, flooding Coastal Dune South of Broadway Ocean Street to Vermont Street Erosion, flooding Coastal Dune #2 @ Salisbury Beach Northeast of Ocean Street Erosion, flooding Low-lying residential areas bordering the Blackwater River salt marsh 9th Street south to Lewis Ave Flooding North End Boulevard from Old Town Way to 18th street Flooding Sewage Pumping Station 228 Beach Rd Flooding Coastal Dune #1 @ Salisbury Beach East of Driftway Rd Erosion, flooding Seawall @ First Street 32 1st Street Erosion, flooding
  • 25. Salisbury Beach at Broadway St. Coastal dunes
  • 26. Newburyport • Bordered by Merrimack River to north, Newbury to south • Includes northern tip of Plum Island • 17,800 year-round residents • historic downtown • waterfront district is the civic and commercial center of the city • Industrial Park along border with Newbury is home to approx. 60 industrial businesses
  • 27.
  • 28.
  • 29. High-Priority Assets Identified By The Newburyport Resiliency Task Force High-Priority Assets Identified By The Newburyport Resiliency Task Force Priority Asset Location/Coordinates Hazard Type Plum Island Turnpike Joppa Flats Nature Center East to Sunset Dr. Tidal and storm flooding Waste Water Treatment Facility 157 Water Street Flooding from storm surge and SLR Lower Artichoke Reservoir West end of Newburyport south of Merrimack River Salt-water intrusion Bartlett Spring Pond 742 Spring Ln Salt-water intrusion Merrimack River Jetty System Mouth of the Merrimack River Deteriorates over time; potentially increases erosion Scotland Rd at Little River/Parker Street Flooding Water Street Plum Island Turnpike to Merrimack Street Flooding Central Waterfront Cashman Park to US Coast Guard Station Flooding Revetment at Cashman Park Cashman Park Degrading over time Revetment at Harbor Master Building Cashman Park Degrading over time
  • 30. Waste Water Treatment Facility Central Waterfront & Downtown businesses
  • 31.
  • 32. COAST: Coastal Adaptation to Sea Level Rise Tool One-time Damages from 100-year Flood in Newburyport, MA Study Area Year Sea Level Rise Damage to Buildings 2030 Low (0.31 ft) $14.1 Million 2030 Med (0.50 ft) $14.9 Million 2030 High (0.72 ft) $15.8 Million 2070 Low (1.09 ft) $18.3 Million 2070 Med (2.19 ft) $24.2 Million 2070 High (3.45 ft) $32.4 Million
  • 33. Newbury • 24.2 square miles, 30% of land area is Great Marsh • 6,666 year-round residents, swells in summer due to Plum Island’s seasonal homes, many located along coast of island • Town’s infrastructure is located in three distinct sections: Old Town, Byfield, and Plum Island • Parker River & Little River & low-lying topography contribute to tidal & inland flooding
  • 34.
  • 35.
  • 36. High-Priority Assets Identified By The Newbury Resiliency Task Force High-Priority Assets Identified By The Newbury Resiliency Task Force Priority Asset Location/Coordinates Hazard Type Plum Island Turnpike/Plumbush Downs MA Audubon’s Joppa Flats Education Center East to Sunset Dr. Tidal and storm flooding Sewage Pumping Station on Plum Island Webbers Ct. & Olga Way Near area subject to overtopping Newbury Elementary School 63 Hanover St. Emergency shelter – access points flood. Newburyport Turnpike/Rt. 1 Rt.1 at Parker River bridge Tidal and storm flooding Newburyport Industrial Park Parker St, Scotland Rd Flooding caused by small culverts Triton Middle & High School - Elm St/Central St - 112 Elm St, Byfield, MA 01922 Possible future flooding of ball fields Newburyport train station Route 1 rotary near Little River & back end of Parker St Flooding Pine Island Road off of 1A Flooding, ice cakes, high winds, zero visibility Cottage Road off of 1A near Parker River Flooding from Parker River Central St. dam 70 Central St Flooding, possible dam failure River St./Forest St. dam Byfield Flooding, possible dam failure Groin/Jetty @ Plum Island Boulevard Plum Island Deteriorates over time, possible erosion
  • 38. • The Salisbury and Plum Island Barrier Beaches are the #1 line of defense for our communities • Unfortunately, developed barrier beaches are much less resilient to impacts of climate change. Regional resources of collective concern to the northern task force
  • 39. Community Resiliency Task Force Southern Region (Essex-Ipswich-Rowley) Great Marsh Coastal Community Resiliency and Adaptation Planning
  • 40. Identifying Current Vulnerabilities: Hazard Mitigation Plans • Ipswich & Essex Hazard Mitigation Plans with MAPC • MVPC regional plan includes Rowley, Newbury, Newburyport & Salisbury • Summarizes specific hazards and “targets” that are vulnerable
  • 41. Community Resiliency Planning • Members were appointed to Community Task Forces in April 2015 • Task Forces convened in May & have met three times in regional groups • Work has continued over past six months in person and off-line • Committee work • Monthly conference calls
  • 42. Task forces reviewed and prioritized community assets of highest concern Prioritization of community resources
  • 43. Essex • 16 sq. miles of which 48% is forested and 34% is Great Marsh • 3504 residents • Majority of infrastructure located along Rt 133/ Main St Causeway spanning salt marsh and Essex River • Causeway is a critical transportation corridor
  • 44.
  • 45.
  • 46. High-Priority Assets Identified By The Essex Resiliency Task Force High-Priority Assets Identified By The Essex Resiliency Task Force Priority Asset Location Hazard Type Main Street Causeway & Woodman's Beach 74 Main St. to 166 Main St. Flooding Eastern Avenue at Ebben Creek 81 Eastern Ave to 97 Eastern Ave Flooding Conomo Point Rd All of Conomo Point Rd Flooding Crane Beach (tip of point) Erosion Farnham’s Restaurant culvert 88 Eastern Ave Flooding Eastern Ave and Grove St Intersection of Eastern Ave and Grove St Richdale’s Gas Station 156 Main Street Flooding Ball fields (high school baseball) and playground behind Town Hall Flooding Landing Road culvert Alewife Brook crossing off of Western Ave Flooding Apple Street culvert near Andrews Street Flooding
  • 47. Main Street Causeway & Woodman's Beach Conomo Point Road
  • 48. Ipswich • 33 sq. miles, 21% of land area is Great Marsh • 13,175 residents • Dense downtown along the banks of Ipswich River house most of town infrastructure • Crane Beach is important community resource for recreation and tourism
  • 49.
  • 50.
  • 51. High-Priority Assets Identified By The Ipswich Resiliency Task Force High-Priority Assets Identified By The Ipswich Resiliency Task Force Priority Asset Location/Coordinates Hazard Type Jeffrey’s Neck Road Beachview Lane northeast to 144 Jeffrey's Neck Rd Flooding Downtown Ipswich Main St businesses and County Rd near Choate Bridge Flooding Crane Beach End of Argilla Road Erosion Route 1A at Muddy Run 188 High Street Flooding South Main Street 45 S Main Street Flooding Town Wharf + pumping station 68 East St Flooding Labor in Vain Road Bridge 80 Labor In vain Road Flooding Fox Creek Bridge 200 Argilla Road Flooding Choate Bridge Downtown Flooding
  • 52. Crane Beach Town Wharf & Sewage Pumping Station
  • 53. Rowley • Rural coastal community of 5856 residents, located between Newbury and Ipswich • 19 sq. miles in size, of which 20% is Great Marsh • 90% of town is zoned for residential use; business development along Route 1 & Route 1A corridors
  • 54.
  • 55.
  • 56. High-Priority Assets Identified By The Rowley Resiliency Task Force High-Priority Assets Identified By The Rowley Resiliency Task Force Priority Asset Location Hazard Type Route 133 at Bachelder Brook North of Route 1 intersection Flooding Jewell Mill Dam Off Route 1 near Newbury town line Dam failure/flooding Rowley Town Well # 3 Along Mill River off of Boxford Road Flooding, inundation of well pump station 13 acres of beach on Parker River National Wildlife Refuge Plum Island Erosion Hillside St culvert at tributary to Mill River Flooding Newbury Road South of Route 133 Flooding Stackyard Road East of Route 1A at north end of town Flooding Communications Cell Tower 594 Main Street Flooding
  • 57. Jewel Mill Dam at Mill River Route 133 at Batchelder Brook culvert
  • 58. Barrier beaches that are undeveloped but are seeing changes due to climate impacts Regional resources of collective concern to the southern task force Plum Island Crane Beach Rowley Ipswich Essex
  • 59. Thank You! Great Marsh Resiliency Partnership
  • 60. Community Vulnerability Assessment Introduction to Table Discussions • Each table will have: • List of assets • Maps to review • Facilitator • Note taker • Questions to spark discussion
  • 61. Community Vulnerability Documents Questions for Table Discussions General • What climate-driven threats are you most concerned about ? • What’s the first thing that comes to mind when you think of climate threats? • What’s the best way to disseminate vulnerability information in your community? • How can we get our towns and general public to think more long term? Specific • Are there additional vulnerable assets that we missed? • Of the high-priority assets we’ve identified, which assets are the most critical? • Looking 20 years into the future, how do you envision your community changing and how will those changes exacerbate or mitigate climate-driven threats?
  • 62. Thank You! Great Marsh Resiliency Partnership

Editor's Notes

  1. Thanks to Chris and Wayne for their introduction and great overview. I want to walk folks through what I’m going to cover over during my presentation and then what the next two presenters are going to talk about. Start with a very basic primer on the science behind climate-driven threats that are most relevant to the Great Marsh region. Then I’m going to define vulnerability so we’re all on the same page. Then I’m going to talk about the resiliency planning work that we’re doing to help communities better cope with these climate-driven threats I’m going to cover the work that we’ve already accomplished to date. What lies ahead. And then I’m going to turn it over Julia Godtfredsen, the Newburyport Conservation Administrator, and she’s going to discuss the preliminary findings from our climate vulnerability assessment that we’ve conducted. She’ll cover information for Salisbury, Newbury, and Newburyport. Then Lisa O’Donnell, the chair of the Essex board of Selectmen, will take over and present the findings for Essex, Ipswich, and Rowley. We’ve got a lot to cover so I’m going to jump right in.
  2. I want to pose the questions, why are we here now talking about climate change? Why should we be concerned about climate-driven threats? Haven’t coastal communities always been vulnerable to flooding, erosion, and other natural hazards? And yeah, the North Shore has always been vulnerable to catastrophic weather events. Here’s the front page of the Boston herald after Hurricane Carol impacted Massachusetts on September 6th, 1954. But one of the differences between back then and now, is that these once in a lifetime catastrophic events are becoming more common than once in a lifetime. Climate-driven threats are just that. They aren’t new threats. But they are driven, they are made worse, they are accelerated by climate change.
  3. I want to spend a couple minutes talking about the science behind the threats facing our communities. Keep in mind climate processes are inherently complex. And there are way smarter people than me studying these processes and writing about them in scientific journals. But I’m going to boil down the science into some very simple terms. Storms are becoming bigger and they’re becoming more frequent. That’s because storms are driven by moisture. As temperatures continue to rise, more and more water vapor is evaporating into the atmosphere, and water vapor is the fuel for storms. “If we are creating an atmosphere more loaded with humidity, any storm that does develop has greater potential to develop into an intense storm,” (That’s according to NASA) Storms are becoming more severe. And likely more frequent.
  4. Here in New England, we’re also likely to see a lot more precipitation. Estimates vary, but according to the New England Climate Coalition, in New England precipitation is estimated to increase up to 60 percent in winter by 2100. And smaller percentage increases for the other seasons. Now predicting future precipitation rates is difficult. New England Climate Coalition says 60% increase. But you can see in this slide that Manomet’s climate program notes a 30% increase in winter precipitation. While scientists aren’t positive how much precipitation will increase, they are fairly certain that that there will be some measurable increase, and it I’s likely that the precipitation we do receive will be in sporadic bursts. (source: http://www.neaq.org/conservation_and_research/climate_change/climate_change_in_new_england.php)
  5. I borrowed this graphic from our neighbors to the North – the new Hampshire Coastal Risks & Hazards Commission. You can see the sea has been rising steadily, but it’s projected to increase dramatically over the next few years. Possibly 2 feet by 2050. That’s a lot! I also like how this graphic shows the various causes of SLR. SLR is caused by a host of factors including warming oceans leading to thermal expansion, melting of land-based glaciers, melting of the Antarctic and Greenland ice sheets, and then vertical land movements along with various ocean dynamics. There are a lot contributing factors leading to the rising seas.
  6. Erosion is one of the biggest threats to many of the communities because of the significant coastal development located right along the shores. Climate change doesn’t inherently increase erosion. But greater storm frequency and severity, combined with SLR, will likely accelerate erosion. This comes from one of CZM’s workshops they hosted to present the findings of the Coastal Erosion Commission. Erosion is happening and as climate-driven threats act synergistically to accelerate erosion, we’re in for some serious impacts.
  7. Now that we’ve discussed the threats. What makes something vulnerable? We use the term vulnerability a lot, so I want to be clear and define it. According to the IPCC (intergovernmental Panel on Climate Change), vulnerability is “the degree to which a system is susceptible to, or unable to cope with, adverse effects of climate change, including climate variability and extremes” But I like the above definition better. It comes from a paper put out by a researcher in Spain and I edited it slightly. An old wood structure is sensitive to flooding. Because of it’s inherent qualities, decaying, not that stable, won’t hold up very well in a strong flood. An old wood structure near a river that often floods after severe storms has high exposure. An old wood structure that can be easily elevated above flood danger might be considered to have adaptive capacity. Human infrastructure generally needs support to adapt. Natural systems, can sometimes if unimpeded, adapt on their own. Marshes can migrate inland gradually if human infrastructure and topography don’t prevent the shift. For our process, we want to evaluate these components of vulnerability both as they are now as well as how they might shift in the face of SLR, erosion, and increased storm activity. Now that we understand vulnerability. I want to shift out of the theoretical and closer to present day.
  8. So I want to point out this photo from Plum island. What do you think, before the house fell in, could we have looked at it and said with confidence they were vulnerable? Why? Did they have high exposure, yes. How about sensitivity? Yes. Intrinsic adaptive capacity? No. So there are an array of climate-driven threats facing North Shore Communities. And unfortunately sometimes it takes a disaster to act as a wakeup call. In October of 2012, Hurricane Sandy slammed into the populated coastline of the Mid Atlantic and New England. It wreaked havoc. According to a report by Aon Benfield (the reinsurance giant) the total economic losses in MA were estimated at 375 million for hurricane sandy. And think about this. Sandy just grazed us. What about the next big nor'easter?
  9. Through funding from the Hurricane Sandy Resiliency Grants Program, the National Wildlife Federation was awarded a grant to fund a suite of project that work synergistically to reduce risk to coastal communities within the Great Marsh by increasing the resiliency of the natural systems Now I’m only going to touch on the community resiliency planning peace project. I’d be happy to chat with folks one-on-one about our other ongoing work in the marsh. But for right now, we’re going to focus on the community resiliency planning. Working in these towns… We’re identifying community risk through a comprehensive and integrated approach. We’re working with folks on the ground to better understand their perspectives and learn from their wealth of knowledge. What and where? It could be described as a bottom up approach. But we’re not solely relying on local knowledge. We’re also working with several contractors who are doing cutting edge geospatial analyses to identify community risk, analyze consequences of climate-driven threats, and do economic analyses. So we’re really trying to take a broad and comprehensive approach. Once we identify vulnerability and risk, we’re going to identify site-specific adaptation strategies that actually work. Not multi-million dollar fantasy projects that will never get funded. But we’re looking to identify direct and actionable steps communities can take to reduce risk. Finally, we’re building long-lasting partnerships with folks in the community. That’s how you lay the groundwork for future implementation of adaptation strategies. These are our broad goals.
  10. There are three main tasks. Objective 1: develop a climate vulnerability assessment- 1a. Identify which important resources or assets are most vulnerable to natural hazards. 1b. Understand why these resources vulnerable. 1c. Evaluate the consequences if these resources are impacted. 1d. Evaluate how SLR, erosion, and increased storm activity will contribute to existing vulnerability. Objective 2: Comprehensive public outreach & engagement Reasons to engage the public: Open a wider dialogue create ground-level community support for addressing these issues educate interested parties receive feedback 3. Adaptation plan and implementation roadmap This plan will include vulnerability assessments for each of the six towns we’re working: Salisbury, Newbury, Newburyport, Essex, Ipswich, and Rowley. It will identify operationally feasible adaptation strategies that serve to reduce risk to coastal communities while enhancing the resiliency of natural systems.
  11. To accomplish our objectives and our tasks, we’ve got four components to our planning process. For the community engagement and planning, we’ve established community resiliency task forces consisting of municipal officials, emergency management personnel, and other local planners. These task forces meet regularly and provide input on this process ensure local perspective is adequately captured. They are in many ways a driving force behind a lot of this work. We’re working with Woods Hole Group to provide cutting edge inundation modeling – the same modeling that MA DOT is using for their vulnerability work. And then USGS who is going to provide a geospatial analysis of the six Great Marsh communities, describing variations in community exposure to coastal hazards, including a very exciting economic and socio-economic impact assessment. GEI Consultants applied the Marsh Adaptation Strategy Tool (MAST) to the Great Marsh. Through the MAST process, GEI looked at where and how ecosystem service benefits are likely to change relative to future sea level rise. GEI also conducted a no-action iteration of COAST for the downtown Newburyport area. The analysis evaluates real estate losses from sea level rise and storm surge under different scenarios if no adaptation action is taken. As you can see, there are a lot of parts that are feeding into this Resiliency Planning effort.
  12. The objectives are pretty clear and I’ve covered the components that are feeding into this effort. Here’s the timeline of when we’re going to accomplish our objectives. Year 1 We established task forces and they’ve been meeting regularly. We’ve identified community assets & concerns by working closely with the task forces, by reviewing of all the great work that has been done by others to assess community vulnerability, and by working with our contractors. Right now we’re in the process of finalizing the community climate-vulnerability assessments. We’re also conducting broader community outreach efforts. That’s all being completed in year 1. It was ambitious but it looks like we’re going to pull it off. Year 2 Working with the communities, we’re going to identify site-specific adaptation strategies that are best suited to protecting their high-priority assets. We’re going to host multiple workshops to present our work and allow for additional community feedback. And at the end of the day we’re going to publish a Great Marsh Coastal Adaptation Plan and an implementation roadmap that summarizes community vulnerability, highlights operationally feasible adaptation strategies, and provides direction on how to move forward from planning to implementation. How do we get these adaptation strategies supported, funded, and permitted.
  13. So phase one of the process is almost complete. We worked with folks on the ground to do a thorough literature review of all the documents and reports that could help us understand the vulnerability of north shore communities. We worked with emergency management personnel, planners, and others to get their perspective on what parts of their town were most vulnerable And right now we’re in the final stages of working with Woods Hole Group and USGS to provide a geospatial analysis of the six Great Marsh communities to help us assess their vulnerability. All of this work is being put into town-specific climate-vulnerability assessment's.
  14. These documents addresses economic, socio-economic, demographic, infrastructure, habitat, and species vulnerability. Each topic area could be the subject of its own in-depth, stand-alone assessment. However that would be cost prohibitive and take years to complete. This document attempts to cover the most important information for each subject area addressed, but it does not claim to cover ALL the information available The goal of this document is to address high-priority vulnerable assets in a manner that will support the towns as they prepare to cope with accelerating climate-driven threats.
  15. Taj passes off to Julia after this slide What’s ahead? We’re going to continue working with the task forces to finalize the vulnerability assessments. Here’s a photo of one of our task force meetings as folks are reviewing some community assets. We’re going to stay connected and visible in the communities. We’re going to begin developing adaptation strategies We’re going to host public workshops And we’re going to work with folks to develop the Great Marsh Coastal Adaptation Plan and an implementation roadmap. That document will summarize community vulnerability and will highlight operationally feasible adaptation strategies that will reduce risk. With that, I’ll pause and see if folks have any questions for me before I turn it over to the next presenter. And with that, I’m going to turn it over to Julia Godtfredsen, Newburyport Conservation Administrator, and a member of Newburyport Resiliency task force. She’s going to talk about the preliminary findings of the vulnerability assessments we’ve conducted for Salisbury, Newbury, and Newburyport.
  16. Julia starts here
  17. How were task forces formed in Newburyport as one exemplification of the process used in all 3 towns Interest/involvement of Mayor Collaboration with neighbor towns Discussion included both regional issues and break-outs into town-specific working groups Collaboration with other staff and/or boards and/or groups (Newbury has a secondary task force) Include discussion of Newburyport’s EPA project as one exemplification of parallel efforts incorporated such as MAST and COAST?
  18. This is an example of one of the many documents that we drew information from – one which many of you worked on. After reviewing relevant reports and data summaries, we had a long list of community assets that were deemed vulnerable.
  19. The next step was to prioritize the community assets – essentially telling us what assets we should look at in further detail as part of this project. We prioritized assets during a working session of the northern task force. Each town formed their own working group to review a long list of community assets in their town that are likely vulnerable from climate-driven threats. We had maps on the table from CZM showing projected inundation from SLR for that particular town. We also had maps showing predicted inundation from category hurricanes. We’ll show you these maps in a second. And then after reviewing the assets and the notes we had collected on their vulnerability, after reviewing the maps, community task force members participate in two-rounds of voting to prioritize what they believed be the most valuable and vulnerable community assets.
  20. So now we’re going to run through each town, starting with Salisbury, to go over the findings of our task force. Using maps from CZM, Army Corps, and FEMA, we’ll show you the areas of concern in terms of flooding and then we’ll provide a list of the high-priority assets as identified by the task force. Highlight major areas of development/concern/makeup of the community. Defining characteristics.
  21. We used several maps to help us identify key resources that are vulnerable to coastal storms, flooding and sea level rise. This map developed by MA CZM for us (thank you!) shows coastal inundation resulting from varying amounts of SLR. The darker red is 1-foot SLR, the lighter orange is 6-foot SLR. The six foot is also a good indicator of storm surge levels that can be expected with certain storms now.
  22. We also used Hurricane Surge Inundation maps from the National Hurricane Center data - with FEMA, NOAA & US Army Corps of Engineers data. Light green is Hurricane Surge resulting from Category 1 storms. Point out areas of concern. Highlight specific neighborhoods, roads that are shown to be vulnerable. Highlight evacuation concerns.
  23. The Salisbury Task Force identified the most significant areas of concern based on these resources plus local knowledge. Review briefly. We’ll focus in on a couple of these in more detail (next slide)
  24. Point out areas of concern. Highlight specific neighborhoods, roads that are shown to be vulnerable. Salisbury Beach waterfront area, neighborhoods on the backside of the beach, and the access road to the beach area. Three of the four high-priority assets that the Salisbury Resiliency Task Force identified are parcels or sites – not infrastructure. The Salisbury barrier beach stretches for nearly four miles from the Merrimack River Jetty north to the New Hampshire state border. Salisbury’s significant tourism-based economy relies heavily on this beach. The beach also provides significant flood protection to North End Boulevard and the infrastructure built alongside it. Salisbury Beach at Broadway has also been identified as an area of particular concern. This area of the beach suffers chronic flooding from over-wash caused by storms that coincide with high tides. Just south of Broadway, a coastal dune stretching from Ocean Street to Vermont Street provides critical flood protection to an otherwise vulnerable stretch of beach real estate. These assets are within the 100-year flood plain as well as the inundation zone for a category one hurricane. These assets are highly vulnerable to storm surge, sea level rise, and long-term and acute erosion.
  25. Newburyport is a bustling city with a lot of assets that folks were concerned about. It was a bit of a challenge to identify the highest of high-priority assets in this city – simply because there were so many sites folks were concerned about.
  26. Similar to the Salisbury map you just saw, here is the Newburyport SLR. Point out areas of concern. Highlight specific neighborhoods, roads that are shown to be vulnerable. Downtown Newburyport, Plum Island Turnpike, Plum Island
  27. Newburyport storm surge inundation A lot of the same areas are vulnerable to hurricane storm surge. Here you can see inland flooding is a major concern as well. Note Little River area.
  28. Review briefly.
  29. The Newburyport Waste Water Treatment Facility, located along Joppa Flats, was largely built above the 100-year FEMA floodplain. However, components of the facility are located in flood prone areas, according to the Newburyport Resiliency Task Force. Furthermore, the draft Natural Hazard Risk Assessment notes that two to three feet of sea level rise would potentially inundate the facility and render it inoperable. Increased storm surge, particularly when combined with just one foot of sea level rise, threatens the Much of Newburyport’s historic downtown waterfront is located at a high enough elevation to be immune from all but the most severe storm surges. Natural topographic features, combined with an array of bullheads and other grey infrastructure, protect much of downtown. However infrastructure located immediately along the bank of the Merrimack is quite vulnerable to flooding and sea level rise. Infrastructure located along Water Street and Merrimack Street is less vulnerable but is occasionally subject to flooding. Infrastructure just further inland doesn’t flood from storm surge but is vulnerable to flooding caused by heavy precipitation events. Outdated and insufficient drainage systems don’t have the capacity to remove flood waters quickly enough, increasing the vulnerability of downtown areas such as Market Square.
  30. Mention EPA project – briefly explain the interplay of two projects and how it fits into the city’s greater effort on these issues
  31. COAST project is a subcomponent of the Great Marsh Resiliency Planning effort, a contract with GEI consultants to explore how the COAST tool can be used by a community to understand potential real estate damages from sea level rise and storm surge events. Time horizons chosen based on feedback from CZM and others; These align with DOT time horizons they’re using to assess risk as well as what other towns are using. This image shows one-time damage estimate for 100-year flood in 2030 with medium sea level rise 100-year storm in 2030 will cause between 14 and 16 million. SLR doesn’t have a huge impact yet. In 2070, low SLR or high SLR makes a big difference. 18 million or 32 million. Based on these numbers, Newburyport has some significant vulnerability to storm surge that will be exacerbated by SLR. Other communities can consider using the COAST tool to inform their understanding of impacts to real estate values from climate change.
  32. As we reviewed maps and talked about assets, it became clear Newbury and Newburyport were interconnected when it comes to their vulnerability. Threats in one town can impact the other – this is especially true on Plum Island and along the Little River.
  33. Newbury Sea Level Rise scenarios
  34. Newbury storm surge inundation. Note again the Little River area.
  35. Review Briefly as before for the other towns
  36. As we did for the other towns, here are a couple specific examples. The Plum Island Turnpike is the only access point to Plum Island, and it is almost entirely within the 100 year floodplain. According to the Newbury Resiliency Task Force, the road is subject to frequent flooding, especially during winter months when high tides can combine with Northeasters. For example, this road was completely shut down for a period this past winter. The Industrial Park is plagued by flooding largely caused by improperly sized bridges and culverts along the Little River. Although the park is located in Newburyport, flooding in this area is caused by the restrictions in the Town of Newbury. Because the Little River runs through both communities, relieving flow restrictions along the river has the potential to increase flooding downstream and across municipal jurisdictions. It is critical that Newbury and Newburyport work together to address these hydro-barriers through a comprehensive watershed approach, ensuring that efforts to relieve existing flood hazards do not simply shift the flood hazard to another highly developed area downstream. The predicted increase in heavy precipitation events and SLR threatens to exacerbate existing flooding concerns.
  37. Plum Island & Salisbury Beach The dunes in the Parker River National Wildlife Refuge are heavily vegetated with native shrubs that increase the resiliency of the coastline. However along the non-refuge portions of Plum Island and Salisbury Beach, human activity has increased beach and dune sensitivity to climate hazards, especially erosion. Transition to Lisa
  38. Lisa starts here INSERT TEXT about how southern towns contrast a bit from the northern towns just discussed.
  39. This is an example of one of the many documents that we drew information from – one which many of you worked on. These are a few of the others: FEMA Flood Risk report Essex County, MA – 2013 Master plans Open space plans National Heritage Biomap reports
  40. Explain how task force was formed in Essex to exemplify how the process worked in each town: Interest/involvement of Town Administrator and how helpful that was to process History of this work in Essex as an example of one town Task forces had discussion of regional issues and included break-outs with town-specific working groups Collaboration with other staff and/or boards and/or groups – for example students (Liz Duff-Audubon students, Eric Magers) Highlight Essex applying for and winning CZM grant on behalf of all the towns to add value to project. Discuss the CZM grant. Thank CZM
  41. Highlight involvement of police chief (emergency management officer) and how important it is to have the right people at the table.
  42. Compared to some neighboring towns, Essex has experienced a relatively low rate of development recently. The causeway stretches for 0.8 miles and spans both salt marsh and the Essex River. The causeway is a critical connective corridor between Cape Ann and other North Shore communities and also provides access to a number of restaurants, stores, churches, and marinas in the town center.
  43. Here is the flood inundation map for Essex under various SLR scenarios
  44. Here is the Storm Surge inundation map for Essex
  45. These are the high priority assets for Essex
  46. Here are a couple of examples of the high priority assets in Essex. The Causeway and Woodman’s Beach regularly floods during heavy rain storms and tidal surges. According to members of the Essex Resiliency Task Force, Woodman’s Beach, located on Main Street/Route 133 along the eastern portion of the causeway, floods approximately four to six times a year due to tidal inundation. Woodman’s Beach and the Causeway are both located within the 100-year flood zone and are highly vulnerable to sea level rise, storm surge, and increased extreme precipitation events. Conomo Point Road is susceptible to flooding from storm surge during astronomical high tides and large storm events. This road provides access to a neighborhood located on a small peninsula known as Conomo Point. The openness of Conomo Point and its scenic views of the Essex River estuary and nearby island make this neighborhood an important heritage landscape but it is also extremely vulnerable.
  47. Similar to most New England towns, Ipswich is characterized by a densely populated town center and more sparsely populated rural areas. Downtown Ipswich harbors the majority of the town’s infrastructure. Located along the western bank of the Ipswich River at the overlap of Route 1A and Route 133, the Ipswich town center is vibrant and diverse. Downtown businesses include restaurants, specialty stores, convenience stores, banks, attorneys’ offices, and beauty salons. Agriculture in Ipswich also contributes to the town’s semi-rural character, and its open fields and farms represent about 10% of the town’s land area. However the town is best known for its seaboard lowland landscape and plentiful coastal habitats.
  48. Here is the SLR scenario map for Ipswich. Note in particular how inundated (and narrow) southern plum island becomes. Also note that the 3 large coastal freshwater ponds in town (Clark, Rantoul, Stage Island) are gone.
  49. Here is the storm surge inundation map for Ipswich.
  50. Here is the list of high priority assets. Briefly review all assets, then we will dive into a couple of these in more detail next slide
  51. Crane Beach is the most important asset in town both as a recreational resource and largest tourist destination and the primary line of defense from coastal storms for both Ipswich and Essex. The access road and parking lot already floods regularly so is extremely vulnerable. The Town Wharf is a major recreational and commercial access area along the waterfront. It also houses the town’s only wastewater pumping station which handles 100% of the towns sewage. Its failure would close the entire downtown area.
  52. Briefly review characteristics of Rowley
  53. Plum Island and Great Marsh serve as a protective barrier to much of Rowley infrastructure. Because the entirety of the Island in Rowley is undeveloped and there is relatively little vulnerable development along the coastal marsh due to the large areas of protected land, Rowley can be considered the most resilient community of the six communities in our study. Therefore, most current concerns are related to inland flooding from the Mill River and the Rowley River and its tributaries
  54. Rowley’s inundation map – flooding located along Parker River in the north and Rowley River in the south
  55. Here are the high priority assets identified by the task force in Rowley.
  56. Here are two examples. Jewel Mill Dam at Mill River is located just west of the intersection of Route 1 and Central Street, is considered by the task force to be a high priority asset due to its susceptibility to flooding and resultant risk of failure. According to the North Shore Watersheds report published by the Massachusetts’s Office of Energy and Environmental Affairs, this dam is made out of concrete and stone and creates a 4-acre impoundment of the Mill River. The old bridge over the river Glen Street is extremely vulnerable in the event of a breach at the Jewel Mill dam, as is the route 1 bridge further downstream. Route 133 at Bachelder Brook experiences chronic flooding and is entirely within the 100-year floodplain. Route 133 is one of Rowley’s major roads and connects Interstate 95 and Route 1 with the downtown area as well as Route 1A. Based on Google Earth estimates, citing KSS Fuels, this road carries over 13,000 cars each day. Although flooding, and subsequent closure of the road, does not pose an evacuation hazard it, it is a major traffic disruption. The nearest alternative routes to the south and north are much smaller roads that are not designed to carry heavy traffic loads. The Rowley Resiliency Task Force also noted that beaver activity in this vicinity exacerbates existing flood hazards and could be addressed rather easily.
  57. Undeveloped portion of Plum island and Crane Beach are regarded as a high priority assets by the Rowley, Ipswich & Essex Resiliency Task Forces. Barrier beaches act as an important buffer to the inland marshes and land areas. Plum Island has high value for Rowley and abutting communities. This beach falls within the Parker River National Wildlife Refuge and provides habitat to a variety of shorebirds, including the federally-threatened Piping Plover. During late summer and fall, the beach provides significant recreational opportunity to tourists and residents. However, beach erosion is a major problem for Rowley and the Wildlife Refuge that manages this stretch of beach. Erosion is likely to increase because of sea level rise and the occurrence of larger, more powerful storms. As the beach erodes, upland habitats, such as dunes and low-land coastal shrub areas, will become more exposed to coastal flooding. Crane Beach is a 5-mile barrier beach that stretches from the Ipswich River southeast to Essex Bay. IPSWICH: Ipswich’s significant tourism-based economy relies heavily on this beach. However flood waters, coming around the back side of the beach through the marshes, can close Argilla road and even flood the beach parking lot several times a year. A recent culvert upgrade was designed to alleviate some of this flooding. The beach itself provides significant flood protection to 1,500 acres of salt marsh and nearly 2,000 acres of dunes and beaches. Crane Beach is also an important storm buffer to several year-round and seasonal homes located on Argilla Road. Crane Beach, along with the homes and habitats it protects, are all located within the 100-year floodplain. However, sea level rise is the single biggest threat to Crane Beach. Crane Beach is also experiencing significant rates of erosion and sediment transport. ESSEX: Crane Beach acts as a buffer between Essex Bay and the open ocean, however the beach is eroding at an alarming rate of 4.6 feet annually. As Crane Beach erodes, Essex Bay will be further exposed to the open ocean with no barrier to absorb storm hazards. Constant erosion and loss of buffering landmass at Crane Beach will also likely intensify marsh erosion throughout Essex Bay and will increase the Town’s overall vulnerability to climate-driven impacts.
  58. On behalf of the Great Marsh Resiliency Partnership, thank you so much for your participation Now MAPC Environmental Planner Sam Cleaves is going to introduce the next portion of our presentation.
  59. Sam Cleaves takes over from Lisa to introduce break-out groups Introduce yourself as part of steering committee and co-founder of GMC. Today, I’m wearing my planning hat. Like any good planning effort, we want to take advantage of your expertise and knowledge to get your input on what you heard this morning For the next 50 minutes or so, we are asking you to participate in a discussion with your fellow table mates and respond to a series of questions which will be incorporated into the final vulnerability assessments for the Great Marsh.
  60. Sam Cleaves Here’s what we are hoping to get your feedback on. The questions are all at your tables but we’ll leave them up for your convenience.
  61. On behalf of the Great Marsh Resiliency Partnership, thank you so much for your participation Ready set go! (Sam, keep track of time and announce when time is up! Let everyone know that we will collect their feedback and be sure to incorporate it into the reports.)