Download as PDF, PPTX

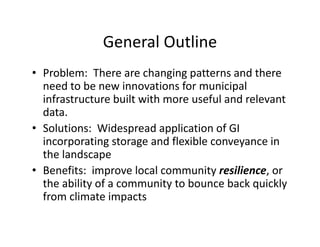
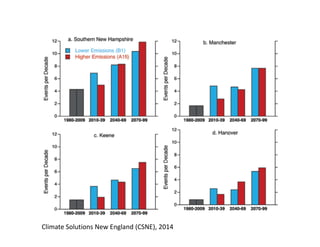


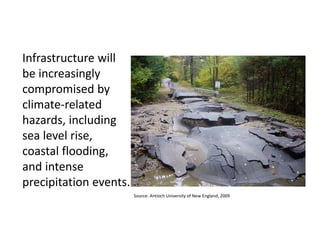


The document discusses the need for innovations in municipal infrastructure to address changing climate patterns, particularly with the increasing prevalence of extreme rainfall events. It highlights the importance of using up-to-date design standards and implementing green infrastructure solutions to enhance community resilience. The outdated infrastructure and data can lead to increased risk from climate-related hazards, necessitating proactive measures in design and planning.


