1. Quinns Beach Review of Coastal Management
Joanna Garcia-Webb1
and William Edge2
1
Cardno, Perth, Australia; joanna.garcia-webb@cardno.com.au
2
Cardno, Perth, Australia
Abstract
Coastal erosion issues have been reported at Quinns Beach, Western Australia, since 1973. Early
investigations resulted in construction of an artificial headland in 1977 at the cusp of the beach, a soft point
where the coastline alignment changes due to offshore reefs, to stabilise the coastline to the south. In the
years following construction, the beach north of the cusp lost approximately 170,000 m3
of sand. A three-
stage investigation during 1999 concluded that the beach north of the cusp required protective works to
prevent undermining of the beach-access car-park, and erosion threatening the coastal road.
Three groynes on the coast north of the cusp were constructed from 2002 to 2004, as a long-term protection
solution. Staged renourishment, totalling approximately 204,000 m3
, was distributed over the beach until
2006. Significant erosion has continued between the artificial headland and the two southernmost groynes;
recreational areas have been lost, and additional infrastructure is threatened. Erosion has also increased
north of the groyne field.
In 2012, a review of the historical coastal protection works at Quinns Beach commenced, with the aim of
providing coastal management advice to halt further erosion and loss of infrastructure. The study found the
artificial headland was constructed 120 m south of the original location of the cusp. The coastline north of the
headland has been gradually receding to realign the equilibrium planform, with the present-day cusp located
coincident with the artificial headland.
Potential mitigation options were evaluated for effectiveness, ease of construction, impacts and cost. The
recommended solution optimised the use of existing hard structures whilst mimicking the natural equilibrium
planform of the beach to minimise maintenance requirements.
As part of the study, a monitoring and management plan was also developed to allow local managers to
maintain the study area, including the identification of monitoring triggers that flag the need for expert
engineering advice.
Keywords: coastal management, shoreline, mitigation structures, sediment transport, beach nourishment.
1. Introduction
In 2012 the City of Wanneroo (herein referred to as
‘the City’) requested a review of coastal protection
works at Quinns Beach, as well as the provision of
management advice to halt further erosion and
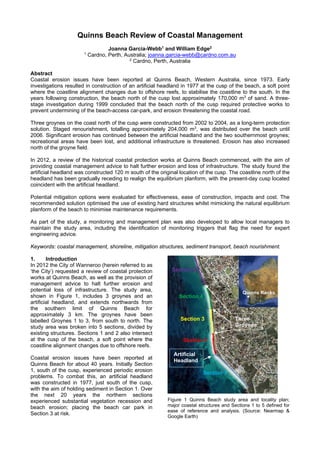
potential loss of infrastructure. The study area,
shown in Figure 1, includes 3 groynes and an
artificial headland, and extends northwards from
the southern limit of Quinns Beach for
approximately 3 km. The groynes have been
labelled Groynes 1 to 3, from south to north. The
study area was broken into 5 sections, divided by
existing structures. Sections 1 and 2 also intersect
at the cusp of the beach, a soft point where the
coastline alignment changes due to offshore reefs.
Coastal erosion issues have been reported at
Quinns Beach for about 40 years. Initially Section
1, south of the cusp, experienced periodic erosion
problems. To combat this, an artificial headland
was constructed in 1977, just south of the cusp,
with the aim of holding sediment in Section 1. Over
the next 20 years the northern sections
experienced substantial vegetation recession and
beach erosion; placing the beach car park in
Section 3 at risk.
Figure 1 Quinns Beach study area and locality plan;
major coastal structures and Sections 1 to 5 defined for
ease of reference and analysis. (Source: Nearmap &
Google Earth)
Quinns Rocks
Section 1
Artificial
Headland
Section 2
Section 3
Section 4
Three
Groynes
Section 5
2. In 1999 the City initiated a coastal management
study with the aim of limiting erosion and
protecting infrastructure, such as the car park. This
resulted in the construction of 3 limestone groynes
along the coast, stretching northwards from the
cusp. The design length and crest level were
lowered and shortened respectively for aesthetic
reasons following community consultation. The
protection works also included staged
renourishment of 204,000 m3
from 2002 to 2006.
The present study was carried out in stages over
2012 and 2013. Stage 1 involved summarising
previous investigations and other knowledge
gathered to date, assessing the local coastal
processes and reviewing historical coastal
protection works and their effects. Using this
information, several coastal management options
were investigated and the most viable two
identified. Stage 2 involved comprehensively
evaluating two elected management options, as
well as a third option, developed in consultation
with the City and the Department of Transport
(DoT).
Stage 3 involved the development of a monitoring
and management plan, to assist the City with
independent structure condition assessments and
provide advice on coastal structure monitoring, as
well as to define triggers for professional
inspection and repair work. A 25-year maintenance
plan was designed for the three groynes, two
vehicle beach access points and the timber access
stairway.
2. Coastal Conditions and Processes
Quinns Beach is located on the west coast of
Australia approximately 35 km north of Perth CBD
(Figure 1). It has a tidal range of 1.2 m and is
somewhat protected from the Indian Ocean swell
by outer and inner reef systems. No wave
modelling was conducted for this study; the
literature review provided a conservative 50-year
Average Recurrence Interval (ARI) nearshore
design wave height of 2.8 m [2]. The desktop
review, site visits and historical aerial photograph
analysis showed fairly consistent net sediment
transport to the north.
Figure 2 Erosion and damage to coastal infrastructure,
including car park, following a significant storm surge on
the 28th
and 29th
of November 2012 (Source: the City).
Initial site visits by Cardno found the beach
generally in poor condition, with a significant scarp
present for the majority of the coastline north of the
artificial headland. An erosion pinch spot in the lee
of Groyne 1 had put the car park at particularly
high risk.
One week after project inception an extreme
weather event occurred in the Perth metropolitan
area, with the 4th
highest recorded storm surge in
the past 20 years* causing significant damage at
Quinns Beach. Damage to the car park and a
seawall are visible in Figure 2.
*Measured 3rd
highest at Hillarys (1992-2012) and 5th
highest at
Two Rocks (1994-2012)
3. History
Coastal issues have been reported at Quinns
Beach for around 40 years. Using the City’s
documentation and other available information,
major coastal work to date is summarised briefly in
Table 1.
Table 1: Historical events – Quinns Beach
Date Event
1973 First report of coastal erosion (Section 1)
1977 Artificial headland constructed
1984-88 Erosion reported to the north of headland
1996-
2000
‘Substantial’ renourishment, investigations
into coastal processes
2002 Emergency coastal protection works;
limestone seawall in front of car park
2002-
2006
Staged construction of 3 groynes and
renourishment (~204,000 m3
)
2008 Emergency works - repair of seawall
A combination of methods was used to examine
and assess the historical shoreline changes.
These included analysis of historical site and aerial
photographs, as well as vegetation-line movement
analysis. Quantitative analysis showed some areas
of vegetation receded over 50 m in the 1978-2012
period.
Through historical aerial photographic analysis it
was observed that the artificial headland was in
fact constructed some 120 m south of the ‘true’
cusp location. Over time this caused the soft
coastline to erode in the lee of the structure, and
realign to create a new cusp location. This has
resulted in vegetation recession of 20-50 m along
the coastline immediately north of the headland. A
selection of historical aerial photography is shown
in Figure 3 to highlight this realignment.
3. Figure 3 Aerials of the cusp from 1974, 1978, 1993,
2002, and 2012; showing rotation of the coast to the
north (Source: DoT).
4. Coastal Management Strategy Selection
Cardno (the present study) investigated seven
different individual coastal management options,
as well as various combinations. The options and
their motive for investigation are as follows:
Managed status quo, including groyne
modifications if necessary (the City)
Fourth groyne (the City/ original MRA design)
Sand renourishment and/or bypassing (the
City)
Managed retreat (requirement of DoT)
Modification of artificial headland (Cardno)
Seawall construction (Cardno)
Offshore breakwater (Cardno)
Each option was evaluated in terms of impacts,
ease of construction, capital cost, maintenance
cost and probable effectiveness. Effectiveness
was weighted doubly, as it was considered to be
most important that the solution was effective.
Other factors were also considered on a case by
case basis. For example:
The City preferred, if possible, not to relocate
any groynes;
The City did not consider loss of the car park
an ideal solution (managed retreat);
The DoT prefers to avoid hard structures such
as seawalls due to their impact on local coastal
processes.
4.1 Option Evaluation
Table 2 shows the evaluation of each management
option. Headland modification was rated the
highest of any single option. However no single
option was considered sufficient to meet the aims
of the project in a cost effective manner. As a
result, a combined option was proposed for
detailed study, outlined below.
5. Comprehensive Evaluation
Three options were evaluated as part of Stage 2.
Option 1 and 2 were output from Stage 1, whilst
Option 3 was an additional option developed in
consultation with the City and the DoT.
5.1 Option 1 – Combination 1
To mitigate all erosion issues and meet the project
aims a combination of the most effective strategies
was proposed. The full option involved:
Shifting the artificial headland 75 m northwest.
Removing Groynes 1 and 2 and constructing a
new groyne between the two.
Construction of a new groyne to the north of
the existing groyne field (Groyne 4).
Renourishment of Sections 2 to 5, particularly
to accommodate new structures and beach
compartments.
Repair of existing groynes, including an
increase to crest levels at the head.
This option aims to recreate the natural beach
profile and use groynes to create wide beach
compartments with amenable value for users. The
repositioning of Groynes 1 and 2 was designed to
alleviate the severe erosion at the car park and
move any possible pinch spot in the lee of the new
groyne to an area with large setback to any assets.
The new Groyne 4 was designed to create a stable
beach compartment between itself and Groyne 3.
The design included investigations of appropriate
spacing between the groynes [4] as well as
potential impacts.
Table 2 Evaluation matrix for coastal management options
Solution Option
Protection Solution
Ease of
Construction
Impacts Effectiveness Capital Cost
Maintenance
Cost
Total
Managed Status Quo 3 4 3 2 2 17
Fourth Groyne 3 3 3 2 3 17
Sand Renourishment 4 5 2 2 1 16
Headland Modification 4 4 4 3 4 23
Seawall Construction 2 1 2 1 2 10
Offshore Breakwater 1 2 3 1 3 13
Managed Retreat 5 1 1 4 4 16
4. A sediment budget analysis from the last 10 years
provided insight into the effectiveness of the
existing groynes for comparison. This analysis
found that almost all renourishment placed
between the original groynes from 2002 to 2006
has moved out of the system. This, combined with
the damage to the crest of the existing groynes,
led to the recommendation that the existing groyne
(Groyne 3) should be repaired to a higher crest
level, and new groynes should be built longer and
higher.
Figure 4 Option 1: proposed new groyne and headland
relocation; visible existing groyne to be removed. 0 and
2 m AHD renourishment contours shown in orange.
Beach survey transect locations are shown as black
lines.
Renourishment is an essential part of the strategy
as it creates a buffer under storm conditions, and
minimises the effects of any construction on the
leeward coastline. A volume of 113,000 m3
was
proposed for this option to appropriately ‘fill’ the
beach. To complement the renourishment,
vegetation matting and revegetation programmes
were recommended.
5.2 Option 2 – Managed Retreat
As per the DoT’s guidelines and recommendation,
a managed retreat option was further evaluated.
The aim is to plan removal or loss of assets at risk
whilst allowing coastal processes to continue
without significant human interference. This option
is preferred when the expected loss is very low
and assets are adaptable.
Figure 5 Vegetation lines at Quinns Beach pinch spots
(Sections 2 and 3 left, Section 5 right); Blue = 1988 (25
years ago); Yellow = 2013 and; Red = 2038 (in 25 years’
time).
By extrapolating recession rates from the past 34
years, since the construction of the artificial
headland, expected losses were estimated. The
car park is predicted to lose functionality within 10
years and require removal. Over the full 25-year
project analysis period, if recession did not
diminish, up to 700 m of Ocean Drive could
become vulnerable and potentially unstable
(Figure 5). As a conservative estimate, waiting 25
years before managing erosion could devalue and
0 m
AHD
2 m
AHD
1988
19882038
2038
5. threaten around $40 million worth of beach front
property.
It is difficult to extrapolate historical erosion trends
and apply them to future predictions; this recession
analysis is therefore considered a worst case
scenario. However, erosion rates and sediment
budgets have been historically underestimated at
Quinns Beach, so conservative cases can be
considered appropriate.
5.3 Option 3 – Combination 2
During consultation with the City and the DoT, a
third option was developed. It is very similar to
Option 1 except the original groynes are left in
place and an offshore headland structure is
installed to protect the car park from erosion.
Figure 6 Option 3: proposed headland at the northern
end of the car park; existing groyne to remain. 0 and 2 m
AHD renourishment contours shown in orange. Beach
survey transect locations are shown as black lines.
This new headland is intended to be approximately
50 m offshore from the vegetation line at the
northern end of the car park, designed to interrupt
sediment transport and hold sand to the south.
Given price constraints, the design proposed
consists simply of placed rocks similar to the
existing artificial headland.
As part of this option it was recommended that the
existing groynes be repaired to maintain
functionality and safety. Shifting the headland to
the northwest and constructing Groyne 4, as per
Option 1, are also recommended.
A smaller renourishment volume of approximately
80,000 m3
is recommended for Option 3. Again it is
designed to ‘fill’ the beach around new structures.
6. Costs and Maintenance
A preliminary cost estimate of each option was
prepared to enable a cost-benefit analysis of the
options. A 25-year expected maintenance and
expense plan was also developed for the 3
options, and compared at the net present value to
eliminate any time bias. A discount rate of 7% [1]
was applied.
6.1 Option 1
This option has the most expensive initial outlay,
and has the same maintenance plan and cost as
Option 3. The maintenance plan includes groyne
maintenance and moderate renourishment every
10 years where needed, as well as some minor
revegetation work two and five years after
installation to ensure vegetation establishment.
Table 3 Option 1 Cost Estimate
Total (NPV at 7%) $6,308,000
Structures $1,300,000
Renourishment $3,600,000
Matting $63,000
Revegetation $130,000
25-year Maintenance $1,215,000
6.2 Option 2
This option has the lowest initial outlay but there
are potentially high costs should severe erosion
continue to cause recession along the study area.
A narrow and unusable beach is of low value to the
City and general public; a cost of losing the beach
amenity was included in the cost estimate. The use
of the beach is valued at approximately $500,000
per year.
Table 4 Option 2 Cost Estimate
Total (NPV at 7%) $10,388,000
Groyne maintenance (every 10 years) $80,000
Car park and equipment removal
(2023)
$66,000
Car park revegetation (2024) $200,000
Cost of losing beach amenity (2025 –
2038)
$1,990,000
Cost of loss of Ocean Drive (2038) $7,740,000
Maintenance and minor renourishment $312,000
0 m
AHD
2 m
AHD
6. The critical cost for Option 2 is the potential
devaluation or loss of parts of Ocean Drive. This
was valued at around $40 million and
conservatively expected to occur in 2038.
6.3 Option 3
This option has the cheapest overall cost due to its
savings on initial structures and renourishment.
Table 5 Option 3 Cost Estimate
Total (NPV at 7%) $4,916,000
Structures $1,000,000
Renourishment $2,560,000
Matting $47,000
Revegetation $94,000
25-year Maintenance $1,215,000
7. Conclusions and Recommendations
Each option provides an alternative approach to
the coastal management at Quinns Beach, and
balances the requirements of the City with
sustainable and economic coastal management.
Options 1 and 3 are very similar, both aiming to
recreate a stable beach profile and maintain use of
the car park and beach areas. Option 3 benefits
from a lower price and simple construction, as well
as leaving the original groynes in place as
requested by the City.
For Options 1 and 3, car park access and beach
use is expected to continue over the next 25 years,
given planned maintenance is performed. Under
Option 2 beach width will diminish and removal of
the car park will become inevitable. Given recent
storm activity and damage to the car park this
could occur sooner than the predicted 10 years.
It is recommended that wave and current data be
recorded at Quinns Beach for a minimum of 2
months, including both a summer and winter
period. As part of detailed design, calibrated wave
and sediment transport modelling should be
carried out using the measured wave and current
data to confirm and optimise the design. The wave
model will enable confirmation of the design
criteria for the groynes. The sediment transport
model can be used to test different groyne
configuration and lengths to determine which
option will best protect the coastline and assets at
risk. The DoT’s recommended allowance of 0.15 m
sea level rise by 2030 should also be incorporated
into any future modelling work.
Given the predicted large cost of the project,
understanding the system in a quantitative manner
(as opposed to the largely qualitative approach
which has been conducted to date) will ensure the
design is robust and fulfils its intended function.
This is particularly important as the majority of
renourishment previously placed at Quinns Beach
was lost within 10 years.
8. Monitoring and Management Plan
A monitoring and management plan was also
provided as part of the above project to assist the
City in maintaining their coastal structures
independently. At present this includes 3 groynes,
2 vehicle access points and a pedestrian stairway.
The plan also provides advice on photographic
beach monitoring, a complete monitoring and
maintenance schedule and a generic technical
specification for construction works at Quinns
Beach.
In order to perform quality condition assessments,
the inspector must be aware of the various modes
of failure for the structure. The plan includes a
breakdown of all the likely modes of failure for a
coastal rock structure. For ease of repeatability
and comparison, a damage rating system was
defined and an inspection template provided,
including a completed example from early 2013.
For all the structures, appropriate triggers were
defined for inspectors to recognize when a
professional inspection is required, or when
damage may pose a threat to public safety. Clearly
defined photographic monitoring points were also
stipulated to allow the City to compare structure
degradation clearly over a well-defined time period.
It is intended that the inspection methods
presented to the City can apply to any similar
coastal structure.
In addition, it was recommended that photographic
monitoring of the beach be undertaken from
consistent points every year in spring. The 17
suggested beach monitoring points cover the
entire study area. To date the City’s photographic
monitoring has proven to be a valuable resource,
even though a plan was not clearly defined. The
defined monitoring points as part of the plan will
provide a good indication of visual beach changes
for future studies.
9. Acknowledgements
The authors would like to acknowledge the City
and DoT for their assistance and contribution to
this study.
10. References
[1] Australian Government 2007, Best Practice
Regulation Handbook, Canberra
[2] MP Rogers & Associates Pty Ltd (MRA) (1999a).
Quinns Beach Coastal Protection Works: Stage 1
Report, Report No R058 Draft 1, prepared for Shire of
Wanneroo
[4] Silvester R. & J.R.C. Hsu (1999). “Coastal
Stabilization‟, Advanced Series on Ocean Engineering -
Volume 14, 2nd
Edition, World Scientific, Singapore
![In 1999 the City initiated a coastal management
study with the aim of limiting erosion and
protecting infrastructure, such as the car park. This
resulted in the construction of 3 limestone groynes
along the coast, stretching northwards from the
cusp. The design length and crest level were
lowered and shortened respectively for aesthetic
reasons following community consultation. The
protection works also included staged
renourishment of 204,000 m3
from 2002 to 2006.
The present study was carried out in stages over
2012 and 2013. Stage 1 involved summarising
previous investigations and other knowledge
gathered to date, assessing the local coastal
processes and reviewing historical coastal
protection works and their effects. Using this
information, several coastal management options
were investigated and the most viable two
identified. Stage 2 involved comprehensively
evaluating two elected management options, as
well as a third option, developed in consultation
with the City and the Department of Transport
(DoT).
Stage 3 involved the development of a monitoring
and management plan, to assist the City with
independent structure condition assessments and
provide advice on coastal structure monitoring, as
well as to define triggers for professional
inspection and repair work. A 25-year maintenance
plan was designed for the three groynes, two
vehicle beach access points and the timber access
stairway.
2. Coastal Conditions and Processes
Quinns Beach is located on the west coast of
Australia approximately 35 km north of Perth CBD
(Figure 1). It has a tidal range of 1.2 m and is
somewhat protected from the Indian Ocean swell
by outer and inner reef systems. No wave
modelling was conducted for this study; the
literature review provided a conservative 50-year
Average Recurrence Interval (ARI) nearshore
design wave height of 2.8 m [2]. The desktop
review, site visits and historical aerial photograph
analysis showed fairly consistent net sediment
transport to the north.
Figure 2 Erosion and damage to coastal infrastructure,
including car park, following a significant storm surge on
the 28th
and 29th
of November 2012 (Source: the City).
Initial site visits by Cardno found the beach
generally in poor condition, with a significant scarp
present for the majority of the coastline north of the
artificial headland. An erosion pinch spot in the lee
of Groyne 1 had put the car park at particularly
high risk.
One week after project inception an extreme
weather event occurred in the Perth metropolitan
area, with the 4th
highest recorded storm surge in
the past 20 years* causing significant damage at
Quinns Beach. Damage to the car park and a
seawall are visible in Figure 2.
*Measured 3rd
highest at Hillarys (1992-2012) and 5th
highest at
Two Rocks (1994-2012)
3. History
Coastal issues have been reported at Quinns
Beach for around 40 years. Using the City’s
documentation and other available information,
major coastal work to date is summarised briefly in
Table 1.
Table 1: Historical events – Quinns Beach
Date Event
1973 First report of coastal erosion (Section 1)
1977 Artificial headland constructed
1984-88 Erosion reported to the north of headland
1996-
2000
‘Substantial’ renourishment, investigations
into coastal processes
2002 Emergency coastal protection works;
limestone seawall in front of car park
2002-
2006
Staged construction of 3 groynes and
renourishment (~204,000 m3
)
2008 Emergency works - repair of seawall
A combination of methods was used to examine
and assess the historical shoreline changes.
These included analysis of historical site and aerial
photographs, as well as vegetation-line movement
analysis. Quantitative analysis showed some areas
of vegetation receded over 50 m in the 1978-2012
period.
Through historical aerial photographic analysis it
was observed that the artificial headland was in
fact constructed some 120 m south of the ‘true’
cusp location. Over time this caused the soft
coastline to erode in the lee of the structure, and
realign to create a new cusp location. This has
resulted in vegetation recession of 20-50 m along
the coastline immediately north of the headland. A
selection of historical aerial photography is shown
in Figure 3 to highlight this realignment.](data:image/gif;base64,R0lGODlhAQABAIAAAAAAAP///yH5BAEAAAAALAAAAAABAAEAAAIBRAA7)