Downloaded 126 times

![Ecell
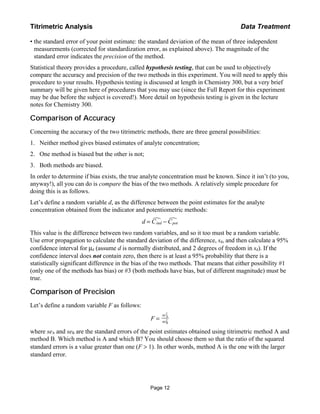
titrant added
to analyte
stir bar
indicator electrode
reference
electrode
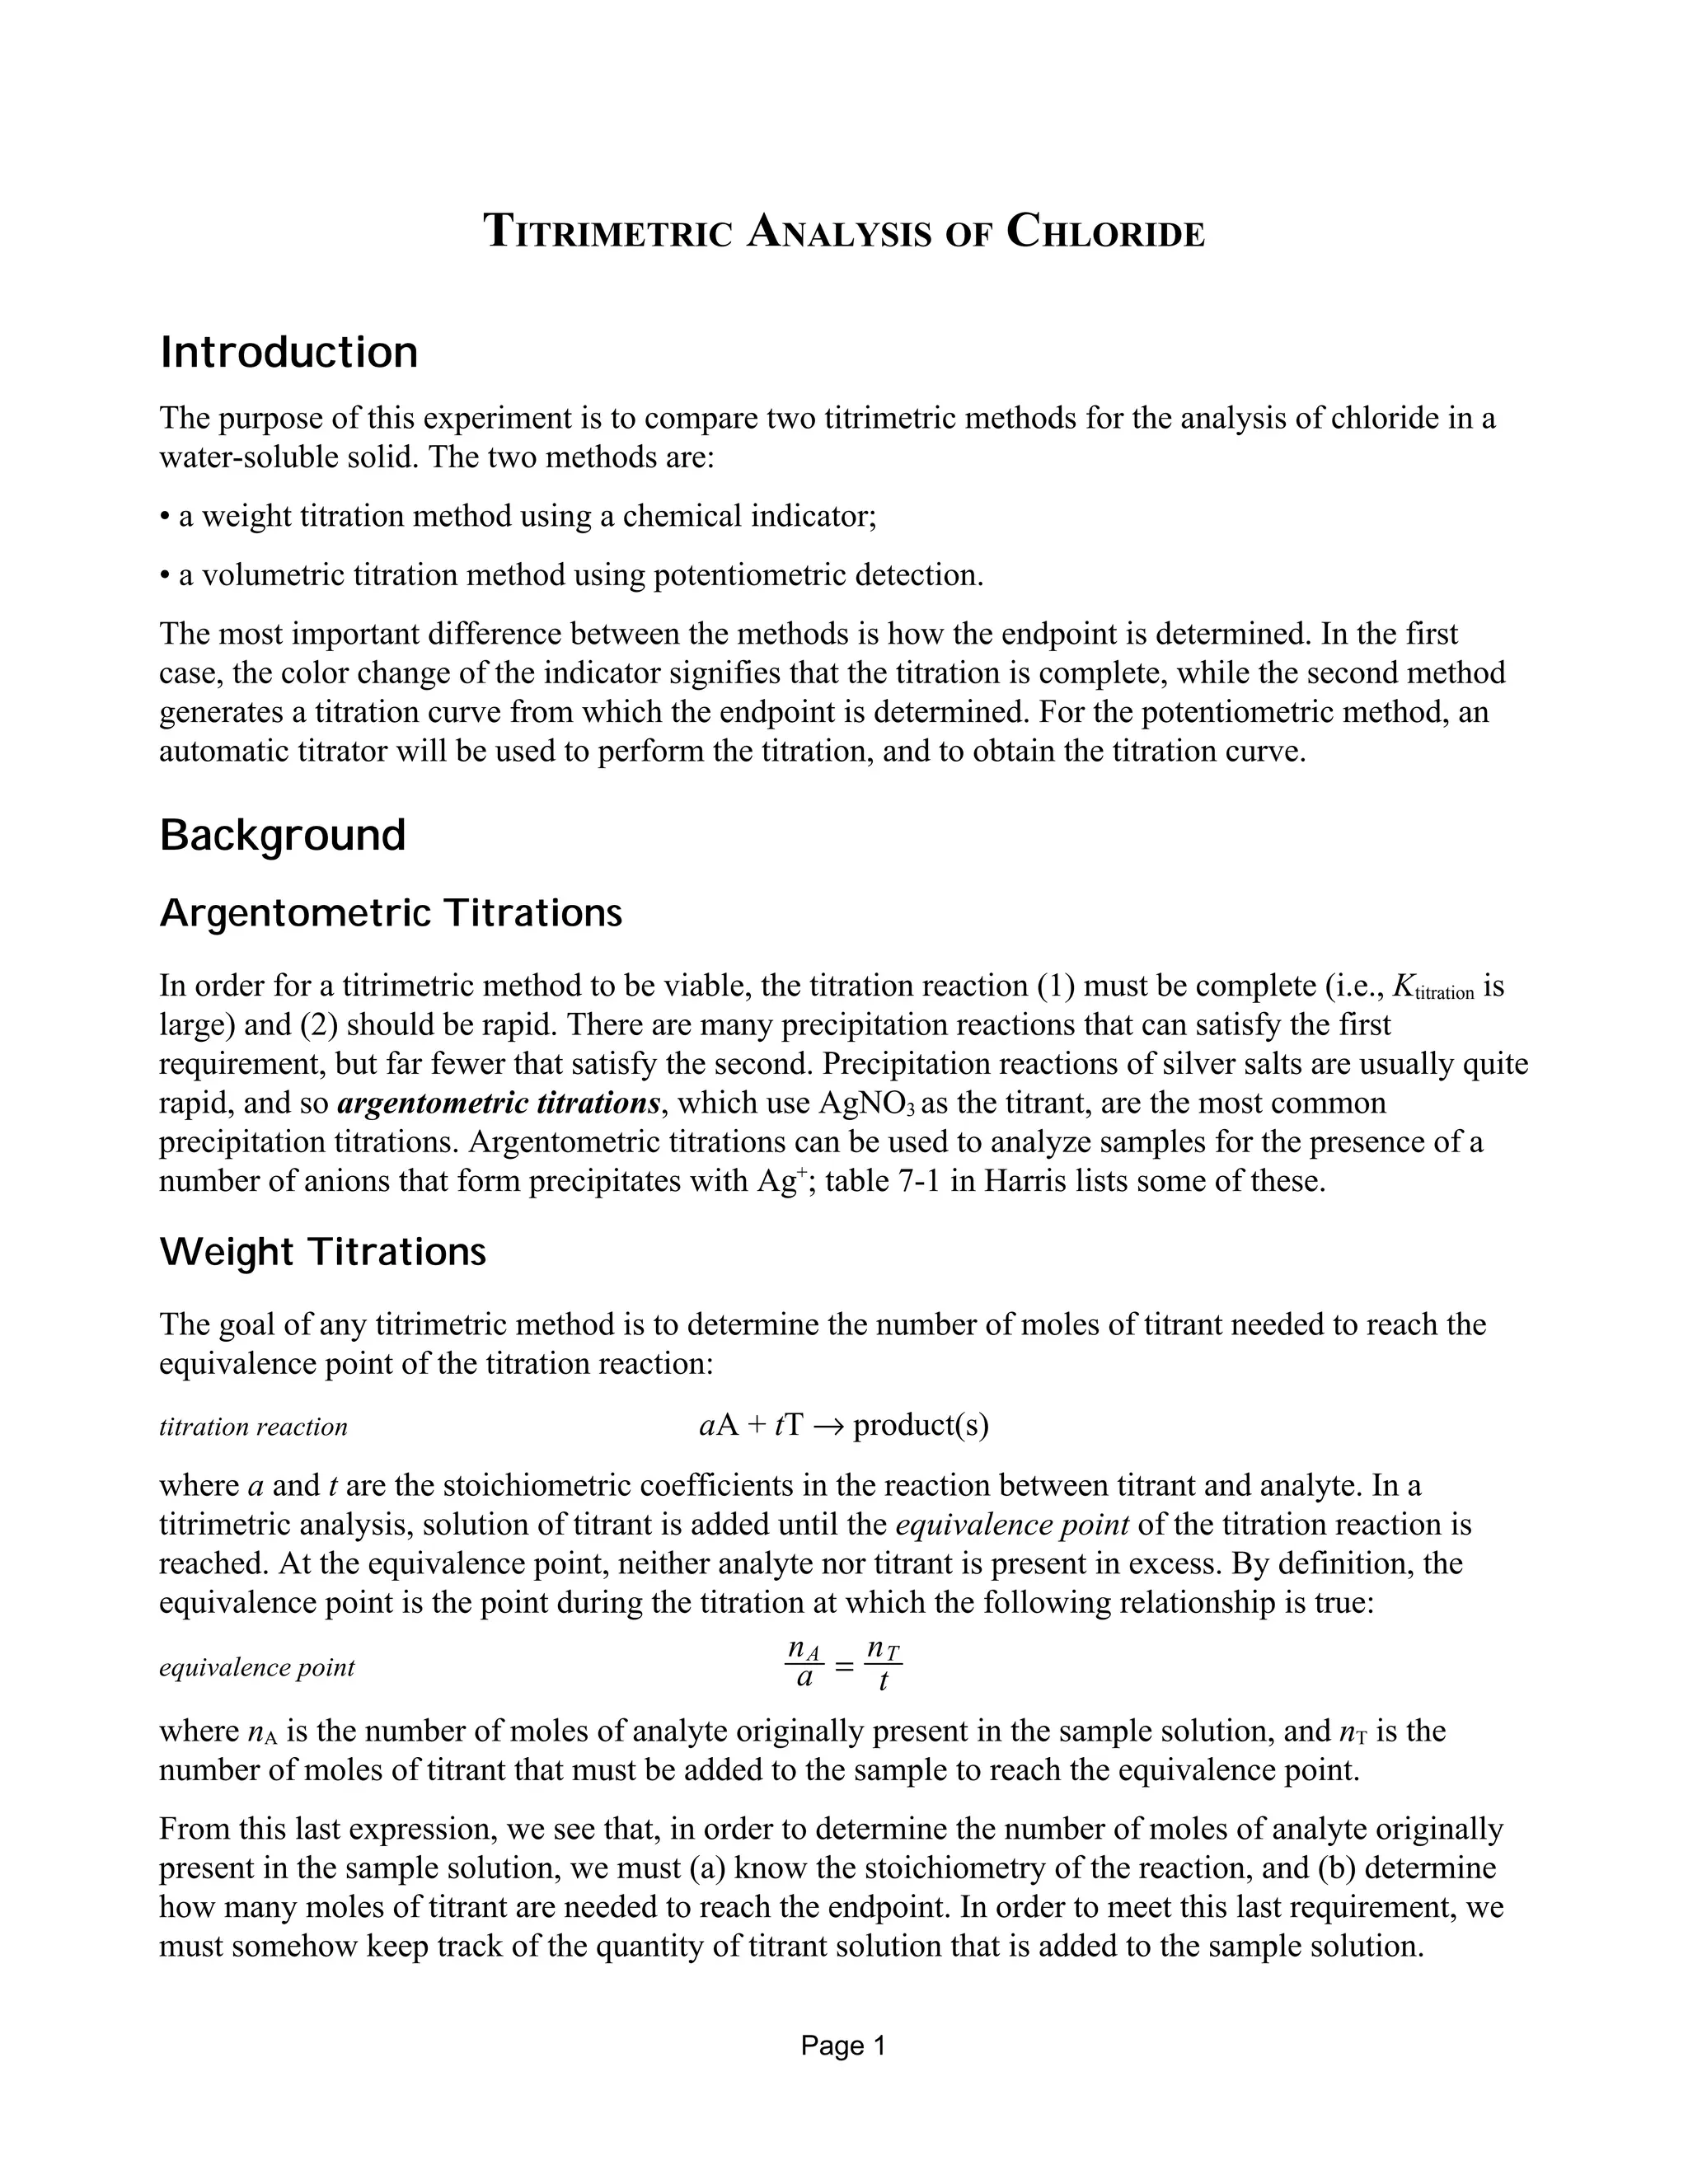
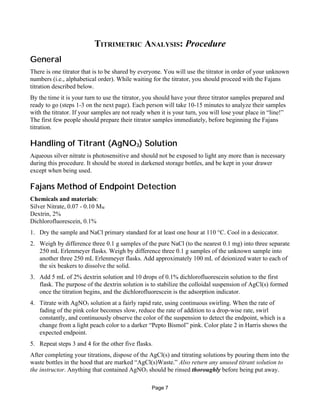
The analyte solution is part of an electrochemical cell that can be represented by
reference electrode || analyte solution | indicator electrode
The reference electrode usually contains a liquid junction that completes the electrical circuit. The
potential of this cell can be written as
Ecell = Eind − Eref
where Eind is the half-cell potential at the indicator electrode due to species in the analyte solution and
Eref is the half-cell potential of the reference electrode. The reference electrode is chosen to be stable:
Eref is assumed to be constant during the titration. Any changes in measured cell potential are due to
changing species concentrations in the analyte solution.
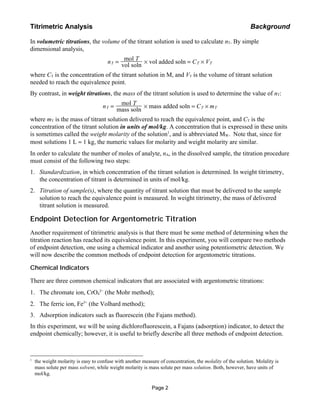
Let’s imagine that we wish to monitor the course of the argentometric determination of Cl−
. The
titration curve in argentometric titrations is sometimes represented by a plot of p[Ag] vs added titrant,
and the curve should be sigmoidal in shape.
mass added titrant, g
pAg
Titrimetric Analysis Background
Page 5](https://image.slidesharecdn.com/argentometrictitration-140626135725-phpapp02/85/Argentometric-titration-5-320.jpg)
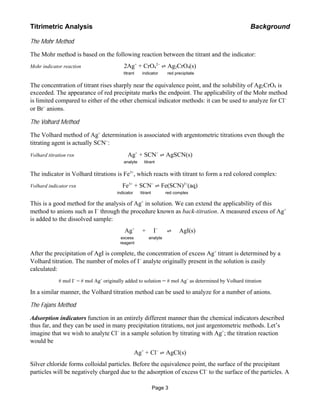
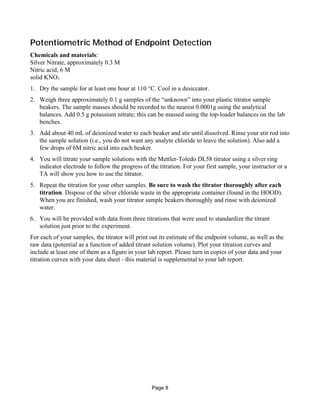
![We will now show that we observe the same sigmoidal shape if we plot Ecell instead of p[Ag] as the
x-axis, so long as we use the proper indicator electrode to measure Ecell. If we use a bare silver wire as
our indicator electrode, our electrochemical cell can be represented as
reference || Ag+
, Cl−
, AgCl(s) | Ag(s)
At the indicator electrode, the dissolved Ag+
will have a certain tendency towards reduction to the
silver metal:
Ag+
+ e−
! Ag(s) Eind
The potential of this half-reaction will depend on the concentration [Ag+
] in the analyte solution,
according to the Nernst equation:
Eind = Eind
0
− 0.0592
n logQ
Since n = 1 and Q = [Ag+
]−1
, we may write for this cell
Ecell = K + 0.0592 " log[Ag+
] = K − 0.0592 "p[Ag+
]
where K is a constant that accounts for various constant contributions to the cell potential, such as the
reference half-cell potential. Thus, as we see, the measured cell potential is directly related to p[Ag+
],
and can be used to follow the course of the titration reaction. A plot of Ecell vs added titrant will yield a
sigmoidal titration curve similar in appearance to the one in the previous figure. The endpoint, which is
usually taken as the inflection point of this curve, can be estimated from a plot of the first or second
derivative of the titration curve.
References
Titrimetry (general): Harris 7
Precipitation titrations: Harris 7.4-7.7
Titrimetric Analysis Background
Page 6](https://image.slidesharecdn.com/argentometrictitration-140626135725-phpapp02/85/Argentometric-titration-6-320.jpg)


This document provides background information on two titrimetric methods for analyzing chloride: a weight titration method using a chemical indicator and a volumetric titration method using potentiometric detection. The weight titration method involves standardizing a silver nitrate solution and then titrating samples to determine the mass of silver nitrate needed to reach the equivalence point. The potentiometric method uses a silver ring electrode to monitor the titration potential and determine the endpoint volume. Procedures for both the Fajans indicator method and potentiometric titration of samples are described.