Downloaded 171 times

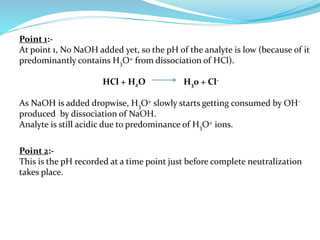
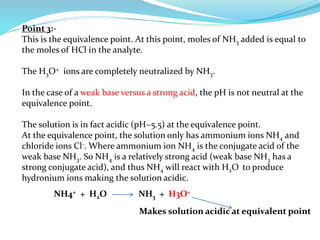
![LAW OF MASS ACTION
The rate of a chemical reaction is proportional to the active masses of the
reacting substance.
A + B C + D
According to law of mass action
Vf = k1[A][B]
Vb = k2[C][D]
Vf = Velocity of forward reaction
Vb = Velocity of backward reaction
[A], [B], [C], [D] is equal to molar concentration of A, B, C & D
K1 & K2 are constant
At equilibirium state, velocity of forward reaction is equal to velocity of
backward reaction
Vf = Vb](https://image.slidesharecdn.com/acidbasetitration-210409125353/85/Acid-base-titration-4-320.jpg)
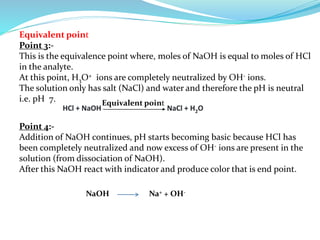
![k1[A][B] = k2[C][D]
k1 and k2 are constant hence,
where k is the equilibirium constant of the reaction.
where, a,b,c……..and p,q,r are the no.of molecules of reacting species.](https://image.slidesharecdn.com/acidbasetitration-210409125353/85/Acid-base-titration-5-320.jpg)
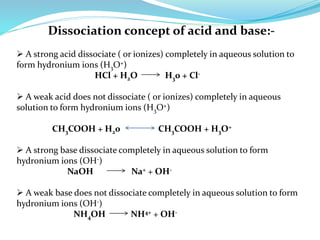
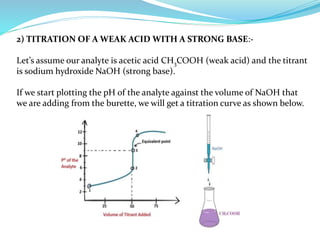
![DISSOCIATION CONSTANT
The [H2O] usually considered to be constant
Kw=[H+][OH]
Where kw is ion product of water.](https://image.slidesharecdn.com/acidbasetitration-210409125353/85/Acid-base-titration-6-320.jpg)
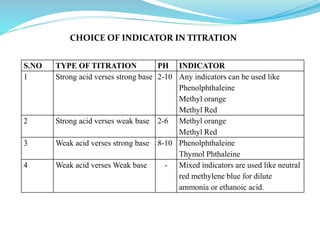
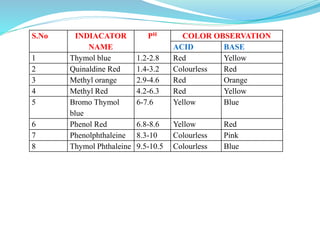
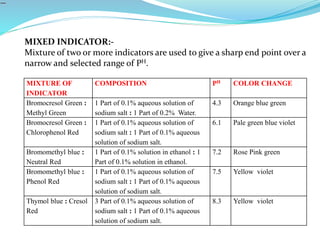
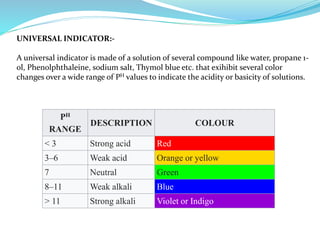


This document discusses acid-base theories and titration. It covers: 1) Arrhenius, Bronsted-Lowry, and Lewis acid-base theories. 2) Types of acids and bases as strong or weak. 3) The law of mass action and dissociation constants. 4) Neutralization curves for different types of acid-base titrations and the pH at equivalence points. 5) Choice of indicators for different titrations and mixed indicators.


![Hypothalamus short ppt by Dr. Neha [PT].pptx](https://cdn.slidesharecdn.com/ss_thumbnails/hypothalamusbydr-260124145759-b9f94a93-thumbnail.jpg?width=640&height=640&fit=bounds)


