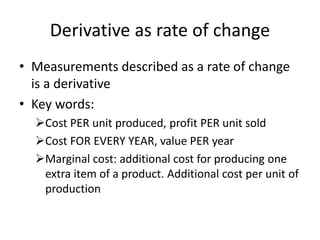
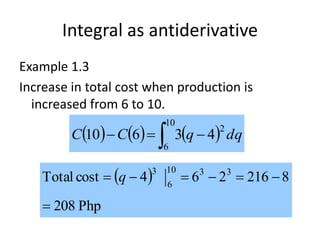
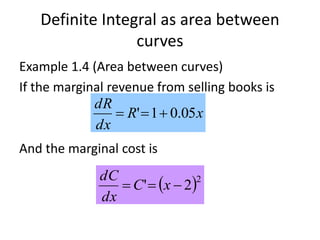
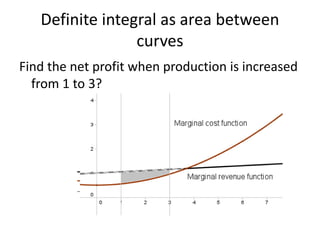
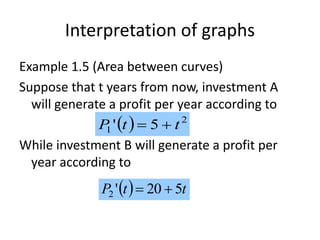
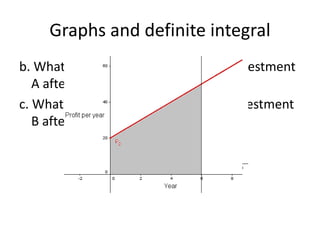
Application of Integration
Business and Economics
Derivative as rate of change
• Measurements described as a rate of change
is a derivative
• Key words:
Cost PER unit produced, profit PER unit sold
Cost FOR EVERY YEAR, value PER year
Marginal cost: additional cost for producing one
extra item of a product. Additional cost per unit of
production
Derivative as rate of change
Key words:
Marginal revenue: additional revenue by
increasing product sales by 1 unit: extra revenue
PER 1 unit increase in sales
Marginal profit: additional profit for each unit
sold: MP=MR-MC.
Demand curve as a rate of change
Demand function:
Quantity a consumer is willing to buy for each unit
increase in price
Supply curve as a rate of change
Supply function
The quantity of goods a producer is willing to
produce for every unit increase in price
Integral as Anti derivative
   dxxFxF '

 


axdxaC
adxdCa
dx
dC
COST PER UNIT PRODUCED
Integral as an antiderivative
Example 1.1
If cost of printing 1 book is 90 pesos, what is the
cost of printing 500 books?
xC
dxdC
dx
dC
90
9090

  
Php000,4550090
500At


C
x
Integral as antiderivative
If cost of printing 1 book is 90 pesos, what is the
cost of printing 500 books?
000,450000,45
9090
500
0
500
0

 
C
xdxC
Integral as antiderivative
Example 1.2
If the cost of producing 1 book unit is 90+0.01x,
what is the cost of producing 500 books?
dxxdCx
dx
dC
01.09001.090
500
0
  
Php250,46
200
000,250
000,45
2
90
500
0
2
100
1


x
xC
Integral as antiderivative
Example 1.3
In a certain factory the marginal cost of is
3(q-4)^2 when the level of production is q units.
How much would the total cost increase if
production is increased from 6 to 10?
   
 3
22
4
4343

  
qC
dqqdCq
dq
dC
Integral as antiderivative
Example 1.3
Increase in total cost when production is
increased from 6 to 10.
      dqqCC
2
10
6
43610  
 
Php208
8216264costTotal 3310
6
3

 q
Definite Integral as area between
curves
Example 1.4 (Area between curves)
If the marginal revenue from selling books is
And the marginal cost is
xR
dx
dR
05.01' 
 2
2'  xC
dx
dC
Definite integral as area between
curves
Find the net profit when production is increased
from 1 to 3?
Definite integral as area between
curves
  dxxdxxP
2
3
1
3
1
205.01  
 
 
 
Php22
13
2
205.01
5
1
5
1
3
1
40
1
3
1
40
9
3
1
3
3
12
40
1
2
3
1



 
xxx
dxxxP
Interpretation of graphs
Example 1.5 (Area between curves)
Suppose that t years from now, investment A
will generate a profit per year according to
While investment B will generate a profit per
year according to
  2
1 5' ttP 
  ttP 520'2 
Interpretation of graphs
a. What information is revealed by the two
functions?
Graphs and definite integral
b. What is the accumulated profit of investment
A after 6 years?
c. What is the accumulated profit of investment
B after 6 years?
Definite integral and area under the
curve
Php1027230
55
1
6
0
3
3
12
6
0
1

 
P
ttdttP
Definite integral and area under the
curve
Php21090120
20520
2
6
0
2
2
5
6
0
2

 
P
ttdttP
Definite integral and area between
curves
c. Identify the region in the graph which
represents the excess profit earned by
investment A over investment B over 6 years.
Definite integral and area between
curves
108729090
15515
5520
6
0
3
3
12
2
52
6
0
2
6
0
6
0





n
n
n
P
tttdtttP
dttdttP

Application of integration

  • 1.
  • 2.
    Derivative as rateof change • Measurements described as a rate of change is a derivative • Key words: Cost PER unit produced, profit PER unit sold Cost FOR EVERY YEAR, value PER year Marginal cost: additional cost for producing one extra item of a product. Additional cost per unit of production
  • 3.
    Derivative as rateof change Key words: Marginal revenue: additional revenue by increasing product sales by 1 unit: extra revenue PER 1 unit increase in sales Marginal profit: additional profit for each unit sold: MP=MR-MC.
  • 4.
    Demand curve asa rate of change Demand function: Quantity a consumer is willing to buy for each unit increase in price
  • 5.
    Supply curve asa rate of change Supply function The quantity of goods a producer is willing to produce for every unit increase in price
  • 6.
    Integral as Antiderivative    dxxFxF '      axdxaC adxdCa dx dC COST PER UNIT PRODUCED
  • 7.
    Integral as anantiderivative Example 1.1 If cost of printing 1 book is 90 pesos, what is the cost of printing 500 books? xC dxdC dx dC 90 9090     Php000,4550090 500At   C x
  • 8.
    Integral as antiderivative Ifcost of printing 1 book is 90 pesos, what is the cost of printing 500 books? 000,450000,45 9090 500 0 500 0    C xdxC
  • 9.
    Integral as antiderivative Example1.2 If the cost of producing 1 book unit is 90+0.01x, what is the cost of producing 500 books? dxxdCx dx dC 01.09001.090 500 0    Php250,46 200 000,250 000,45 2 90 500 0 2 100 1   x xC
  • 10.
    Integral as antiderivative Example1.3 In a certain factory the marginal cost of is 3(q-4)^2 when the level of production is q units. How much would the total cost increase if production is increased from 6 to 10?      3 22 4 4343     qC dqqdCq dq dC
  • 11.
    Integral as antiderivative Example1.3 Increase in total cost when production is increased from 6 to 10.       dqqCC 2 10 6 43610     Php208 8216264costTotal 3310 6 3   q
  • 12.
    Definite Integral asarea between curves Example 1.4 (Area between curves) If the marginal revenue from selling books is And the marginal cost is xR dx dR 05.01'   2 2'  xC dx dC
  • 13.
    Definite integral asarea between curves Find the net profit when production is increased from 1 to 3?
  • 14.
    Definite integral asarea between curves   dxxdxxP 2 3 1 3 1 205.01         Php22 13 2 205.01 5 1 5 1 3 1 40 1 3 1 40 9 3 1 3 3 12 40 1 2 3 1      xxx dxxxP
  • 15.
    Interpretation of graphs Example1.5 (Area between curves) Suppose that t years from now, investment A will generate a profit per year according to While investment B will generate a profit per year according to   2 1 5' ttP    ttP 520'2 
  • 16.
    Interpretation of graphs a.What information is revealed by the two functions?
  • 17.
    Graphs and definiteintegral b. What is the accumulated profit of investment A after 6 years? c. What is the accumulated profit of investment B after 6 years?
  • 18.
    Definite integral andarea under the curve Php1027230 55 1 6 0 3 3 12 6 0 1    P ttdttP
  • 19.
    Definite integral andarea under the curve Php21090120 20520 2 6 0 2 2 5 6 0 2    P ttdttP
  • 20.
    Definite integral andarea between curves c. Identify the region in the graph which represents the excess profit earned by investment A over investment B over 6 years.
  • 21.
    Definite integral andarea between curves 108729090 15515 5520 6 0 3 3 12 2 52 6 0 2 6 0 6 0      n n n P tttdtttP dttdttP