Download as PDF, PPTX


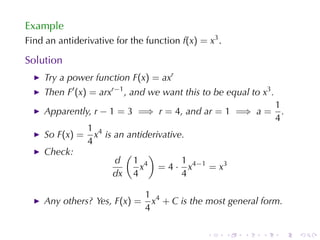
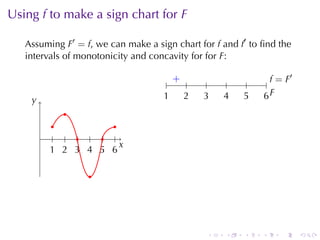
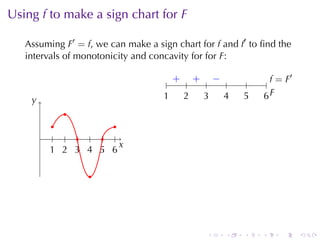
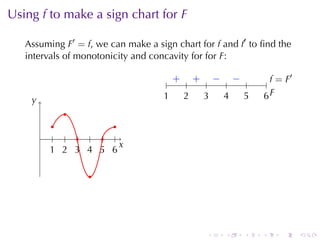
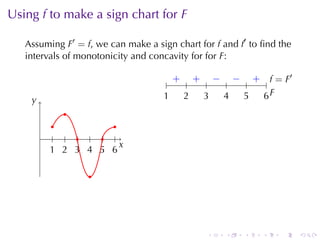
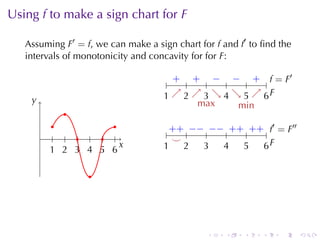
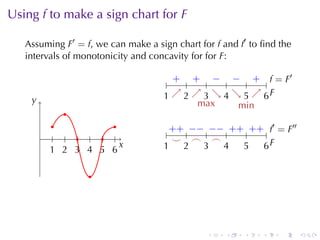
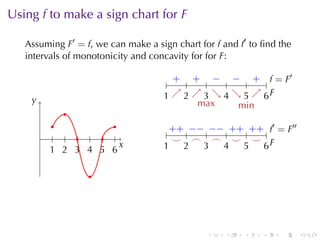
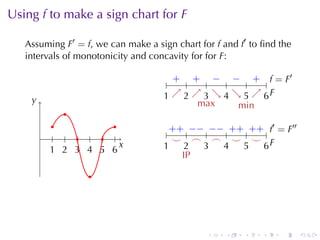
![Why the MVT is the MITC
Most Important Theorem In Calculus!
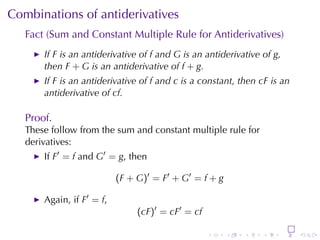
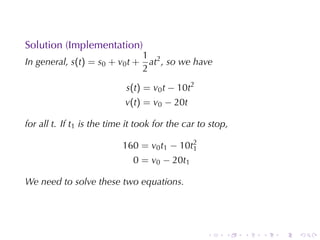
Theorem
Let f′ = 0 on an interval (a, b). Then f is constant on (a, b).
Proof.
Pick any points x and y in (a, b) with x < y. Then f is continuous
on [x, y] and differentiable on (x, y). By MVT there exists a point
z in (x, y) such that
f(y) − f(x)
= f′ (z) = 0.
y−x
So f(y) = f(x). Since this is true for all x and y in (a, b), then f is
constant.
. . . . . .](https://image.slidesharecdn.com/lesson23-antiderivatives027slides-091120065702-phpapp02/85/Lesson-23-Antiderivatives-2-320.jpg)


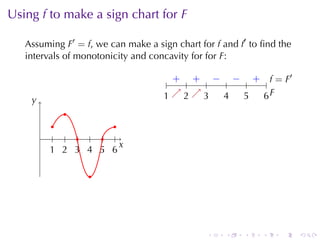
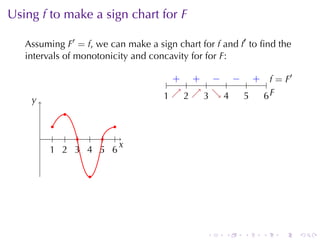
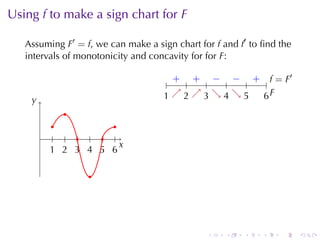

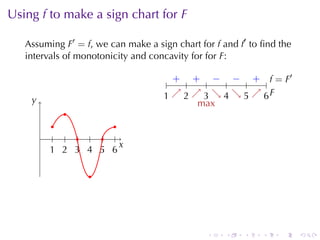


This document discusses antiderivatives in calculus, highlighting key theorems and properties, including the Mean Value Theorem and rules for finding antiderivatives of power, exponential, and trigonometric functions. It also provides examples and outlines the combinations of antiderivatives, emphasizing applications such as rectilinear motion. Important facts include the power rule for antiderivatives and the significance of constants of integration.


![Getting Started with Apache Spark: Big Data Made Simple [Free Meetup]](https://cdn.slidesharecdn.com/ss_thumbnails/apachesparkgettingstarted-260203175547-8361bcc3-thumbnail.jpg?width=640&height=640&fit=bounds)


