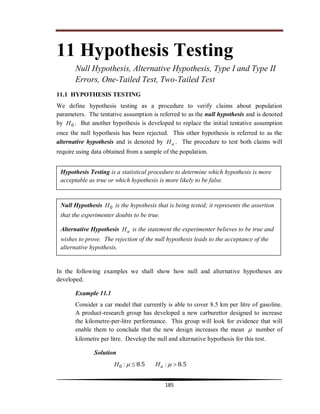
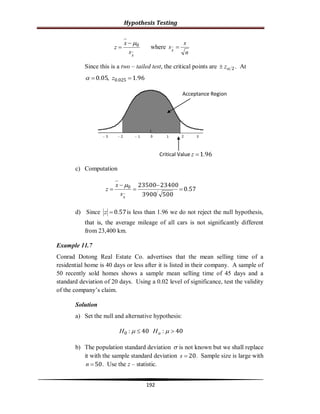
SlideShare a Scribd company logo
1 of 14
Download to read offline
Hypothesis Testing
185
11 Hypothesis Testing
Null Hypothesis, Alternative Hypothesis, Type I and Type II
Errors, One-Tailed Test, Two-Tailed Test
11.1 HYPOTHESIS TESTING
We define hypothesis testing as a procedure to verify claims about population
parameters. The tentative assumption is referred to as the null hypothesis and is denoted
by 0H . But another hypothesis is developed to replace the initial tentative assumption
once the null hypothesis has been rejected. This other hypothesis is referred to as the
alternative hypothesis and is denoted by aH . The procedure to test both claims will
require using data obtained from a sample of the population.
In the following examples we shall show how null and alternative hypotheses are
developed.
Example 11.1
Consider a car model that currently is able to cover 8.5 km per litre of gasoline.
A product-research group has developed a new carburettor designed to increase
the kilometre-per-litre performance. This group will look for evidence that will
enable them to conclude that the new design increases the mean  number of
kilometre per litre. Develop the null and alternative hypothesis for this test.
Solution
58580 .:.:   aHH
Hypothesis Testing is a statistical procedure to determine which hypothesis is more
acceptable as true or which hypothesis is more likely to be false.
Null Hypothesis 0H is the hypothesis that is being tested; it represents the assertion
that the experimenter doubts to be true.
Alternative Hypothesis aH is the statement the experimenter believes to be true and
wishes to prove. The rejection of the null hypothesis leads to the acceptance of the
alternative hypothesis.
Hypothesis Testing
186
In this situation, the researchers wish to see their claims about the new
carburettor validated. Hence, their claim about the new carburettor should
be the alternative hypothesis. And the existing kilometre-per-litre
performance is the null hypothesis.
:0H The mean kilometre-per-litre performance of the new
carburettor is less than or equal to 8.5.
:aH The mean kilometre-per-litre performance of the new
carburettor is greater than 8.5.
Example 11.2
A manufacturer of soft drinks states that the 2-litre containers of its products have
an average content of at least 67.6 fluid ounces. A sample of 2-litre containers
will be obtained, and their contents will be measured to test the manufacturer’s
statement. Develop the null and alternative hypotheses for this test.
Solution
6676670 .;.:   aHH
The null hypothesis is the manufacturer’s claims about their product, that
is, the mean content of the containers is at least 67.6 fluid ounces. The
alternative hypothesis is: the mean content is less than 67.6.
0H : The mean content of the containers for soft drink is greater
than or equal to 67.7 fluid ounces.
:aH The mean content of the containers for soft drink is less than
67.7 fluid ounces.
Example 11.3
The manager of Bantugon Resort & Hotel stated that their guests spend on
average 1,500Php or less during their stay. One member of the hotel accounting
staff has noticed that the total charges for guest bills have been increasing in
recent months. If the accounting staff wishes to test the manager’s claims by
collecting samples from their guest bills how should he formulate the hypotheses?
Solution
150015000   :: aHH
Hypothesis Testing
187
:0H The mean amount guests spend in the resort is less than or
equal to 1500Php.
:aH The mean amount guests spend in the resort is greater than
1500Php
11.2 TYPE I ERROR AND TYPE II ERROR
The null and alternative hypotheses are competing statements about the true state of a
situation. They are mutually exclusive statements: either 0H is true or aH is true, but not
both. It would be nice if the process of hypothesis testing always leads us to accept a
statement which is in fact true. But this result is not always possible. Bear in mind,
hypothesis testing is based on information drawn from samples, therefore it makes sense
to allow for the possibility of errors. Table 11.1 gives a summary of the correct decisions
and the errors in hypothesis testing.
The first column shows what happens when we accept 0H . If 0H is true, and we accept
it, then our decision is correct. But if we accept 0H when in fact, aH is true then we
make a Type II error.
The second column shows what happens when we reject 0H . If we reject 0H when in
fact, 0H is true then , we commit a Type I error. If we reject 0H and aH is true then, we
make the correct decision.
Since we cannot eliminate the possibility of errors in hypothesis testing, we must
consider the probability of their occurrence. The probabilities of making the two errors
are defined as follows:
Correct
Decision
Type I
Error
Type II
Error
Correct
Decision
Accept H0 Reject H0
H0 is true
Ha is true
Table 11.1 Errors and Correct Decisions in
Hypothesis Testing
Hypothesis Testing
188
The probability of making a Type I error  is also referred to as the level of significance.
Example 11.4
The label on a 3 quart container of orange juice claims that the orange juice
contains on average, 1 gram of fat or less.
a) Construct the appropriate null and alternative hypothesis.
Solution
10 :H 1:aH
:0H The mean amount of fat in the orange juice in a 3 quart container is
less than or equal to 1 gram.
aH : The mean amount of fat in the orange juice in a 3 quart container is
greater than 1 gram
b) What is Type I error in this situation?
Answer
Type I error involves rejecting the claim that the mean amount of fat in the
orange juice in a 3 quart container is less than or equal to 1 gram, when in
fact, it is true. (or claiming 1:aH when it is not true)
c) What is Type II error in this situation?
Answer
Type II error involves accepting the claim that the mean amount of fat in
the orange juice in a 3 quart container is less than or equal to 1 gram,
when in fact, it is greater than 1 gram. (or claiming 10 :H is true when
it is not true)
Example 11.5
Mumbai Carpet House has been selling an average of 100,000Php of carpeting a
week. Sofia Visco, the firm’s marketing manager, has proposed a compensation
 the probability of making a Type I error
 the probability of making a Type II error
Hypothesis Testing
189
plan with a new selling incentive scheme. Mrs. Visco plans to use a trial selling
period to demonstrate that the new incentive scheme will increase the average
sales per salesperson.
a) Develop an appropriate null and alternative hypothesis.
Solution
1000000 H 100000aH
:0H The mean sales of Mumbai Carpet House is less than or equal to
100000Php even with the new incentive scheme.
:aH The new incentive scheme will produce a new mean sales which is
greater than 100000Php.
b) What is Type I error in this situation?
Answer
Type I error in this case involves rejecting the null hypothesis when in
fact, the mean sales remains less than or equal to 100000Php. As a
consequence, the company might adapt the new incentive scheme when in
fact it will not help increase sales.
c) What is the Type II error in this situation?
Answer
Type II error involves accepting the null hypothesis, when in fact, it is not
true. That is, the new incentive scheme does help increase sales. The
consequence of Type II error is the company will miss an opportunity to
improve their sales by failing to implement the new incentive scheme.
STEPS IN HYPOTHESIS TESTING
1. State the null hypothesis 0H and the alternative hypothesis aH
2. Choose the level of significance  .
3. Choose the test statistic and set the critical region.
4. Collect data and compute the test statistic based on the sample data.
5. Decide: Reject 0H if the value of the test statistic falls in the critical region.
If it falls outside, then accept 0H .
Hypothesis Testing
190
11.3 One-Tailed Hypothesis Test for Population Mean
A one – tailed test of hypothesis for the population mean is a test which specifies only
one tail of the distribution as the rejection region, either to the left tail or right tail.
Setting up the null and alternative hypotheses can take on the following forms:
yxayx
yxayx
a
a
uHuuH
uHuuH
cHcH
cHcH








::
::
::
::
0
0
0
0
11.4 Two-Tailed Hypothesis Test for Population Mean
A two – tailed test of hypothesis for the population mean is a test which specifies both
tails of the distribution as the rejection region. Setting up the null and alternative
hypothesis can take on the following forms:
yxayx
a
HH
cHcH




::
::
0
0
A test statistic is a statistic whose value is calculated from sample measurements and
on which the statistical decision will be based.
The critical region is the set of values of the test statistic for which the null hypothesis
will be rejected. The acceptance region is the set of values of the test statistic for
which the null hypothesis will be accepted.
The critical value of the test statistic is the demarcation line between the critical and
acceptance regions.
Test Statistic
a. ( Large Sample ) If  is known and 30n , the test statistic is
x
x
z

0
 where
nx

 
b) ( Small Sample ) If  is unknown and 30n , the test statistic is
x
s
x
t 0
 where
n
sx


With 1 nv degrees of freedom (t – statistic)
Hypothesis Testing
191
The z – statistic is to be applied for a large sample size, that is, 30n . When the sample
size less than 30, use the statistict .
Example 11.6
A random sample of 500 car owners shows that the average mileage of a car is
23,500 km a year with a standard deviation of 3,900 km. Test the hypothesis that
the average mileage of a car is 23,400 km a year at 5% level of significance.
Solution
a) Set the null and alternative hypotheses.
40023400230 ,:,:   aHH
b) The population standard deviation  is not known but we can replace
it with the sample standard deviation s. The sample size is also large.
We shall use the z – statistic.
Critical Region
a) For one – tailed hypothesis test:
z – test
0
00




:
:
aH
H
Rejection Rule at a Level of Significance of  : Reject zzH if0
z – test
0
00




:
:
aH
H
Rejection Rule at a Level of Significance of  : Reject zzH if0
b) For two – tailed test:
z – test
0
00




:
:
aH
H
Rejection Rule at a Level of Significance of  :
Reject 220  zzzzH  andif
Hypothesis Testing
192
x
s
x
z 0
 where
n
s
sx

Since this is a two – tailed test, the critical points are 2z . At
961050 0250 .,. .  z
c) Computation
570
5003900
23400235000
.




x
s
x
z

d) Since 570.z is less than 1.96 we do not reject the null hypothesis,
that is, the average mileage of all cars is not significantly different
from 23,400 km.
Example 11.7
Conrad Dotong Real Estate Co. advertises that the mean selling time of a
residential home is 40 days or less after it is listed in their company. A sample of
50 recently sold homes shows a sample mean selling time of 45 days and a
standard deviation of 20 days. Using a 0.02 level of significance, test the validity
of the company’s claim.
Solution
a) Set the null and alternative hypothesis:
40400   :: aHH
b) The population standard deviation  is not known but we shall replace
it with the sample standard deviation 20s . Sample size is large with
50n . Use the z – statistic.
Critical Value 961.z
Acceptance Region
Hypothesis Testing
193
This is a one – tailed test with 020. . The critical value is
052020 .. z .
c) Computation
771
5020
40450
.




x
s
x
z

d) Since 771.z is less than 2.05, we do not reject the null hypothesis.
A sample selling time of 45 days is not significantly greater than the
population mean of 40 days at 0.02 level of confidence.
Example 11.8
The height of adults in a certain town is found to have a mean of 166.17 cm with
standard deviation of 5.89 cm. A random sample of 144 adults in the slum
section of the town is discovered to have a mean height of 164.65 cm. Does this
height indicate that the residents of the slum area are significantly shorter in
height at 0.05 level of significance?
Solution
a) Set the null and alternative hypothesis.
cm.:cm.: 17166171660   aHH
b) The population standard deviation  is cm.895 , and the sample size
is large at 144n . Use the z – statistic.
This is also a one-tailed test with 050. . The critical point is
651050 .. z . We shall reject 0H if 651.z .
Critical Value 052.z
Acceptance Region
Hypothesis Testing
194
c) Computation
933
114895
17166651640
.
.
..





x
x
z


d) Since 933.z is less than 651. , we reject the null hypothesis.
This means the height of adults in the slum section of the town is
significantly lower than 166.17 cm at 0.05 level of significance.
Example 11.9
The average aluminium concentration recovered from samples of aluminium
measurements from 20 different locations was discovered to be 2.8 grams/ml with
standard deviation of 0.3 gram/ml. Does this suggest that the average amount of
aluminium in the river is significantly more than 2.5 grams/ml at 0.05 level of
significance?
Solution
a) Set the null and alternative hypotheses.
grams/ml.:grams/ml.: 52520   aHH
b) We shall use the sample standard deviation 30.s . Since the sample
size is small 20n , we shall use the t – statistic.
x
s
x
t 0
 where
n
sx


With 1 nv degrees of freedom.
Critical Value 651.z
Acceptance Region
Hypothesis Testing
195
This is a one – tailed test, and the critical point at 19 degrees of freedom is
7291050 .. t (see t-distribution table)
c) Computations
474
2030
52820
.
.
..





x
s
x
t

d) Since 474.t is greater than the critical point of 1.729, the null
hypothesis has to be rejected. This means the average amount of
aluminium in the river is significantly greater than 2.5 grams/ml at
0.05 level of significance.
Critical Value 7291.t
Acceptance Region
Hypothesis Testing
196
Hypothesis Testing
197
Exercise 11.1 Hypothesis Testing: Null and Alternative Hypotheses
Complete the following exercises neatly and orderly.
1. The coffee dispenser of LPU canteen was readjusted. The canteen manager
wished to know if the dispenser is dispensing the right quantity of coffee. He
took a sample of 50 cups filled by the dispenser. The dispenser can be
deemed in good condition only if the average fill per cup is 8 ounces.
Define the appropriate null and alternative hypotheses for this situation.
0H :
aH :
2. A triathlete plans to reduce his weight to improve his racing performance in
triathlon races. He heard about a food supplement which is marketed to be an
effective supplement for weight loss. The food supplement however, is very
expensive. He talked to people who had tried the supplement themselves and
decided that he will use the supplement only if the proportion of people who
would claim it to be effective is greater than 60%.
Define the appropriate null and alternative hypotheses for this situation.
0H :
aH :
Name Date
Course-Section Score
Hypothesis Testing
198
3. Bantugon Pharmaceuticals claims that its new medicine is at least 90%
effective in relieving an allergy for a period of 8 hours. Students in the
medical technology program of LPU Batangas wish to test this claim.
Define the appropriate null and alternative hypotheses.
0H :
aH :

More Related Content

What's hot

Estimation in statistics
Estimation in statisticsEstimation in statistics
Estimation in statisticsRabea Jamal
 
Testing of hypotheses
Testing of hypothesesTesting of hypotheses
Testing of hypothesesRajThakuri
 
Hypothesis Test Bank with Solutions
Hypothesis Test Bank with SolutionsHypothesis Test Bank with Solutions
Hypothesis Test Bank with SolutionsBody of Knowledge
 
RELATION BETWEEN MEAN, MEDIAN AND MODE IN BIOSTATIC
RELATION BETWEEN MEAN, MEDIAN AND MODE IN BIOSTATICRELATION BETWEEN MEAN, MEDIAN AND MODE IN BIOSTATIC
RELATION BETWEEN MEAN, MEDIAN AND MODE IN BIOSTATICMuhammad Amir Sohail
 
Applications of regression analysis - Measurement of validity of relationship
Applications of regression analysis - Measurement of validity of relationshipApplications of regression analysis - Measurement of validity of relationship
Applications of regression analysis - Measurement of validity of relationshipRithish Kumar
 
statistical estimation
statistical estimationstatistical estimation
statistical estimationAmish Akbar
 
One sided or one-tailed tests
One sided or one-tailed testsOne sided or one-tailed tests
One sided or one-tailed testsHasnain Baber
 
Test of hypothesis
Test of hypothesisTest of hypothesis
Test of hypothesisvikramlawand
 
Chapter 7 – Confidence Intervals And Sample Size
Chapter 7 – Confidence Intervals And Sample SizeChapter 7 – Confidence Intervals And Sample Size
Chapter 7 – Confidence Intervals And Sample SizeRose Jenkins
 
8.2 critical region
8.2 critical region8.2 critical region
8.2 critical regionleblance
 
quasi-experimental research design
quasi-experimental research designquasi-experimental research design
quasi-experimental research designvohuynhthanh
 

What's hot (20)

Estimation in statistics
Estimation in statisticsEstimation in statistics
Estimation in statistics
 
Testing of hypotheses
Testing of hypothesesTesting of hypotheses
Testing of hypotheses
 
Hypothesis testing
Hypothesis testingHypothesis testing
Hypothesis testing
 
Hypothesis Test Bank with Solutions
Hypothesis Test Bank with SolutionsHypothesis Test Bank with Solutions
Hypothesis Test Bank with Solutions
 
RELATION BETWEEN MEAN, MEDIAN AND MODE IN BIOSTATIC
RELATION BETWEEN MEAN, MEDIAN AND MODE IN BIOSTATICRELATION BETWEEN MEAN, MEDIAN AND MODE IN BIOSTATIC
RELATION BETWEEN MEAN, MEDIAN AND MODE IN BIOSTATIC
 
Hypothesis testing
Hypothesis testingHypothesis testing
Hypothesis testing
 
Population and sample mean
Population and sample meanPopulation and sample mean
Population and sample mean
 
Applications of regression analysis - Measurement of validity of relationship
Applications of regression analysis - Measurement of validity of relationshipApplications of regression analysis - Measurement of validity of relationship
Applications of regression analysis - Measurement of validity of relationship
 
statistical estimation
statistical estimationstatistical estimation
statistical estimation
 
Ob 8
Ob 8Ob 8
Ob 8
 
One sided or one-tailed tests
One sided or one-tailed testsOne sided or one-tailed tests
One sided or one-tailed tests
 
Hypothesis Testing
Hypothesis TestingHypothesis Testing
Hypothesis Testing
 
Test of hypothesis
Test of hypothesisTest of hypothesis
Test of hypothesis
 
Chapter 7 – Confidence Intervals And Sample Size
Chapter 7 – Confidence Intervals And Sample SizeChapter 7 – Confidence Intervals And Sample Size
Chapter 7 – Confidence Intervals And Sample Size
 
Normal Distribution.pptx
Normal Distribution.pptxNormal Distribution.pptx
Normal Distribution.pptx
 
8.2 critical region
8.2 critical region8.2 critical region
8.2 critical region
 
6. point and interval estimation
6. point and interval estimation6. point and interval estimation
6. point and interval estimation
 
Sampling & Sampling Distribtutions
Sampling & Sampling DistribtutionsSampling & Sampling Distribtutions
Sampling & Sampling Distribtutions
 
Chapter10
Chapter10Chapter10
Chapter10
 
quasi-experimental research design
quasi-experimental research designquasi-experimental research design
quasi-experimental research design
 

Viewers also liked

Scientific methodpowerpoint
Scientific methodpowerpointScientific methodpowerpoint
Scientific methodpowerpointBioGirl27
 
Introduction to measures of relationship: covariance, and Pearson r
Introduction to measures of relationship: covariance, and Pearson rIntroduction to measures of relationship: covariance, and Pearson r
Introduction to measures of relationship: covariance, and Pearson rIvan Jacob Pesigan
 
Regulation of gene expression in prokaryotes
Regulation of gene expression in prokaryotesRegulation of gene expression in prokaryotes
Regulation of gene expression in prokaryotessherafatian
 
Measures of correlation (pearson's r correlation coefficient and spearman rho)
Measures of correlation (pearson's r correlation coefficient and spearman rho)Measures of correlation (pearson's r correlation coefficient and spearman rho)
Measures of correlation (pearson's r correlation coefficient and spearman rho)Jyl Matz
 
Research problem, criteria and characteristics
Research problem, criteria and characteristicsResearch problem, criteria and characteristics
Research problem, criteria and characteristicsZakiul Alam
 
Introduction to hypothesis testing ppt @ bec doms
Introduction to hypothesis testing ppt @ bec domsIntroduction to hypothesis testing ppt @ bec doms
Introduction to hypothesis testing ppt @ bec domsBabasab Patil
 
Characteristics and criteria of good research
Characteristics and criteria of good researchCharacteristics and criteria of good research
Characteristics and criteria of good researchA B
 
Research problem, hypothesis & conceptual framework
Research problem, hypothesis & conceptual frameworkResearch problem, hypothesis & conceptual framework
Research problem, hypothesis & conceptual frameworkMeghana Sudhir
 
Hypothesis
HypothesisHypothesis
Hypothesis17somya
 

Viewers also liked (20)

Hypothesis testing - Primer
Hypothesis testing - PrimerHypothesis testing - Primer
Hypothesis testing - Primer
 
Scientific methodpowerpoint
Scientific methodpowerpointScientific methodpowerpoint
Scientific methodpowerpoint
 
Binary Logistic Regression Exercise
Binary Logistic Regression ExerciseBinary Logistic Regression Exercise
Binary Logistic Regression Exercise
 
Business research method
Business research methodBusiness research method
Business research method
 
Measuring relationships
Measuring relationshipsMeasuring relationships
Measuring relationships
 
Introduction to measures of relationship: covariance, and Pearson r
Introduction to measures of relationship: covariance, and Pearson rIntroduction to measures of relationship: covariance, and Pearson r
Introduction to measures of relationship: covariance, and Pearson r
 
Coefficient of correlation
Coefficient of correlationCoefficient of correlation
Coefficient of correlation
 
Regulation of gene expression in prokaryotes
Regulation of gene expression in prokaryotesRegulation of gene expression in prokaryotes
Regulation of gene expression in prokaryotes
 
Measures of correlation (pearson's r correlation coefficient and spearman rho)
Measures of correlation (pearson's r correlation coefficient and spearman rho)Measures of correlation (pearson's r correlation coefficient and spearman rho)
Measures of correlation (pearson's r correlation coefficient and spearman rho)
 
Pearson Correlation
Pearson CorrelationPearson Correlation
Pearson Correlation
 
Research problem, criteria and characteristics
Research problem, criteria and characteristicsResearch problem, criteria and characteristics
Research problem, criteria and characteristics
 
Introduction to hypothesis testing ppt @ bec doms
Introduction to hypothesis testing ppt @ bec domsIntroduction to hypothesis testing ppt @ bec doms
Introduction to hypothesis testing ppt @ bec doms
 
Characteristics and criteria of good research
Characteristics and criteria of good researchCharacteristics and criteria of good research
Characteristics and criteria of good research
 
Research problem, hypothesis & conceptual framework
Research problem, hypothesis & conceptual frameworkResearch problem, hypothesis & conceptual framework
Research problem, hypothesis & conceptual framework
 
Chapter 3-THE RESEARCH PROBLEM
Chapter 3-THE RESEARCH PROBLEMChapter 3-THE RESEARCH PROBLEM
Chapter 3-THE RESEARCH PROBLEM
 
Correlation ppt...
Correlation ppt...Correlation ppt...
Correlation ppt...
 
Hypothesis
HypothesisHypothesis
Hypothesis
 
Hypothesis
HypothesisHypothesis
Hypothesis
 
Types of hypotheses
Types of hypothesesTypes of hypotheses
Types of hypotheses
 
Research problem
Research problemResearch problem
Research problem
 

Similar to 11 hypothesis testing

STA101 presentations.pdf
STA101 presentations.pdfSTA101 presentations.pdf
STA101 presentations.pdfLabibHossain6
 
1667390753_Lind Chapter 10-14.pdf
1667390753_Lind Chapter 10-14.pdf1667390753_Lind Chapter 10-14.pdf
1667390753_Lind Chapter 10-14.pdfAriniputriLestari
 
Hypothesis Testing Lesson 1
Hypothesis Testing Lesson 1Hypothesis Testing Lesson 1
Hypothesis Testing Lesson 1yhchung
 
8. testing of hypothesis for variable & attribute data
8. testing of hypothesis for variable & attribute  data8. testing of hypothesis for variable & attribute  data
8. testing of hypothesis for variable & attribute dataHakeem-Ur- Rehman
 
HypothesisTesting.pptx
HypothesisTesting.pptxHypothesisTesting.pptx
HypothesisTesting.pptxPriyaVijay35
 
Chapter 11
Chapter 11Chapter 11
Chapter 11bmcfad01
 
Hypothesis testing
Hypothesis testingHypothesis testing
Hypothesis testingNirajan Bam
 
Chapter 10 One sample test of hypothesis.ppt
Chapter 10 One sample test of hypothesis.pptChapter 10 One sample test of hypothesis.ppt
Chapter 10 One sample test of hypothesis.pptrhanik1596
 
Chapter 10
Chapter 10Chapter 10
Chapter 10bmcfad01
 
Lecture6 Applied Econometrics and Economic Modeling
Lecture6 Applied Econometrics and Economic ModelingLecture6 Applied Econometrics and Economic Modeling
Lecture6 Applied Econometrics and Economic Modelingstone55
 
Statr session 17 and 18 (ASTR)
Statr session 17 and 18 (ASTR)Statr session 17 and 18 (ASTR)
Statr session 17 and 18 (ASTR)Ruru Chowdhury
 
Statr session 17 and 18
Statr session 17 and 18Statr session 17 and 18
Statr session 17 and 18Ruru Chowdhury
 
Statistics Hypothesis Testing- CHAPTER -3.pptx
Statistics Hypothesis Testing- CHAPTER -3.pptxStatistics Hypothesis Testing- CHAPTER -3.pptx
Statistics Hypothesis Testing- CHAPTER -3.pptxFekaduAman
 
06StatisticalInference.pptx
06StatisticalInference.pptx06StatisticalInference.pptx
06StatisticalInference.pptxvijaykumar838577
 

Similar to 11 hypothesis testing (20)

Hypothesis Testing
Hypothesis TestingHypothesis Testing
Hypothesis Testing
 
STA101 presentations.pdf
STA101 presentations.pdfSTA101 presentations.pdf
STA101 presentations.pdf
 
Chapter10
Chapter10Chapter10
Chapter10
 
Chapter 10
Chapter 10Chapter 10
Chapter 10
 
1667390753_Lind Chapter 10-14.pdf
1667390753_Lind Chapter 10-14.pdf1667390753_Lind Chapter 10-14.pdf
1667390753_Lind Chapter 10-14.pdf
 
Hypothesis Testing Lesson 1
Hypothesis Testing Lesson 1Hypothesis Testing Lesson 1
Hypothesis Testing Lesson 1
 
8. testing of hypothesis for variable & attribute data
8. testing of hypothesis for variable & attribute  data8. testing of hypothesis for variable & attribute  data
8. testing of hypothesis for variable & attribute data
 
HypothesisTesting.pptx
HypothesisTesting.pptxHypothesisTesting.pptx
HypothesisTesting.pptx
 
Chapter 11
Chapter 11Chapter 11
Chapter 11
 
Hypothesis testing
Hypothesis testingHypothesis testing
Hypothesis testing
 
Hypothesis
HypothesisHypothesis
Hypothesis
 
Chapter 10 One sample test of hypothesis.ppt
Chapter 10 One sample test of hypothesis.pptChapter 10 One sample test of hypothesis.ppt
Chapter 10 One sample test of hypothesis.ppt
 
Chapter 10
Chapter 10Chapter 10
Chapter 10
 
Lecture6 Applied Econometrics and Economic Modeling
Lecture6 Applied Econometrics and Economic ModelingLecture6 Applied Econometrics and Economic Modeling
Lecture6 Applied Econometrics and Economic Modeling
 
Chapter 10
Chapter 10Chapter 10
Chapter 10
 
Statr session 17 and 18 (ASTR)
Statr session 17 and 18 (ASTR)Statr session 17 and 18 (ASTR)
Statr session 17 and 18 (ASTR)
 
Statr session 17 and 18
Statr session 17 and 18Statr session 17 and 18
Statr session 17 and 18
 
Hypothesis Testing
Hypothesis TestingHypothesis Testing
Hypothesis Testing
 
Statistics Hypothesis Testing- CHAPTER -3.pptx
Statistics Hypothesis Testing- CHAPTER -3.pptxStatistics Hypothesis Testing- CHAPTER -3.pptx
Statistics Hypothesis Testing- CHAPTER -3.pptx
 
06StatisticalInference.pptx
06StatisticalInference.pptx06StatisticalInference.pptx
06StatisticalInference.pptx
 

More from Juan Apolinario Reyes (20)

1.1 Origin Universe
1.1 Origin Universe1.1 Origin Universe
1.1 Origin Universe
 
1.11 mathinourworld
1.11 mathinourworld1.11 mathinourworld
1.11 mathinourworld
 
1.10 cell
1.10 cell1.10 cell
1.10 cell
 
Solution key to mst prelim
Solution key to mst prelimSolution key to mst prelim
Solution key to mst prelim
 
Biology as science
Biology as scienceBiology as science
Biology as science
 
Biology 101
Biology 101Biology 101
Biology 101
 
Application of integration
Application of integrationApplication of integration
Application of integration
 
Current electricity (electricity)
Current electricity (electricity)Current electricity (electricity)
Current electricity (electricity)
 
Electricity
ElectricityElectricity
Electricity
 
Magnetism
MagnetismMagnetism
Magnetism
 
Light
LightLight
Light
 
Light
LightLight
Light
 
Wave motion
Wave motionWave motion
Wave motion
 
Sound waves
Sound wavesSound waves
Sound waves
 
8 random variable
8 random variable8 random variable
8 random variable
 
Continuation chain rule and derivative of trigo functions
Continuation chain rule and derivative of trigo functionsContinuation chain rule and derivative of trigo functions
Continuation chain rule and derivative of trigo functions
 
Z test, f-test,etc
Z test, f-test,etcZ test, f-test,etc
Z test, f-test,etc
 
Countingprinciple
CountingprincipleCountingprinciple
Countingprinciple
 
Introduction to probability
Introduction to probabilityIntroduction to probability
Introduction to probability
 
Other correlation coefficients
Other correlation coefficientsOther correlation coefficients
Other correlation coefficients
 

Recently uploaded

ACC 2024 Chronicles. Cardiology. Exam.pdf
ACC 2024 Chronicles. Cardiology. Exam.pdfACC 2024 Chronicles. Cardiology. Exam.pdf
ACC 2024 Chronicles. Cardiology. Exam.pdfSpandanaRallapalli
 
Gas measurement O2,Co2,& ph) 04/2024.pptx
Gas measurement O2,Co2,& ph) 04/2024.pptxGas measurement O2,Co2,& ph) 04/2024.pptx
Gas measurement O2,Co2,& ph) 04/2024.pptxDr.Ibrahim Hassaan
 
ENGLISH 7_Q4_LESSON 2_ Employing a Variety of Strategies for Effective Interp...
ENGLISH 7_Q4_LESSON 2_ Employing a Variety of Strategies for Effective Interp...ENGLISH 7_Q4_LESSON 2_ Employing a Variety of Strategies for Effective Interp...
ENGLISH 7_Q4_LESSON 2_ Employing a Variety of Strategies for Effective Interp...JhezDiaz1
 
HỌC TỐT TIẾNG ANH 11 THEO CHƯƠNG TRÌNH GLOBAL SUCCESS ĐÁP ÁN CHI TIẾT - CẢ NĂ...
HỌC TỐT TIẾNG ANH 11 THEO CHƯƠNG TRÌNH GLOBAL SUCCESS ĐÁP ÁN CHI TIẾT - CẢ NĂ...HỌC TỐT TIẾNG ANH 11 THEO CHƯƠNG TRÌNH GLOBAL SUCCESS ĐÁP ÁN CHI TIẾT - CẢ NĂ...
HỌC TỐT TIẾNG ANH 11 THEO CHƯƠNG TRÌNH GLOBAL SUCCESS ĐÁP ÁN CHI TIẾT - CẢ NĂ...Nguyen Thanh Tu Collection
 
Grade 9 Q4-MELC1-Active and Passive Voice.pptx
Grade 9 Q4-MELC1-Active and Passive Voice.pptxGrade 9 Q4-MELC1-Active and Passive Voice.pptx
Grade 9 Q4-MELC1-Active and Passive Voice.pptxChelloAnnAsuncion2
 
Visit to a blind student's school🧑‍🦯🧑‍🦯(community medicine)
Visit to a blind student's school🧑‍🦯🧑‍🦯(community medicine)Visit to a blind student's school🧑‍🦯🧑‍🦯(community medicine)
Visit to a blind student's school🧑‍🦯🧑‍🦯(community medicine)lakshayb543
 
AMERICAN LANGUAGE HUB_Level2_Student'sBook_Answerkey.pdf
AMERICAN LANGUAGE HUB_Level2_Student'sBook_Answerkey.pdfAMERICAN LANGUAGE HUB_Level2_Student'sBook_Answerkey.pdf
AMERICAN LANGUAGE HUB_Level2_Student'sBook_Answerkey.pdfphamnguyenenglishnb
 
Science 7 Quarter 4 Module 2: Natural Resources.pptx
Science 7 Quarter 4 Module 2: Natural Resources.pptxScience 7 Quarter 4 Module 2: Natural Resources.pptx
Science 7 Quarter 4 Module 2: Natural Resources.pptxMaryGraceBautista27
 
Field Attribute Index Feature in Odoo 17
Field Attribute Index Feature in Odoo 17Field Attribute Index Feature in Odoo 17
Field Attribute Index Feature in Odoo 17Celine George
 
Difference Between Search & Browse Methods in Odoo 17
Difference Between Search & Browse Methods in Odoo 17Difference Between Search & Browse Methods in Odoo 17
Difference Between Search & Browse Methods in Odoo 17Celine George
 
INTRODUCTION TO CATHOLIC CHRISTOLOGY.pptx
INTRODUCTION TO CATHOLIC CHRISTOLOGY.pptxINTRODUCTION TO CATHOLIC CHRISTOLOGY.pptx
INTRODUCTION TO CATHOLIC CHRISTOLOGY.pptxHumphrey A Beña
 
Inclusivity Essentials_ Creating Accessible Websites for Nonprofits .pdf
Inclusivity Essentials_ Creating Accessible Websites for Nonprofits .pdfInclusivity Essentials_ Creating Accessible Websites for Nonprofits .pdf
Inclusivity Essentials_ Creating Accessible Websites for Nonprofits .pdfTechSoup
 
ANG SEKTOR NG agrikultura.pptx QUARTER 4
ANG SEKTOR NG agrikultura.pptx QUARTER 4ANG SEKTOR NG agrikultura.pptx QUARTER 4
ANG SEKTOR NG agrikultura.pptx QUARTER 4MiaBumagat1
 
DATA STRUCTURE AND ALGORITHM for beginners
DATA STRUCTURE AND ALGORITHM for beginnersDATA STRUCTURE AND ALGORITHM for beginners
DATA STRUCTURE AND ALGORITHM for beginnersSabitha Banu
 
Q4 English4 Week3 PPT Melcnmg-based.pptx
Q4 English4 Week3 PPT Melcnmg-based.pptxQ4 English4 Week3 PPT Melcnmg-based.pptx
Q4 English4 Week3 PPT Melcnmg-based.pptxnelietumpap1
 
GRADE 4 - SUMMATIVE TEST QUARTER 4 ALL SUBJECTS
GRADE 4 - SUMMATIVE TEST QUARTER 4 ALL SUBJECTSGRADE 4 - SUMMATIVE TEST QUARTER 4 ALL SUBJECTS
GRADE 4 - SUMMATIVE TEST QUARTER 4 ALL SUBJECTSJoshuaGantuangco2
 
Judging the Relevance and worth of ideas part 2.pptx
Judging the Relevance  and worth of ideas part 2.pptxJudging the Relevance  and worth of ideas part 2.pptx
Judging the Relevance and worth of ideas part 2.pptxSherlyMaeNeri
 
ENGLISH6-Q4-W3.pptxqurter our high choom
ENGLISH6-Q4-W3.pptxqurter our high choomENGLISH6-Q4-W3.pptxqurter our high choom
ENGLISH6-Q4-W3.pptxqurter our high choomnelietumpap1
 

Recently uploaded (20)

ACC 2024 Chronicles. Cardiology. Exam.pdf
ACC 2024 Chronicles. Cardiology. Exam.pdfACC 2024 Chronicles. Cardiology. Exam.pdf
ACC 2024 Chronicles. Cardiology. Exam.pdf
 
Gas measurement O2,Co2,& ph) 04/2024.pptx
Gas measurement O2,Co2,& ph) 04/2024.pptxGas measurement O2,Co2,& ph) 04/2024.pptx
Gas measurement O2,Co2,& ph) 04/2024.pptx
 
YOUVE_GOT_EMAIL_PRELIMS_EL_DORADO_2024.pptx
YOUVE_GOT_EMAIL_PRELIMS_EL_DORADO_2024.pptxYOUVE_GOT_EMAIL_PRELIMS_EL_DORADO_2024.pptx
YOUVE_GOT_EMAIL_PRELIMS_EL_DORADO_2024.pptx
 
ENGLISH 7_Q4_LESSON 2_ Employing a Variety of Strategies for Effective Interp...
ENGLISH 7_Q4_LESSON 2_ Employing a Variety of Strategies for Effective Interp...ENGLISH 7_Q4_LESSON 2_ Employing a Variety of Strategies for Effective Interp...
ENGLISH 7_Q4_LESSON 2_ Employing a Variety of Strategies for Effective Interp...
 
HỌC TỐT TIẾNG ANH 11 THEO CHƯƠNG TRÌNH GLOBAL SUCCESS ĐÁP ÁN CHI TIẾT - CẢ NĂ...
HỌC TỐT TIẾNG ANH 11 THEO CHƯƠNG TRÌNH GLOBAL SUCCESS ĐÁP ÁN CHI TIẾT - CẢ NĂ...HỌC TỐT TIẾNG ANH 11 THEO CHƯƠNG TRÌNH GLOBAL SUCCESS ĐÁP ÁN CHI TIẾT - CẢ NĂ...
HỌC TỐT TIẾNG ANH 11 THEO CHƯƠNG TRÌNH GLOBAL SUCCESS ĐÁP ÁN CHI TIẾT - CẢ NĂ...
 
Grade 9 Q4-MELC1-Active and Passive Voice.pptx
Grade 9 Q4-MELC1-Active and Passive Voice.pptxGrade 9 Q4-MELC1-Active and Passive Voice.pptx
Grade 9 Q4-MELC1-Active and Passive Voice.pptx
 
Visit to a blind student's school🧑‍🦯🧑‍🦯(community medicine)
Visit to a blind student's school🧑‍🦯🧑‍🦯(community medicine)Visit to a blind student's school🧑‍🦯🧑‍🦯(community medicine)
Visit to a blind student's school🧑‍🦯🧑‍🦯(community medicine)
 
AMERICAN LANGUAGE HUB_Level2_Student'sBook_Answerkey.pdf
AMERICAN LANGUAGE HUB_Level2_Student'sBook_Answerkey.pdfAMERICAN LANGUAGE HUB_Level2_Student'sBook_Answerkey.pdf
AMERICAN LANGUAGE HUB_Level2_Student'sBook_Answerkey.pdf
 
TataKelola dan KamSiber Kecerdasan Buatan v022.pdf
TataKelola dan KamSiber Kecerdasan Buatan v022.pdfTataKelola dan KamSiber Kecerdasan Buatan v022.pdf
TataKelola dan KamSiber Kecerdasan Buatan v022.pdf
 
Science 7 Quarter 4 Module 2: Natural Resources.pptx
Science 7 Quarter 4 Module 2: Natural Resources.pptxScience 7 Quarter 4 Module 2: Natural Resources.pptx
Science 7 Quarter 4 Module 2: Natural Resources.pptx
 
Field Attribute Index Feature in Odoo 17
Field Attribute Index Feature in Odoo 17Field Attribute Index Feature in Odoo 17
Field Attribute Index Feature in Odoo 17
 
Difference Between Search & Browse Methods in Odoo 17
Difference Between Search & Browse Methods in Odoo 17Difference Between Search & Browse Methods in Odoo 17
Difference Between Search & Browse Methods in Odoo 17
 
INTRODUCTION TO CATHOLIC CHRISTOLOGY.pptx
INTRODUCTION TO CATHOLIC CHRISTOLOGY.pptxINTRODUCTION TO CATHOLIC CHRISTOLOGY.pptx
INTRODUCTION TO CATHOLIC CHRISTOLOGY.pptx
 
Inclusivity Essentials_ Creating Accessible Websites for Nonprofits .pdf
Inclusivity Essentials_ Creating Accessible Websites for Nonprofits .pdfInclusivity Essentials_ Creating Accessible Websites for Nonprofits .pdf
Inclusivity Essentials_ Creating Accessible Websites for Nonprofits .pdf
 
ANG SEKTOR NG agrikultura.pptx QUARTER 4
ANG SEKTOR NG agrikultura.pptx QUARTER 4ANG SEKTOR NG agrikultura.pptx QUARTER 4
ANG SEKTOR NG agrikultura.pptx QUARTER 4
 
DATA STRUCTURE AND ALGORITHM for beginners
DATA STRUCTURE AND ALGORITHM for beginnersDATA STRUCTURE AND ALGORITHM for beginners
DATA STRUCTURE AND ALGORITHM for beginners
 
Q4 English4 Week3 PPT Melcnmg-based.pptx
Q4 English4 Week3 PPT Melcnmg-based.pptxQ4 English4 Week3 PPT Melcnmg-based.pptx
Q4 English4 Week3 PPT Melcnmg-based.pptx
 
GRADE 4 - SUMMATIVE TEST QUARTER 4 ALL SUBJECTS
GRADE 4 - SUMMATIVE TEST QUARTER 4 ALL SUBJECTSGRADE 4 - SUMMATIVE TEST QUARTER 4 ALL SUBJECTS
GRADE 4 - SUMMATIVE TEST QUARTER 4 ALL SUBJECTS
 
Judging the Relevance and worth of ideas part 2.pptx
Judging the Relevance  and worth of ideas part 2.pptxJudging the Relevance  and worth of ideas part 2.pptx
Judging the Relevance and worth of ideas part 2.pptx
 
ENGLISH6-Q4-W3.pptxqurter our high choom
ENGLISH6-Q4-W3.pptxqurter our high choomENGLISH6-Q4-W3.pptxqurter our high choom
ENGLISH6-Q4-W3.pptxqurter our high choom
 

11 hypothesis testing

  • 1. Hypothesis Testing 185 11 Hypothesis Testing Null Hypothesis, Alternative Hypothesis, Type I and Type II Errors, One-Tailed Test, Two-Tailed Test 11.1 HYPOTHESIS TESTING We define hypothesis testing as a procedure to verify claims about population parameters. The tentative assumption is referred to as the null hypothesis and is denoted by 0H . But another hypothesis is developed to replace the initial tentative assumption once the null hypothesis has been rejected. This other hypothesis is referred to as the alternative hypothesis and is denoted by aH . The procedure to test both claims will require using data obtained from a sample of the population. In the following examples we shall show how null and alternative hypotheses are developed. Example 11.1 Consider a car model that currently is able to cover 8.5 km per litre of gasoline. A product-research group has developed a new carburettor designed to increase the kilometre-per-litre performance. This group will look for evidence that will enable them to conclude that the new design increases the mean  number of kilometre per litre. Develop the null and alternative hypothesis for this test. Solution 58580 .:.:   aHH Hypothesis Testing is a statistical procedure to determine which hypothesis is more acceptable as true or which hypothesis is more likely to be false. Null Hypothesis 0H is the hypothesis that is being tested; it represents the assertion that the experimenter doubts to be true. Alternative Hypothesis aH is the statement the experimenter believes to be true and wishes to prove. The rejection of the null hypothesis leads to the acceptance of the alternative hypothesis.
  • 2. Hypothesis Testing 186 In this situation, the researchers wish to see their claims about the new carburettor validated. Hence, their claim about the new carburettor should be the alternative hypothesis. And the existing kilometre-per-litre performance is the null hypothesis. :0H The mean kilometre-per-litre performance of the new carburettor is less than or equal to 8.5. :aH The mean kilometre-per-litre performance of the new carburettor is greater than 8.5. Example 11.2 A manufacturer of soft drinks states that the 2-litre containers of its products have an average content of at least 67.6 fluid ounces. A sample of 2-litre containers will be obtained, and their contents will be measured to test the manufacturer’s statement. Develop the null and alternative hypotheses for this test. Solution 6676670 .;.:   aHH The null hypothesis is the manufacturer’s claims about their product, that is, the mean content of the containers is at least 67.6 fluid ounces. The alternative hypothesis is: the mean content is less than 67.6. 0H : The mean content of the containers for soft drink is greater than or equal to 67.7 fluid ounces. :aH The mean content of the containers for soft drink is less than 67.7 fluid ounces. Example 11.3 The manager of Bantugon Resort & Hotel stated that their guests spend on average 1,500Php or less during their stay. One member of the hotel accounting staff has noticed that the total charges for guest bills have been increasing in recent months. If the accounting staff wishes to test the manager’s claims by collecting samples from their guest bills how should he formulate the hypotheses? Solution 150015000   :: aHH
  • 3. Hypothesis Testing 187 :0H The mean amount guests spend in the resort is less than or equal to 1500Php. :aH The mean amount guests spend in the resort is greater than 1500Php 11.2 TYPE I ERROR AND TYPE II ERROR The null and alternative hypotheses are competing statements about the true state of a situation. They are mutually exclusive statements: either 0H is true or aH is true, but not both. It would be nice if the process of hypothesis testing always leads us to accept a statement which is in fact true. But this result is not always possible. Bear in mind, hypothesis testing is based on information drawn from samples, therefore it makes sense to allow for the possibility of errors. Table 11.1 gives a summary of the correct decisions and the errors in hypothesis testing. The first column shows what happens when we accept 0H . If 0H is true, and we accept it, then our decision is correct. But if we accept 0H when in fact, aH is true then we make a Type II error. The second column shows what happens when we reject 0H . If we reject 0H when in fact, 0H is true then , we commit a Type I error. If we reject 0H and aH is true then, we make the correct decision. Since we cannot eliminate the possibility of errors in hypothesis testing, we must consider the probability of their occurrence. The probabilities of making the two errors are defined as follows: Correct Decision Type I Error Type II Error Correct Decision Accept H0 Reject H0 H0 is true Ha is true Table 11.1 Errors and Correct Decisions in Hypothesis Testing
  • 4. Hypothesis Testing 188 The probability of making a Type I error  is also referred to as the level of significance. Example 11.4 The label on a 3 quart container of orange juice claims that the orange juice contains on average, 1 gram of fat or less. a) Construct the appropriate null and alternative hypothesis. Solution 10 :H 1:aH :0H The mean amount of fat in the orange juice in a 3 quart container is less than or equal to 1 gram. aH : The mean amount of fat in the orange juice in a 3 quart container is greater than 1 gram b) What is Type I error in this situation? Answer Type I error involves rejecting the claim that the mean amount of fat in the orange juice in a 3 quart container is less than or equal to 1 gram, when in fact, it is true. (or claiming 1:aH when it is not true) c) What is Type II error in this situation? Answer Type II error involves accepting the claim that the mean amount of fat in the orange juice in a 3 quart container is less than or equal to 1 gram, when in fact, it is greater than 1 gram. (or claiming 10 :H is true when it is not true) Example 11.5 Mumbai Carpet House has been selling an average of 100,000Php of carpeting a week. Sofia Visco, the firm’s marketing manager, has proposed a compensation  the probability of making a Type I error  the probability of making a Type II error
  • 5. Hypothesis Testing 189 plan with a new selling incentive scheme. Mrs. Visco plans to use a trial selling period to demonstrate that the new incentive scheme will increase the average sales per salesperson. a) Develop an appropriate null and alternative hypothesis. Solution 1000000 H 100000aH :0H The mean sales of Mumbai Carpet House is less than or equal to 100000Php even with the new incentive scheme. :aH The new incentive scheme will produce a new mean sales which is greater than 100000Php. b) What is Type I error in this situation? Answer Type I error in this case involves rejecting the null hypothesis when in fact, the mean sales remains less than or equal to 100000Php. As a consequence, the company might adapt the new incentive scheme when in fact it will not help increase sales. c) What is the Type II error in this situation? Answer Type II error involves accepting the null hypothesis, when in fact, it is not true. That is, the new incentive scheme does help increase sales. The consequence of Type II error is the company will miss an opportunity to improve their sales by failing to implement the new incentive scheme. STEPS IN HYPOTHESIS TESTING 1. State the null hypothesis 0H and the alternative hypothesis aH 2. Choose the level of significance  . 3. Choose the test statistic and set the critical region. 4. Collect data and compute the test statistic based on the sample data. 5. Decide: Reject 0H if the value of the test statistic falls in the critical region. If it falls outside, then accept 0H .
  • 6. Hypothesis Testing 190 11.3 One-Tailed Hypothesis Test for Population Mean A one – tailed test of hypothesis for the population mean is a test which specifies only one tail of the distribution as the rejection region, either to the left tail or right tail. Setting up the null and alternative hypotheses can take on the following forms: yxayx yxayx a a uHuuH uHuuH cHcH cHcH         :: :: :: :: 0 0 0 0 11.4 Two-Tailed Hypothesis Test for Population Mean A two – tailed test of hypothesis for the population mean is a test which specifies both tails of the distribution as the rejection region. Setting up the null and alternative hypothesis can take on the following forms: yxayx a HH cHcH     :: :: 0 0 A test statistic is a statistic whose value is calculated from sample measurements and on which the statistical decision will be based. The critical region is the set of values of the test statistic for which the null hypothesis will be rejected. The acceptance region is the set of values of the test statistic for which the null hypothesis will be accepted. The critical value of the test statistic is the demarcation line between the critical and acceptance regions. Test Statistic a. ( Large Sample ) If  is known and 30n , the test statistic is x x z  0  where nx    b) ( Small Sample ) If  is unknown and 30n , the test statistic is x s x t 0  where n sx   With 1 nv degrees of freedom (t – statistic)
  • 7. Hypothesis Testing 191 The z – statistic is to be applied for a large sample size, that is, 30n . When the sample size less than 30, use the statistict . Example 11.6 A random sample of 500 car owners shows that the average mileage of a car is 23,500 km a year with a standard deviation of 3,900 km. Test the hypothesis that the average mileage of a car is 23,400 km a year at 5% level of significance. Solution a) Set the null and alternative hypotheses. 40023400230 ,:,:   aHH b) The population standard deviation  is not known but we can replace it with the sample standard deviation s. The sample size is also large. We shall use the z – statistic. Critical Region a) For one – tailed hypothesis test: z – test 0 00     : : aH H Rejection Rule at a Level of Significance of  : Reject zzH if0 z – test 0 00     : : aH H Rejection Rule at a Level of Significance of  : Reject zzH if0 b) For two – tailed test: z – test 0 00     : : aH H Rejection Rule at a Level of Significance of  : Reject 220  zzzzH  andif
  • 8. Hypothesis Testing 192 x s x z 0  where n s sx  Since this is a two – tailed test, the critical points are 2z . At 961050 0250 .,. .  z c) Computation 570 5003900 23400235000 .     x s x z  d) Since 570.z is less than 1.96 we do not reject the null hypothesis, that is, the average mileage of all cars is not significantly different from 23,400 km. Example 11.7 Conrad Dotong Real Estate Co. advertises that the mean selling time of a residential home is 40 days or less after it is listed in their company. A sample of 50 recently sold homes shows a sample mean selling time of 45 days and a standard deviation of 20 days. Using a 0.02 level of significance, test the validity of the company’s claim. Solution a) Set the null and alternative hypothesis: 40400   :: aHH b) The population standard deviation  is not known but we shall replace it with the sample standard deviation 20s . Sample size is large with 50n . Use the z – statistic. Critical Value 961.z Acceptance Region
  • 9. Hypothesis Testing 193 This is a one – tailed test with 020. . The critical value is 052020 .. z . c) Computation 771 5020 40450 .     x s x z  d) Since 771.z is less than 2.05, we do not reject the null hypothesis. A sample selling time of 45 days is not significantly greater than the population mean of 40 days at 0.02 level of confidence. Example 11.8 The height of adults in a certain town is found to have a mean of 166.17 cm with standard deviation of 5.89 cm. A random sample of 144 adults in the slum section of the town is discovered to have a mean height of 164.65 cm. Does this height indicate that the residents of the slum area are significantly shorter in height at 0.05 level of significance? Solution a) Set the null and alternative hypothesis. cm.:cm.: 17166171660   aHH b) The population standard deviation  is cm.895 , and the sample size is large at 144n . Use the z – statistic. This is also a one-tailed test with 050. . The critical point is 651050 .. z . We shall reject 0H if 651.z . Critical Value 052.z Acceptance Region
  • 10. Hypothesis Testing 194 c) Computation 933 114895 17166651640 . . ..      x x z   d) Since 933.z is less than 651. , we reject the null hypothesis. This means the height of adults in the slum section of the town is significantly lower than 166.17 cm at 0.05 level of significance. Example 11.9 The average aluminium concentration recovered from samples of aluminium measurements from 20 different locations was discovered to be 2.8 grams/ml with standard deviation of 0.3 gram/ml. Does this suggest that the average amount of aluminium in the river is significantly more than 2.5 grams/ml at 0.05 level of significance? Solution a) Set the null and alternative hypotheses. grams/ml.:grams/ml.: 52520   aHH b) We shall use the sample standard deviation 30.s . Since the sample size is small 20n , we shall use the t – statistic. x s x t 0  where n sx   With 1 nv degrees of freedom. Critical Value 651.z Acceptance Region
  • 11. Hypothesis Testing 195 This is a one – tailed test, and the critical point at 19 degrees of freedom is 7291050 .. t (see t-distribution table) c) Computations 474 2030 52820 . . ..      x s x t  d) Since 474.t is greater than the critical point of 1.729, the null hypothesis has to be rejected. This means the average amount of aluminium in the river is significantly greater than 2.5 grams/ml at 0.05 level of significance. Critical Value 7291.t Acceptance Region
  • 13. Hypothesis Testing 197 Exercise 11.1 Hypothesis Testing: Null and Alternative Hypotheses Complete the following exercises neatly and orderly. 1. The coffee dispenser of LPU canteen was readjusted. The canteen manager wished to know if the dispenser is dispensing the right quantity of coffee. He took a sample of 50 cups filled by the dispenser. The dispenser can be deemed in good condition only if the average fill per cup is 8 ounces. Define the appropriate null and alternative hypotheses for this situation. 0H : aH : 2. A triathlete plans to reduce his weight to improve his racing performance in triathlon races. He heard about a food supplement which is marketed to be an effective supplement for weight loss. The food supplement however, is very expensive. He talked to people who had tried the supplement themselves and decided that he will use the supplement only if the proportion of people who would claim it to be effective is greater than 60%. Define the appropriate null and alternative hypotheses for this situation. 0H : aH : Name Date Course-Section Score
  • 14. Hypothesis Testing 198 3. Bantugon Pharmaceuticals claims that its new medicine is at least 90% effective in relieving an allergy for a period of 8 hours. Students in the medical technology program of LPU Batangas wish to test this claim. Define the appropriate null and alternative hypotheses. 0H : aH :