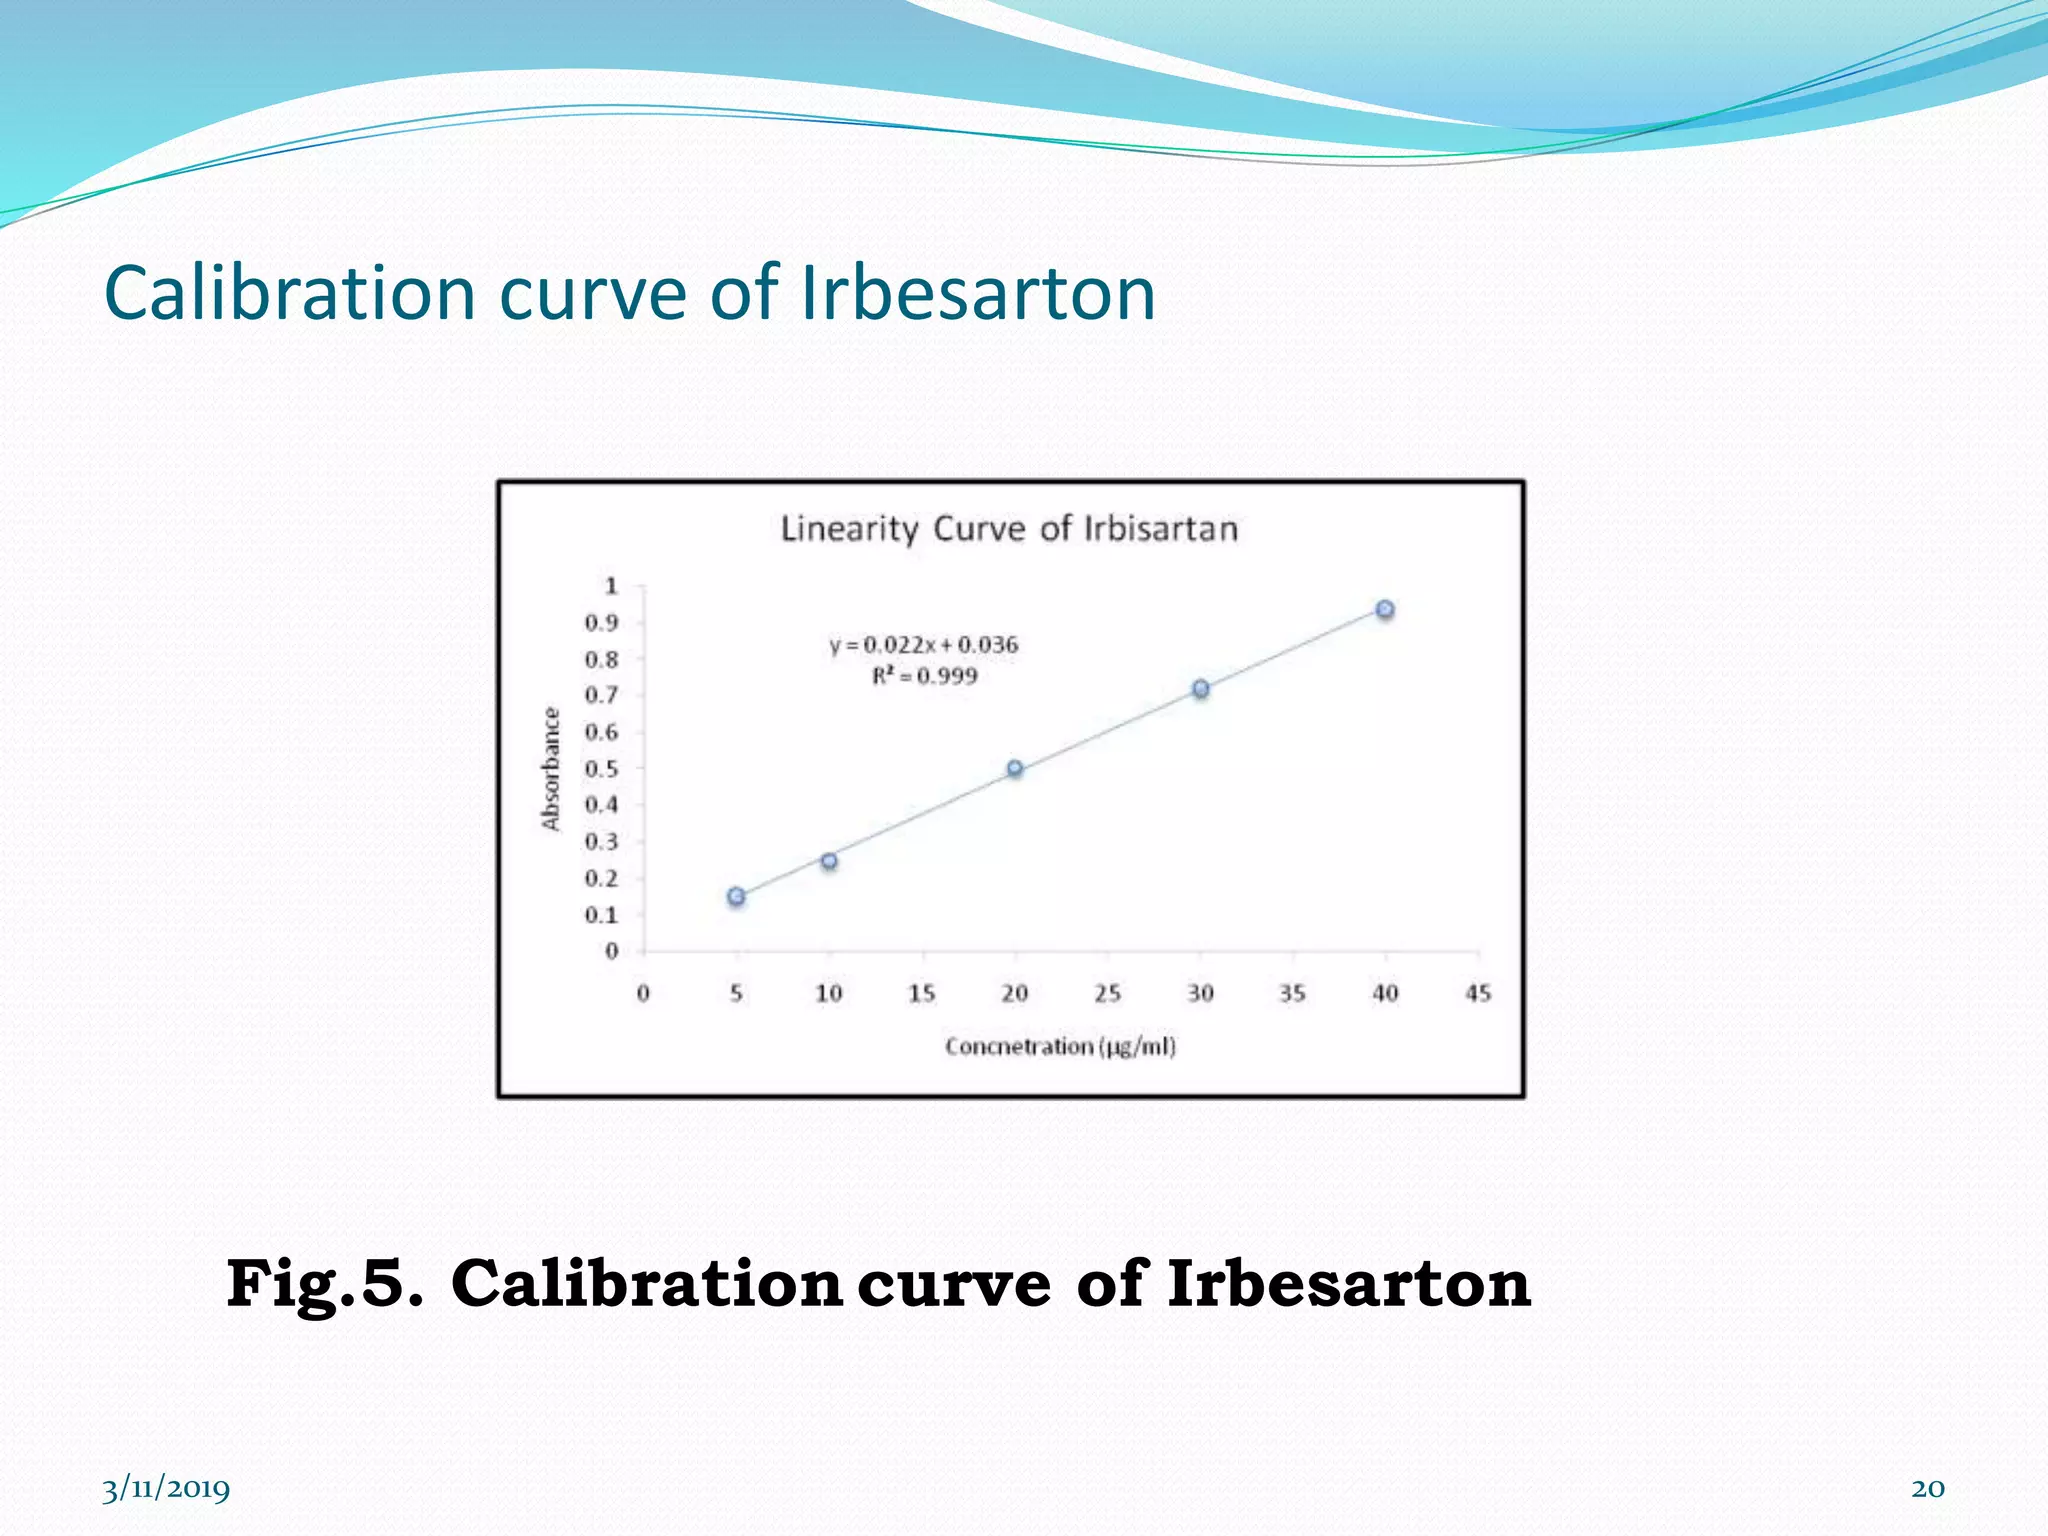
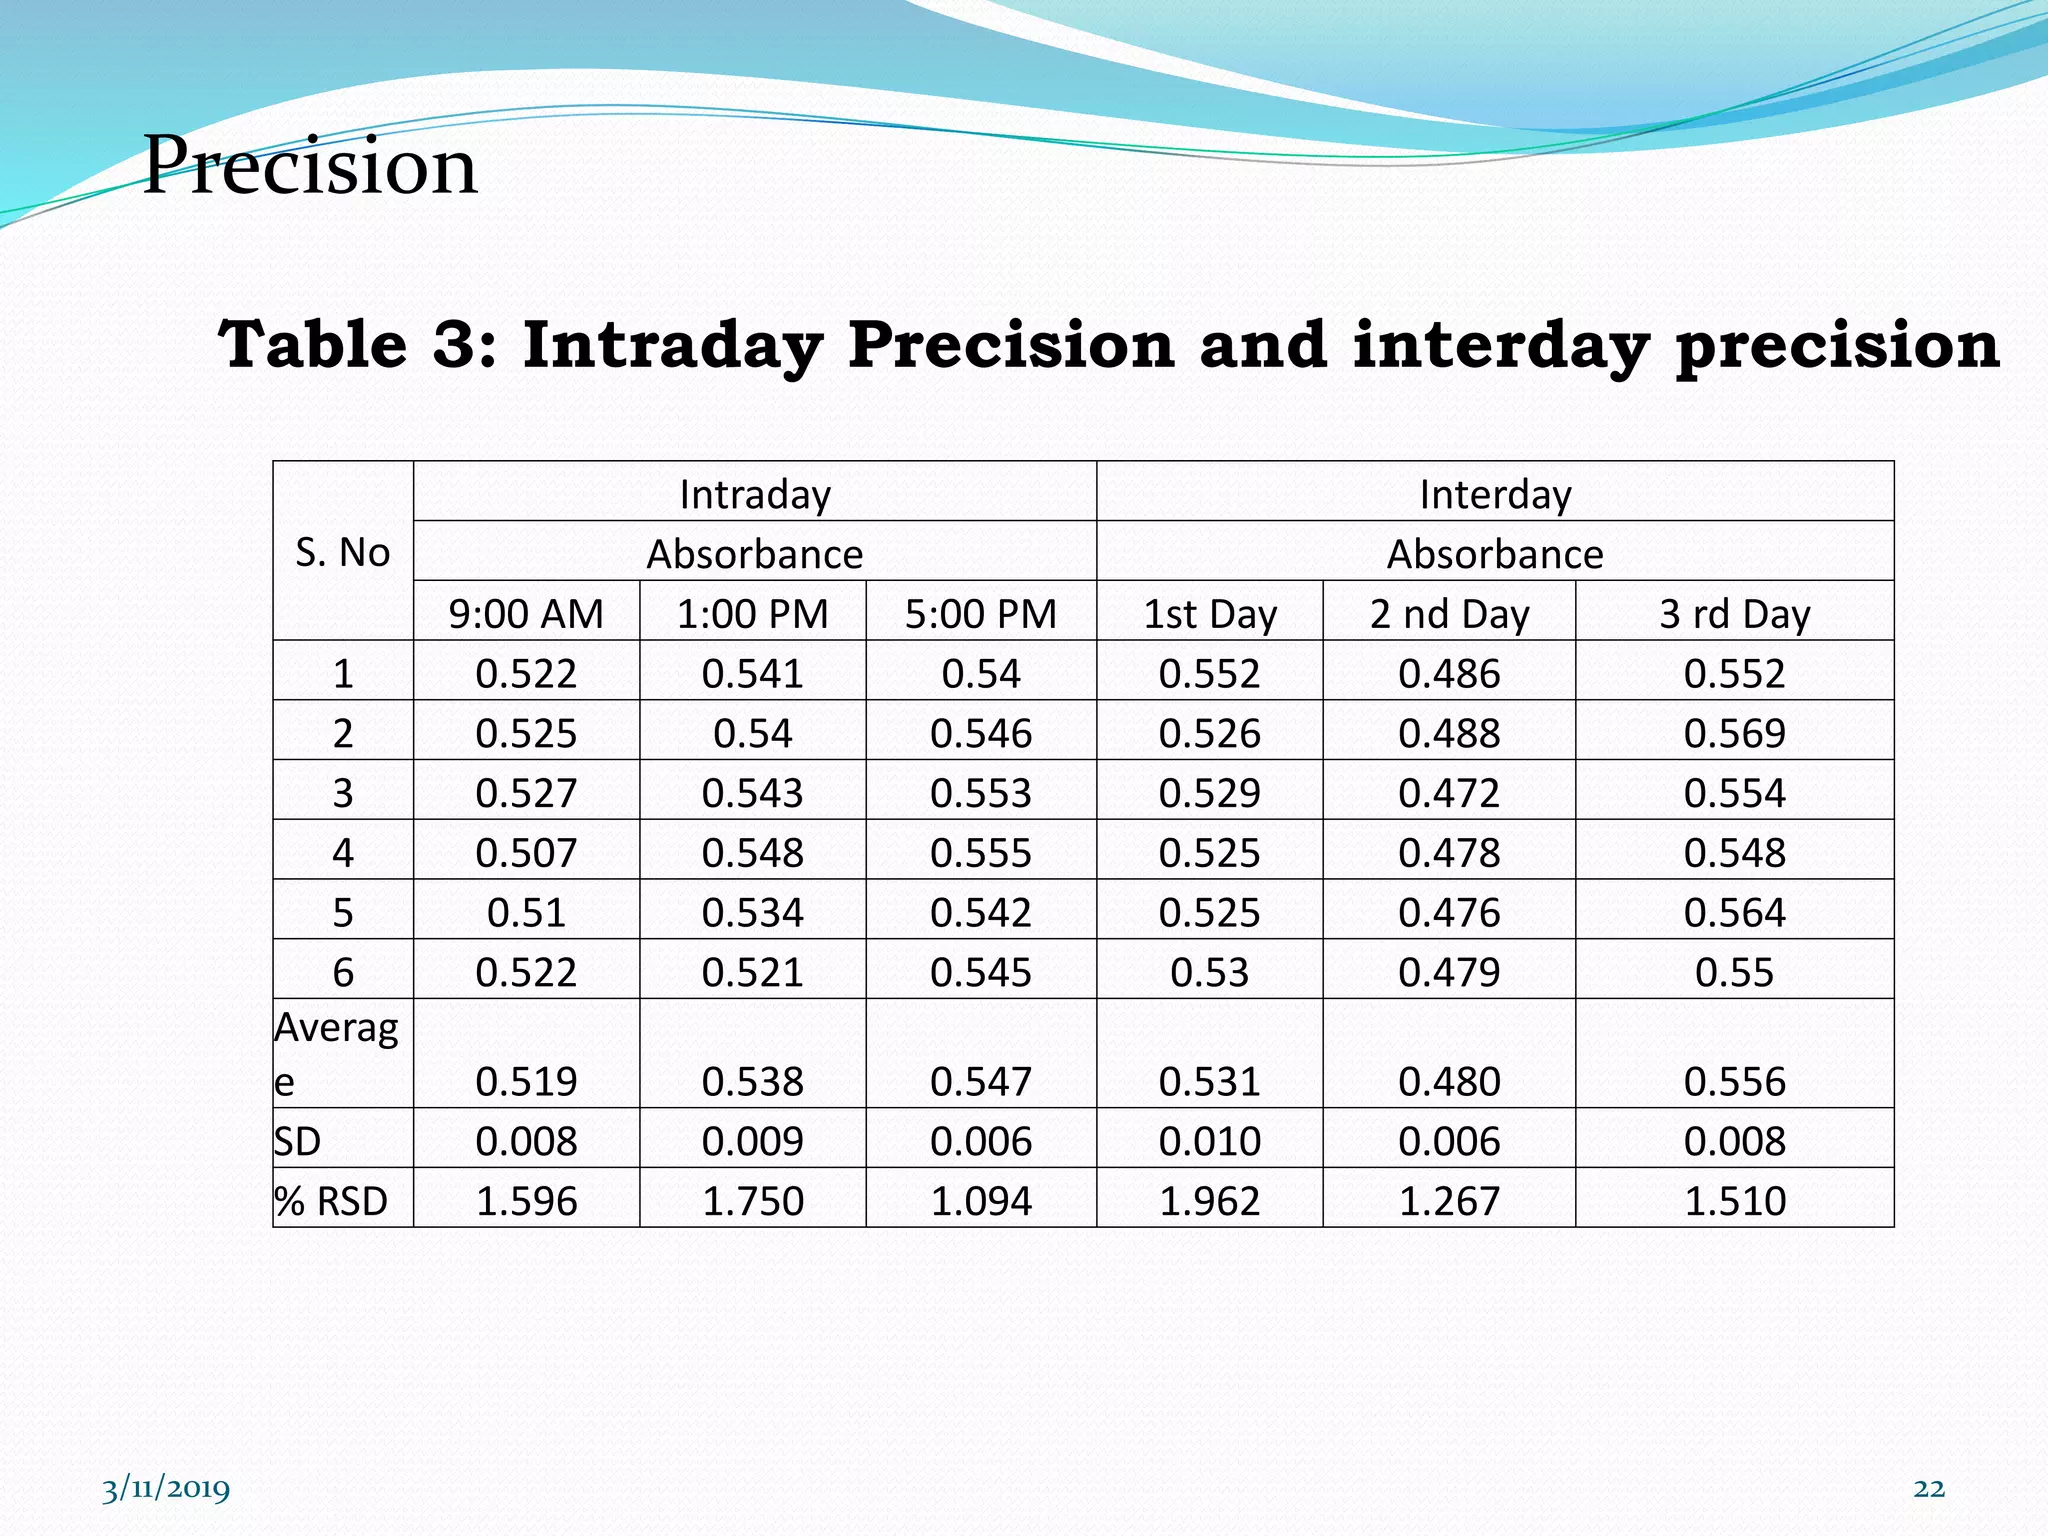
Supervised by
Dr. B. Mohammed Ishaq
M.Pharm, Ph.D
Associate professor
3/11/2019 1
Presented by
P. Swathi
Reg.no. 12T11R0082
Co- Supervised by
Dr. Hindustan abdul ahad,
M.Pharm, Ph.D
principal
Balaji College of Pharmacy
almur road, rudrampeta bypass,
Anantapuramu
Contents
1. Introduction
2. Materials and methods
3. Results and discussion
4. Summary and conclusion
5. References
3/11/2019 2
3/11/2019 3
1. INTRODUCTION
 Pharmaceutical Analysis is the study of the separation,
identification, and quantification of the
Pharmaceutical compounds of natural and artificial
origin.
 Analytical chemistry is the science of making
quantitative measurements.
3/11/2019 4
1.1. instrument principle
 Ultraviolet absorption spectra arise from transition of
electron with in a molecule from lower to higher
electronic energy level.
3/11/2019 5
1.2. drug profile
 Irbesartan is an angiotensin II receptor antagonist
used in the management of hypertension including
treatment of renal disease in hypertensive type II
diabetic patients.
 Structure:
3/11/2019 6
1.3. aim and objectives
 To develop a simple, reliable, precise, accurate and
economical method under routine conditions by UV
visible spectrometer.
 To validate the analytical method as per ICH
guidelines.
 To apply developed analytical method to marketed
formulation of Irbesarton
3/11/2019 7
1.4. plan of work
 Selection of suitable common solvent .
 Which is readily available.
 chemically inert.
 economical and
 analytical grade for UV spectrophotometric method.
3/11/2019 8
3/11/2019 9
2. MATERIALS
 CT 60 Double beam UV-Visible spectrophotometer
 Sonicator
 Analytical balance
 Cuvvets
 Analytical grade chemicals and reagents
3/11/2019 10
METHODS
 An UV–Visible double beam spectrophotometer with
1cm matched quartz cells were used for the spectral
and absorbance measurements.
 Aqueous solutions were freshly prepared with triple
distilled water.
3/11/2019 11
2.1. preparation of stock solution
 10 mg of drug dissolved in 10ml of 0.1N
NaOH.
 0.1 ml from above solution was taken and
make up to 10ml.
 0.2 ml was taken and made up to 10 ml to get
a concentration of 20 µg/ml.
 working standard solution of 20μg/ml for10ml
with 0.1N NaOH.
 The working standard solutions were daily
prepared by diluting stock solution in water.
3/11/2019 12
2.2. preparation of test sample
 10 tablets were weighed and powdered. 10mg
of API = 26.98mg of tablet. It is transferred in
to 10ml of volumetric flask.
 0.1N NaOH was added up to 10ml and mixed
for 5-10 min and filtered.
 0.1 ml from the above stock solution was
transferred to 10 ml volumetric flask along with
0.1N NaOH. From the above solution 0.2ml was
transferred to 10 ml volumetric flask along with
0.1N NaOH to get 20µg/ml concentration.
3/11/2019 13
3/11/2019 14
Acid degradation
3/11/2019 15
 3 samples of 20μg/ml drug solution +1ml of
0.1N HCL
Fig.1. Acid degradation Spectrum of Irbesarton
3.1.Degradation studies
Base degradation
 3 samples of 20μg/ml drug solution +1ml of
0.1N NAOH.
3/11/2019 16
Fig.2. Base degradation Spectrum of Irbesarton
Heat degradation
 3 samples of 20μg/ml drug solution heated for
1 hour.
3/11/2019 17
Fig.3. Heat degradation Spectrum of Irbesarton
Perioxide degradation
• 3 samples of 20μg/ml drug solution + 1ml 0f
H2O2
3/11/2019 18
Fig.4. Peroxide degradation Spectrum of Irbesarton
S. No Conc. (µg/ml) Absorbance
1 1 0.278
2 5.5 0.403
3 10 0.513
4 15.5 0.647
5 20 0.786
Linearity
Table 1: Calibration (Linearity) of Irbesarton
3/11/2019 19
3/11/2019 20
Calibration curve of Irbesarton
Fig.5. Calibration curve of Irbesarton
3/11/2019 21
S. No Conc. Level
Absorbanc
e
Amount
Added
(µg/ml)
Amount
Found
(µg/ml)
% Recovery
Mean %
Recovery
1
50
0.276 4.98 4.96 99.49
99.91
2 0.277 4.98 4.97 99.85
3 0.278 4.98 4.99 100.21
4 0.278 4.98 4.99 100.21
5 0.276 4.98 4.96 99.49
6 0.278 4.98 4.99 100.21
7
100
0.552 9.96 9.91 99.49
99.848 0.556 9.96 9.98 100.21
9 0.554 9.96 9.95 99.85
10
150
0.834 14.94 14.97 100.21
99.91
11 0.822 14.94 14.76 98.77
12 0.832 14.94 14.94 99.97
13 0.836 14.94 15.01 100.45
14 0.833 14.94 14.96 100.09
15 0.832 14.94 14.94 99.97
accuracy
Table 2: Accuracy results
3/11/2019 22
S. No
Intraday Interday
Absorbance Absorbance
9:00 AM 1:00 PM 5:00 PM 1st Day 2 nd Day 3 rd Day
1 0.522 0.541 0.54 0.552 0.486 0.552
2 0.525 0.54 0.546 0.526 0.488 0.569
3 0.527 0.543 0.553 0.529 0.472 0.554
4 0.507 0.548 0.555 0.525 0.478 0.548
5 0.51 0.534 0.542 0.525 0.476 0.564
6 0.522 0.521 0.545 0.53 0.479 0.55
Averag
e 0.519 0.538 0.547 0.531 0.480 0.556
SD 0.008 0.009 0.006 0.010 0.006 0.008
% RSD 1.596 1.750 1.094 1.962 1.267 1.510
Precision
Table 3: Intraday Precision and interday precision
Concentration (μg/ml) Absorbance
5 0.152±0.001
10 0.251±0.002
20 0.505±0.001
30 0.721±0.001
40 0.938±0.001
All values mentioned as mean ± S.D; Number of
trials (n) =3
Calibration (Linearity) of Irbesarton
Table 4: Calibration (Linearity) of Irbesarton
3/11/2019 23
Slope 0.0227±0.009
Linearity R2= 0.999 (nearer to 1)
LOD 1.189µg/ml
LOQ 1.189µg/ml
Linearity values of Irbesarton calibration curve
Table 5: Linearity values of Irbesarton calibration curve
3/11/2019 24
3/11/2019 25
4. SUMMARY
 In this study simple, fast and reliable UV
spectrophotometric method was developed and
validated for the determination of Irbesarton in tablet
formulation.
 The method was applied directly to the analysis of
pharmaceutical dosage forms without the need for
separation such as extraction steps prior to the drug
analysis.
3/11/2019 26
conclusion
 we concluded that the suggested methods showed
high sensitivity, accuracy, reproducibility and
specificity. Moreover, these methods were simple and
inexpensive and they can be employed for the routine
quality control analysis of Irbesarton in
pharmaceutical formulations.
3/11/2019 27
5. REFERENCES
 U.S. Food and Drug Administration Guidance for Industry, ICH Q3A, Impurities in NewDrug Substances, 2003.
 U.S. Food and Drug Administration Guidance for Industry, ICH Q3B, Impurities in NewDrug Products, 2006.
 U.S. Food and Drug Administration Guidance for Industry, ICH Q3C, Impurities:
 Residual Solvents, 1997.Solli, Chou, Jalali B etal."Amplified wavelength–time transformation for real-time
spectroscopy," Nature Photonics, 2008, 2, 48-51.
 PrabhakarMisra and Mark Dubinskii etal. Test apparatus and method for testing cuvette accommodated samples.
1998, 2(4), 356-360.
 Hernrmann R and Onketinx C etal. Quantities and units in clinical chemistry. Flame properties in flame emission
and absorption spectrometry. Pure and applied chemistry. 1986, 58(12), 1737-1742.
 Narayana DL, Saladi RN, Fox JL etal. Ultra violet radiation and skin cancer. International Journal of Dermatology.
2010, 49(9),978-986.
 Soovali L, Kutt A, Kaljurand I, and Leito I etal. Uncertainty sources in UV-Vis spectrophotometric measurement.
2006, 11, 246-255.
 Ansell S, Tromp RH, Neilson GWetal. The solute and aquaion structure in a concentrated aqueous solution of
copper chloride. Scientific Working Group-Materials, 1995, 7(8), 1513-1524.
 Horie, Fujiwara M, Kokubo N, and Kondo N etal."Spectroscopic thin film thickness measurement system for
semiconductor industries",Proceedings of Instrumentation and Measurement Technology Conference,
Hamamatsu, Japan, 1994,
 Annalen der Physik und Chemieetal. "Bestimmung der Absorption des rothenLichts in farbigenFlussigkeiten"
(Determination of the absorption of red light in colored liquids), 1852, 86, 78-88.
 ICH, Impurities in new drug products, International Conference on Harmonisation,IFPMA, Geneva, 1996.
 Sertova, Lau WSetal. Infrared characterization for microelectronics. Journal of Photo chemistry and photo biology,
2000, 134(3), 163-168.
 Hamm P, Lim MH, and Hochstrasser RM etal. "Structure of the amide I band of peptides measured by
femtosecond nonlinear-infrared spectroscopy". J. Phys. Chem. 1998, 102 (31), 6123.
 ICH, Specifications: Test procedures and acceptance criteria for new drug substances andnew drug products:
Chemical substances. International Conference on Harmonisation,IFPMA, Geneva, 1999.
 FDA, Guideline for Submitting Documentation for the Stability of Human Drugs andBiologics. Food and Drug
Administration, Rockville, MD, 1987.
3/11/2019 28
 ICH, Specifications: Test procedures and acceptance criteria for new drug substances andnew drug products: Chemical
substances. International Conference on Harmonisation,IFPMA, Geneva, 1999.
 FDA, Guideline for Submitting Documentation for the Stability of Human Drugs andBiologics. Food and Drug
Administration, Rockville, MD, 1987.
 Downard KM etal. "William Aston – the man behind the mass spectrograph". European Journal of Mass Spectrometry,
2007, 13 (3), 177–190.
 Squires and Gordon etal (1998). "Francis Aston and the mass spectrograph". 1998, 23(4), 3893–3900.
 KM Downward etal. "Francis William Aston – the man behind the mass spectrograph". European Journal of Mass
Spectrometry 2007, 13 (3): 177–190.
 WHO, Guidelines for Stability Testing of Pharmaceutical Products Containing Well,Established Drug Substances in
Conventional Dosage Forms, in WHO Expert Committeeon Specifications for Pharmaceutical Preparations, Technical
Report Series 863, WorldHealth Organization, Geneva, 1996, pp. 65–79.
 Siri and William etal. "Mass spectroscope for analysis in the low-mass range". Review of Scientific Instruments 1947, 18
(8), 540–545.
 James Keeler etal. "Chapter 2: NMR and energy levels" (reprinted at University of Cambridge). Understanding NMR
Spectroscopy. University of California, Irvine. Retrieved 2007-05-11.
 Martin, andZekter GE, etal. Two-Dimensional NMR Methods for Establishing Molecular Connectivity; VCH Publishers,
Inc: New York, 1988, 59.
 USP 25–NF 20 (United States Pharmacopecial Convention, Rockville, MD), 2002, p. 2256.
 FDA, “Analytical Procedures and Methods Validation: Chemistry, Manufacturing, and Controls,” Federal Register
(Notices), 2000, 65 (169), 776–777.
 “International Conference on Harmonization; Draft Guidance on Specifications: Test Procedures and Acceptance
Criteriafor New Drug Substances and Products: Chemical Substances,” Federal Register (Notices) 2000, 65 (251), 83041–
83063.
 Sweetman, and Sean C etal. "Antibacterials". Martindale, The complete drug reference, 2009,36, London:
Pharmaceutical Press, 218–9.
 Sneader, and Walter etal. "Cephalosporin analogues". Drug discovery: a history. New York: Wiley. 2009, pp. 324.
 The United States Pharmacopeia, 24th Revision, Asian Edition, United States,Pharmacopeial Convention, Inc.,
Rockville, MD, 2000.
 FDA, Guidance for Industry Q1A(R2), stability testing of new drug substances andproducts, November 2003.
 Raja B, Ramadevi,HariKrishan, PriyaRanjan, SimritReyaraand SanjeevMishraaet al. Asian Journal of Pharmaceutical
Sciences, 2013, 8(6), 346–355.
3/11/2019 29
 Pichichero ME et al. "Use of selected cephalosporins in penicillin-allergic patients: a paradigm shift". Diagnostic
Microbiology and Infectious Disease 2007, 57: 13S–18S.
 Bonazzi D, Gotti V, Andrisano V, and Cavrini V et al. Analysis of ACE inhibitors in pharmaceutical dosage forms by
derivative UV spectroscopy and liquid chromatography (HPLC). J. Pharm. Biomed. Anal. 1997; 16: 431–438.
 FDA, Guideline for the photostability testing of new drug substances and new drugproducts, Federal Register, 1997;
62(95): 27115-27122.
 Preissner S, Kroll K, Dunkel M, Senger C, Goldsobel G, andKuzman D, et al. a comprehensive database on Cytochrome
P450 enzymes including a tool for analysis of CYP-drug interactions. 2010 Jan, 38,237-43.
 Siladitya, Behera, SubhajitG, hanty, Fahad Ahmad andSaayakSantra, et al. UV-Visible Spectrophotometric Method
Development and Validation of Assay of Paracetamol Tablet Formulation, 2012, 3(6), 34-38.
 Mahfuza and Ahmed etal. Assay of paracetamoltabletsbyuv spectroscopic method, Senior research and development
Engineer, 2012, 73(4), 976-980.
 Salgado H R N et al. Oliveira Development and validation of an UV spectrophotometric method for determination of
gatifloxacin in tablets, 2004, 60(3), 263–264.
 JoyaniDasandManabendraDhua et al. Assay Method Development and Validation of Metronidazole inBulk and Tablet
Formulation by using uv spectrophotometric method. 2005, 45(2), 45-47.
 Razia M, Sowmya B, Rajalakshmi, Karthiga v, Lavanyaetal. Method development and evaluation of Nitroglycerin in
bulk and its dosage form, International journalof biological Pharmaceutical research, 2013, 4(9), 256-260.
 Pritesh G,Dhartarkar, Rajan V, Kalamkar, Suprit D, and Shailesh et al.uvSpectrophotometric method for the
development of Dexibuprofen, 2011, 3(4), 361-366.
 Samina A, Snehal P,Poonam S. Karekar, Yogesh V and Kishor B. uv spectrophotometric method for the estimation of
Gliclazile in bulk and its pharmaceutical dosageform, 2011, 3 (4), 338-343.
 Shalin K, Dhar DN, Sharma PN etal.,uv spectrometric method for the quantitative determination of Itraconazole,
Journal of Scientific and Industrial research, 2009, 68(3), 181-187.

 Micheli,Leonardo,Trevisan and Sangoi et al. method development and validation of Irbesarton, journal of scientific
and industrial research, 2010, 33(6), 43-49.
 Vijaya Lakshmi N, Koteswara Rao B, RojaRaniK,Manasa and Bhavani V.By uv spectroscopy, 2013, 1(1), 123-125.
 RameshRN and BujjiBabu N etal. Method development and validation for the estimation of Irbesarton in tablets by
HPLC method, 2011, 2 (2), 145-149.
 FDA, International Conference on Harmonization, Guidance on Q6A Specifications: TestProcedures and Acceptance
Criteria for New Drug Substances and New Drug Products:Chemical Substances, December 2000.
 Prashanthi R, Raghavi K, Sindhura M, AnupamaB, Buchi, and NalluriNetal. Method development and estimation of
Irbesarton by HPLC method, 2012, 397.
3/11/2019 30
Thank you
Presented
by
P.Swathi
3/11/2019 31

Irbesarton

  • 1.
    Supervised by Dr. B.Mohammed Ishaq M.Pharm, Ph.D Associate professor 3/11/2019 1 Presented by P. Swathi Reg.no. 12T11R0082 Co- Supervised by Dr. Hindustan abdul ahad, M.Pharm, Ph.D principal Balaji College of Pharmacy almur road, rudrampeta bypass, Anantapuramu
  • 2.
    Contents 1. Introduction 2. Materialsand methods 3. Results and discussion 4. Summary and conclusion 5. References 3/11/2019 2
  • 3.
  • 4.
    1. INTRODUCTION  PharmaceuticalAnalysis is the study of the separation, identification, and quantification of the Pharmaceutical compounds of natural and artificial origin.  Analytical chemistry is the science of making quantitative measurements. 3/11/2019 4
  • 5.
    1.1. instrument principle Ultraviolet absorption spectra arise from transition of electron with in a molecule from lower to higher electronic energy level. 3/11/2019 5
  • 6.
    1.2. drug profile Irbesartan is an angiotensin II receptor antagonist used in the management of hypertension including treatment of renal disease in hypertensive type II diabetic patients.  Structure: 3/11/2019 6
  • 7.
    1.3. aim andobjectives  To develop a simple, reliable, precise, accurate and economical method under routine conditions by UV visible spectrometer.  To validate the analytical method as per ICH guidelines.  To apply developed analytical method to marketed formulation of Irbesarton 3/11/2019 7
  • 8.
    1.4. plan ofwork  Selection of suitable common solvent .  Which is readily available.  chemically inert.  economical and  analytical grade for UV spectrophotometric method. 3/11/2019 8
  • 9.
  • 10.
    2. MATERIALS  CT60 Double beam UV-Visible spectrophotometer  Sonicator  Analytical balance  Cuvvets  Analytical grade chemicals and reagents 3/11/2019 10
  • 11.
    METHODS  An UV–Visibledouble beam spectrophotometer with 1cm matched quartz cells were used for the spectral and absorbance measurements.  Aqueous solutions were freshly prepared with triple distilled water. 3/11/2019 11
  • 12.
    2.1. preparation ofstock solution  10 mg of drug dissolved in 10ml of 0.1N NaOH.  0.1 ml from above solution was taken and make up to 10ml.  0.2 ml was taken and made up to 10 ml to get a concentration of 20 µg/ml.  working standard solution of 20μg/ml for10ml with 0.1N NaOH.  The working standard solutions were daily prepared by diluting stock solution in water. 3/11/2019 12
  • 13.
    2.2. preparation oftest sample  10 tablets were weighed and powdered. 10mg of API = 26.98mg of tablet. It is transferred in to 10ml of volumetric flask.  0.1N NaOH was added up to 10ml and mixed for 5-10 min and filtered.  0.1 ml from the above stock solution was transferred to 10 ml volumetric flask along with 0.1N NaOH. From the above solution 0.2ml was transferred to 10 ml volumetric flask along with 0.1N NaOH to get 20µg/ml concentration. 3/11/2019 13
  • 14.
  • 15.
    Acid degradation 3/11/2019 15 3 samples of 20μg/ml drug solution +1ml of 0.1N HCL Fig.1. Acid degradation Spectrum of Irbesarton 3.1.Degradation studies
  • 16.
    Base degradation  3samples of 20μg/ml drug solution +1ml of 0.1N NAOH. 3/11/2019 16 Fig.2. Base degradation Spectrum of Irbesarton
  • 17.
    Heat degradation  3samples of 20μg/ml drug solution heated for 1 hour. 3/11/2019 17 Fig.3. Heat degradation Spectrum of Irbesarton
  • 18.
    Perioxide degradation • 3samples of 20μg/ml drug solution + 1ml 0f H2O2 3/11/2019 18 Fig.4. Peroxide degradation Spectrum of Irbesarton
  • 19.
    S. No Conc.(µg/ml) Absorbance 1 1 0.278 2 5.5 0.403 3 10 0.513 4 15.5 0.647 5 20 0.786 Linearity Table 1: Calibration (Linearity) of Irbesarton 3/11/2019 19
  • 20.
    3/11/2019 20 Calibration curveof Irbesarton Fig.5. Calibration curve of Irbesarton
  • 21.
    3/11/2019 21 S. NoConc. Level Absorbanc e Amount Added (µg/ml) Amount Found (µg/ml) % Recovery Mean % Recovery 1 50 0.276 4.98 4.96 99.49 99.91 2 0.277 4.98 4.97 99.85 3 0.278 4.98 4.99 100.21 4 0.278 4.98 4.99 100.21 5 0.276 4.98 4.96 99.49 6 0.278 4.98 4.99 100.21 7 100 0.552 9.96 9.91 99.49 99.848 0.556 9.96 9.98 100.21 9 0.554 9.96 9.95 99.85 10 150 0.834 14.94 14.97 100.21 99.91 11 0.822 14.94 14.76 98.77 12 0.832 14.94 14.94 99.97 13 0.836 14.94 15.01 100.45 14 0.833 14.94 14.96 100.09 15 0.832 14.94 14.94 99.97 accuracy Table 2: Accuracy results
  • 22.
    3/11/2019 22 S. No IntradayInterday Absorbance Absorbance 9:00 AM 1:00 PM 5:00 PM 1st Day 2 nd Day 3 rd Day 1 0.522 0.541 0.54 0.552 0.486 0.552 2 0.525 0.54 0.546 0.526 0.488 0.569 3 0.527 0.543 0.553 0.529 0.472 0.554 4 0.507 0.548 0.555 0.525 0.478 0.548 5 0.51 0.534 0.542 0.525 0.476 0.564 6 0.522 0.521 0.545 0.53 0.479 0.55 Averag e 0.519 0.538 0.547 0.531 0.480 0.556 SD 0.008 0.009 0.006 0.010 0.006 0.008 % RSD 1.596 1.750 1.094 1.962 1.267 1.510 Precision Table 3: Intraday Precision and interday precision
  • 23.
    Concentration (μg/ml) Absorbance 50.152±0.001 10 0.251±0.002 20 0.505±0.001 30 0.721±0.001 40 0.938±0.001 All values mentioned as mean ± S.D; Number of trials (n) =3 Calibration (Linearity) of Irbesarton Table 4: Calibration (Linearity) of Irbesarton 3/11/2019 23
  • 24.
    Slope 0.0227±0.009 Linearity R2=0.999 (nearer to 1) LOD 1.189µg/ml LOQ 1.189µg/ml Linearity values of Irbesarton calibration curve Table 5: Linearity values of Irbesarton calibration curve 3/11/2019 24
  • 25.
  • 26.
    4. SUMMARY  Inthis study simple, fast and reliable UV spectrophotometric method was developed and validated for the determination of Irbesarton in tablet formulation.  The method was applied directly to the analysis of pharmaceutical dosage forms without the need for separation such as extraction steps prior to the drug analysis. 3/11/2019 26
  • 27.
    conclusion  we concludedthat the suggested methods showed high sensitivity, accuracy, reproducibility and specificity. Moreover, these methods were simple and inexpensive and they can be employed for the routine quality control analysis of Irbesarton in pharmaceutical formulations. 3/11/2019 27
  • 28.
    5. REFERENCES  U.S.Food and Drug Administration Guidance for Industry, ICH Q3A, Impurities in NewDrug Substances, 2003.  U.S. Food and Drug Administration Guidance for Industry, ICH Q3B, Impurities in NewDrug Products, 2006.  U.S. Food and Drug Administration Guidance for Industry, ICH Q3C, Impurities:  Residual Solvents, 1997.Solli, Chou, Jalali B etal."Amplified wavelength–time transformation for real-time spectroscopy," Nature Photonics, 2008, 2, 48-51.  PrabhakarMisra and Mark Dubinskii etal. Test apparatus and method for testing cuvette accommodated samples. 1998, 2(4), 356-360.  Hernrmann R and Onketinx C etal. Quantities and units in clinical chemistry. Flame properties in flame emission and absorption spectrometry. Pure and applied chemistry. 1986, 58(12), 1737-1742.  Narayana DL, Saladi RN, Fox JL etal. Ultra violet radiation and skin cancer. International Journal of Dermatology. 2010, 49(9),978-986.  Soovali L, Kutt A, Kaljurand I, and Leito I etal. Uncertainty sources in UV-Vis spectrophotometric measurement. 2006, 11, 246-255.  Ansell S, Tromp RH, Neilson GWetal. The solute and aquaion structure in a concentrated aqueous solution of copper chloride. Scientific Working Group-Materials, 1995, 7(8), 1513-1524.  Horie, Fujiwara M, Kokubo N, and Kondo N etal."Spectroscopic thin film thickness measurement system for semiconductor industries",Proceedings of Instrumentation and Measurement Technology Conference, Hamamatsu, Japan, 1994,  Annalen der Physik und Chemieetal. "Bestimmung der Absorption des rothenLichts in farbigenFlussigkeiten" (Determination of the absorption of red light in colored liquids), 1852, 86, 78-88.  ICH, Impurities in new drug products, International Conference on Harmonisation,IFPMA, Geneva, 1996.  Sertova, Lau WSetal. Infrared characterization for microelectronics. Journal of Photo chemistry and photo biology, 2000, 134(3), 163-168.  Hamm P, Lim MH, and Hochstrasser RM etal. "Structure of the amide I band of peptides measured by femtosecond nonlinear-infrared spectroscopy". J. Phys. Chem. 1998, 102 (31), 6123.  ICH, Specifications: Test procedures and acceptance criteria for new drug substances andnew drug products: Chemical substances. International Conference on Harmonisation,IFPMA, Geneva, 1999.  FDA, Guideline for Submitting Documentation for the Stability of Human Drugs andBiologics. Food and Drug Administration, Rockville, MD, 1987. 3/11/2019 28
  • 29.
     ICH, Specifications:Test procedures and acceptance criteria for new drug substances andnew drug products: Chemical substances. International Conference on Harmonisation,IFPMA, Geneva, 1999.  FDA, Guideline for Submitting Documentation for the Stability of Human Drugs andBiologics. Food and Drug Administration, Rockville, MD, 1987.  Downard KM etal. "William Aston – the man behind the mass spectrograph". European Journal of Mass Spectrometry, 2007, 13 (3), 177–190.  Squires and Gordon etal (1998). "Francis Aston and the mass spectrograph". 1998, 23(4), 3893–3900.  KM Downward etal. "Francis William Aston – the man behind the mass spectrograph". European Journal of Mass Spectrometry 2007, 13 (3): 177–190.  WHO, Guidelines for Stability Testing of Pharmaceutical Products Containing Well,Established Drug Substances in Conventional Dosage Forms, in WHO Expert Committeeon Specifications for Pharmaceutical Preparations, Technical Report Series 863, WorldHealth Organization, Geneva, 1996, pp. 65–79.  Siri and William etal. "Mass spectroscope for analysis in the low-mass range". Review of Scientific Instruments 1947, 18 (8), 540–545.  James Keeler etal. "Chapter 2: NMR and energy levels" (reprinted at University of Cambridge). Understanding NMR Spectroscopy. University of California, Irvine. Retrieved 2007-05-11.  Martin, andZekter GE, etal. Two-Dimensional NMR Methods for Establishing Molecular Connectivity; VCH Publishers, Inc: New York, 1988, 59.  USP 25–NF 20 (United States Pharmacopecial Convention, Rockville, MD), 2002, p. 2256.  FDA, “Analytical Procedures and Methods Validation: Chemistry, Manufacturing, and Controls,” Federal Register (Notices), 2000, 65 (169), 776–777.  “International Conference on Harmonization; Draft Guidance on Specifications: Test Procedures and Acceptance Criteriafor New Drug Substances and Products: Chemical Substances,” Federal Register (Notices) 2000, 65 (251), 83041– 83063.  Sweetman, and Sean C etal. "Antibacterials". Martindale, The complete drug reference, 2009,36, London: Pharmaceutical Press, 218–9.  Sneader, and Walter etal. "Cephalosporin analogues". Drug discovery: a history. New York: Wiley. 2009, pp. 324.  The United States Pharmacopeia, 24th Revision, Asian Edition, United States,Pharmacopeial Convention, Inc., Rockville, MD, 2000.  FDA, Guidance for Industry Q1A(R2), stability testing of new drug substances andproducts, November 2003.  Raja B, Ramadevi,HariKrishan, PriyaRanjan, SimritReyaraand SanjeevMishraaet al. Asian Journal of Pharmaceutical Sciences, 2013, 8(6), 346–355. 3/11/2019 29
  • 30.
     Pichichero MEet al. "Use of selected cephalosporins in penicillin-allergic patients: a paradigm shift". Diagnostic Microbiology and Infectious Disease 2007, 57: 13S–18S.  Bonazzi D, Gotti V, Andrisano V, and Cavrini V et al. Analysis of ACE inhibitors in pharmaceutical dosage forms by derivative UV spectroscopy and liquid chromatography (HPLC). J. Pharm. Biomed. Anal. 1997; 16: 431–438.  FDA, Guideline for the photostability testing of new drug substances and new drugproducts, Federal Register, 1997; 62(95): 27115-27122.  Preissner S, Kroll K, Dunkel M, Senger C, Goldsobel G, andKuzman D, et al. a comprehensive database on Cytochrome P450 enzymes including a tool for analysis of CYP-drug interactions. 2010 Jan, 38,237-43.  Siladitya, Behera, SubhajitG, hanty, Fahad Ahmad andSaayakSantra, et al. UV-Visible Spectrophotometric Method Development and Validation of Assay of Paracetamol Tablet Formulation, 2012, 3(6), 34-38.  Mahfuza and Ahmed etal. Assay of paracetamoltabletsbyuv spectroscopic method, Senior research and development Engineer, 2012, 73(4), 976-980.  Salgado H R N et al. Oliveira Development and validation of an UV spectrophotometric method for determination of gatifloxacin in tablets, 2004, 60(3), 263–264.  JoyaniDasandManabendraDhua et al. Assay Method Development and Validation of Metronidazole inBulk and Tablet Formulation by using uv spectrophotometric method. 2005, 45(2), 45-47.  Razia M, Sowmya B, Rajalakshmi, Karthiga v, Lavanyaetal. Method development and evaluation of Nitroglycerin in bulk and its dosage form, International journalof biological Pharmaceutical research, 2013, 4(9), 256-260.  Pritesh G,Dhartarkar, Rajan V, Kalamkar, Suprit D, and Shailesh et al.uvSpectrophotometric method for the development of Dexibuprofen, 2011, 3(4), 361-366.  Samina A, Snehal P,Poonam S. Karekar, Yogesh V and Kishor B. uv spectrophotometric method for the estimation of Gliclazile in bulk and its pharmaceutical dosageform, 2011, 3 (4), 338-343.  Shalin K, Dhar DN, Sharma PN etal.,uv spectrometric method for the quantitative determination of Itraconazole, Journal of Scientific and Industrial research, 2009, 68(3), 181-187.   Micheli,Leonardo,Trevisan and Sangoi et al. method development and validation of Irbesarton, journal of scientific and industrial research, 2010, 33(6), 43-49.  Vijaya Lakshmi N, Koteswara Rao B, RojaRaniK,Manasa and Bhavani V.By uv spectroscopy, 2013, 1(1), 123-125.  RameshRN and BujjiBabu N etal. Method development and validation for the estimation of Irbesarton in tablets by HPLC method, 2011, 2 (2), 145-149.  FDA, International Conference on Harmonization, Guidance on Q6A Specifications: TestProcedures and Acceptance Criteria for New Drug Substances and New Drug Products:Chemical Substances, December 2000.  Prashanthi R, Raghavi K, Sindhura M, AnupamaB, Buchi, and NalluriNetal. Method development and estimation of Irbesarton by HPLC method, 2012, 397. 3/11/2019 30
  • 31.