
Recommended
More Related Content
What's hot
What's hot (20)
Viewers also liked
Viewers also liked (20)
Similar to Aaj ka trend 24.10.16
Similar to Aaj ka trend 24.10.16 (20)
Recently uploaded
Recently uploaded (20)
Aaj ka trend 24.10.16
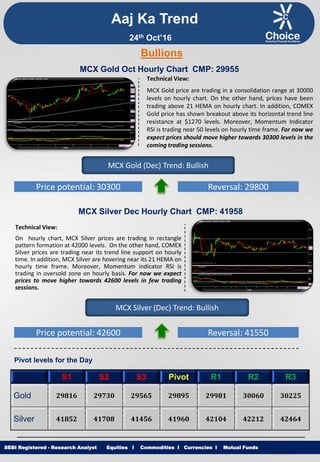
- 1. Equities I Commodities I Currencies I Mutual Funds Aaj Ka Trend Technical View: MCX Gold price are trading in a consolidation range at 30000 levels on hourly chart. On the other hand, prices have been trading above 21 HEMA on hourly chart. In addition, COMEX Gold price has shown breakout above its horizontal trend line resistance at $1270 levels. Moreover, Momentum Indicator RSI is trading near 50 levels on hourly time frame. For now we expect prices should move higher towards 30300 levels in the coming trading sessions. SEBI Registered - Research Analyst Equities I Commodities I Currencies I Mutual Funds Bullions MCX Gold Oct Hourly Chart CMP: 29955 MCX Gold (Dec) Trend: Bullish Price potential: 30300 Reversal: 29800 MCX Silver Dec Hourly Chart CMP: 41958 Technical View: On hourly chart, MCX Silver prices are trading in rectangle pattern formation at 42000 levels. On the other hand, COMEX Silver prices are trading near its trend line support on hourly time. In addition, MCX Silver are hovering near its 21 HEMA on hourly time frame. Moreover, Momentum indicator RSI is trading in oversold zone on hourly basis. For now we expect prices to move higher towards 42600 levels in few trading sessions. MCX Silver (Dec) Trend: Bullish Price potential: 42600 Reversal: 41550 Pivot levels for the Day S1 S2 S3 Pivot R1 R2 R3 Gold 29816 29730 29565 29895 29981 30060 30225 Silver 41852 41708 41456 41960 42104 42212 42464 24th Oct’16
- 2. Equities I Commodities I Currencies I Mutual Funds Technical View: On hourly chart MCX Copper has given breakdown of its Rectangle pattern at 312.60 levels & is trading below its trend line resistance. In addition, prices have been trading below its 50 DEMA, which suggest medium term remains weak. Furthermore, COMEX Copper is trading below its trend line resistance on hourly time frame. Moreover, momentum indicator RSI has been trading below 50 levels on hourly time frame. For now we expect prices to move lower towards 304 levels in coming trading sessions. SEBI Registered - Research Analyst Equities I Commodities I Currencies I Mutual Funds MCX Copper Nov hourly Chart CMP: 311.30 MCX Copper (Nov) Trend: Bearish Price potential: 304 Reversal: 315.70 MCX Crude Oil Oct. Hourly Chart CMP: 3409 Technical View: MCX Crude Oil prices are trading above its upward slanting trend line support on hourly chart. In addition, Counter is trading above its 50 HEMA on hourly chart. Moreover, Momentum indicator RSI is trading above 50 levels on hourly chart. Furthermore, momentum indicator MACD is trading above its signal line on hourly chart. For now we expect prices to move higher towards 3475 levels in coming trading sessions. MCX Crude Oil (Oct) Trend: Bullish Price potential: 3475 Reversal: 3365 Pivot levels for the Day S1 S2 S3 Pivot R1 R2 R3 Copper 310.4 309.3 307.3 311.4 312.4 313.4 315.5 Crude 3373 3348 3297 3399 3424 3450 3501 Base Metal Energy Aaj Ka Trend 24th Oct’16
- 3. Equities I Commodities I Currencies I Mutual FundsSEBI Registered - Research Analyst Equities I Commodities I Currencies I Mutual Funds Other Base Metals & Energy S1 S2 S3 Pivot R1 R2 R3 Trend Copper 310.4 309.3 307.3 311.4 312.4 313.4 315.5 Aluminum 107.3 106.9 105.8 108.0 108.4 109.1 110.2 Lead 131.8 130.7 128.6 132.8 133.9 134.9 137.0 Nickel 668.9 662.5 652.6 672.4 678.8 682.3 692.2 Zinc 151.0 149.6 147.4 151.9 153.2 154.1 156.4 Natural Gas 239.9 217.7 211.1 224.3 246.5 230.9 237.5 Fundamental News: Gold prices fell in Asia on Friday with a stronger dollar and the rising chances of aerate hike weighing on the hedge commodity. Gold prices slipped lower on Friday, as a stronger U.S. dollar weighed on the precious metal, although the European Central Bank’s latest policy decision lent some support. European Union leaders agreed on Friday to modernize their instruments to defend against unfair trade practices, the chairman of the meeting Donald Tusk said, noting there was a difference between being protectionism and protecting one's interests. From sharp cuts to Chinese oil production to falling inventories of refined fuel products, signs are mounting that Asia's oil markets are slowly returning to balance. Oil edged higher on Friday as Russia reiterated its commitment to joining a producers' output freeze to stem a two-year slide in prices but a strong dollar capped gains. U.S. oil rose on Friday, hovering above the $50 a barrel threshold after Russia reiterated its commitment to contribute to a global output freeze, although a stronger U.S. dollar limited the commodity’s gains. The dollar remained at eight-month highs against the other majors currencies on Friday, as hopes for a U.S. rate hike before the end of the year continued to lend broad support to the greenback. U.K. public sector borrowing fell less-than-expected in the last quarter, official data showed on Friday. Aaj Ka Trend 24th Oct’16
- 4. Equities I Commodities I Currencies I Mutual FundsSEBI Registered - Research Analyst Equities I Commodities I Currencies I Mutual Funds International Market Commodity Closing Price Gold 1267.05 Silver 17.53 Crude Oil 50.98 Brent Crude Oil 51.91 Natural Gas 2.970 COMEX/NYMEX/ICE ( Precious Metals & Energy) Currency & Commodity Index Currency (Spot) Current Price USD / INR 66.92 Dollar Index 98.62 EUR / USD 1.0882 CRB Index* 189.39 Closing as on 21.10.16 *Closing as on 21.10.16 LME (Base Metals) ( $ per tones) Commodity Closing Price Copper 4614 Aluminum 1617 Zinc 2240 Lead 1988 Nickel 9918 SHFE (Base Metals) (Yuan per tones) Commodity Closing Price Copper 37160 Aluminum 12760 Zinc 17130 Lead 15735 Closing as on 21.10.16 Closing as on 21.10.16 LME INVENTORY DATA Aaj Ka Trend 17-Oct-16 18-Oct-16 19-Oct-16 20-Oct-16 21-Oct-16 Aluminium -6226 2548 24751 36802 18351 Copper -3274 2201 2621 -2049 -8101 Lead -151 601 601 -677 -676 Nickel 1768 -1195 -8 1549 580 Zinc -248 102 -277 -374 -174 24th Oct’16
- 5. Equities I Commodities I Currencies I Mutual Funds This is solely for information of clients of Choice Broking and does not construe to be an investment advice. It is also not intended as an offer or solicitation for the purchase and sale of any financial instruments. Any action taken by you on the basis of the information contained herein is your responsibility alone and Choice Broking its subsidiaries or its employees or associates will not be liable in any manner for the consequences of such action taken by you. We have exercised due diligence in checking the correctness and authenticity of the information contained in this recommendation, but Choice Broking or any of its subsidiaries or associates or employees shall not be in any way responsible for any loss or damage that may arise to any person from any inadvertent error in the information contained in this recommendation or any action taken on basis of this information. Technical analysis studies market psychology, price patterns and volume levels. It is used to forecast future price and market movements. Technical analysis is complementary to fundamental analysis and news sources. The recommendations issued herewith might be contrary to recommendations issued by Choice Broking in the company research undertaken as the recommendations stated in this report is derived purely from technical analysis. Choice Broking has based this document on information obtained from sources it believes to be reliable but which it has not independently verified; Choice Broking makes no guarantee, representation or warranty and accepts no responsibility or liability as to its accuracy or completeness. The opinions contained within the report are based upon publicly available information at the time of publication and are subject to change without notice. The information and any disclosures provided herein are in summary form and have been prepared for informational purposes. The recommendations and suggested price levels are intended purely for trading purposes. The recommendations are valid for the day of the report however trading trends and volumes might vary substantially on an intraday basis and the recommendations may be subject to change. The information and any disclosures provided herein may be considered confidential. Any use, distribution, modification, copying, forwarding or disclosure by any person is strictly prohibited. The information and any disclosures provided herein do not constitute a solicitation or offer to purchase or sell any security or other financial product or instrument. The current performance may be unaudited. Past performance does not guarantee future returns. There can be no assurance that investments will achieve any targeted rates of return, and there is no guarantee against the loss of your entire investment. POTENTIAL CONFLICT OF INTEREST DISCLOSURE (as on date of report) Disclosure of interest statement – • Analyst interest of the stock /Instrument(s): - No. • Firm interest of the stock / Instrument (s): - No. Disclaimer Contact Us Amit Pathania Research Associate amit.pathania@choiceindia.com Rohan Patil Research Associate rohan.patil@choiceindia.com www.choicebroking.incustomercare@choiceindia.com SEBI Registered - Research Analyst Equities I Commodities I Currencies I Mutual Funds Aaj Ka Trend 24th Oct’16 Neeraj Yadav Research Advisor neeraj.yadav@choiceindia.com Anish Vyas Senior Research Associate anish.vyas@choiceindia.com Amit Pathania Digitally signed by Amit Pathania DN: cn=Amit Pathania, o=Choice Equity Broking Pvt. ltd, ou=Research Department, email=amit.pathania@choiceindia.com, c=IN Date: 2016.10.22 13:18:07 +05'30'