

Recommended
More Related Content
What's hot
What's hot (20)
Viewers also liked
Viewers also liked (15)
Similar to Aaj ka trend 09.03.17
Similar to Aaj ka trend 09.03.17 (18)
Recently uploaded
Recently uploaded (20)
Aaj ka trend 09.03.17
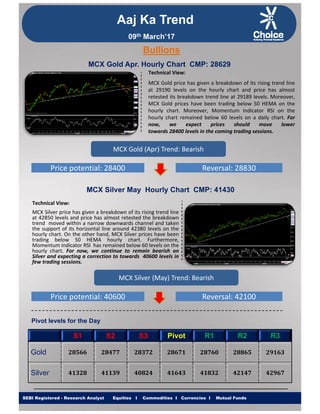
- 1. Aaj Ka Trend Bullions 09th March’17 Technical View: MCX Gold price has given a breakdown of its rising trend line at 29190 levels on the hourly chart and price has almost retested its breakdown trend line at 29189 levels. Moreover, MCX Gold prices have been trading below 50 HEMA on the MCX Gold Apr. Hourly Chart CMP: 28629 MCX Gold prices have been trading below 50 HEMA on the hourly chart. Moreover, Momentum Indicator RSI on the hourly chart remained below 60 levels on a daily chart. For now, we expect prices should move lower towards 28400 levels in the coming trading sessions. MCX Gold (Apr) Trend: Bearish Price potential: 28400 Reversal: 28830 MCX Silver May Hourly Chart CMP: 41430 Technical View: MCX Silver price has given a breakdown of its rising trend line at 42850 levels and price has almost retested the breakdown trend moved within a narrow downwards channel and taken the support of its horizontal line around 42380 levels on the hourly chart. On the other hand, MCX Silver prices have been trading below 50 HEMA hourly chart. Furthermore, Momentum indicator RSI has remained below 60 levels on the hourly chart. For now, we continue to remain bearish on Silver and expecting a correction to towards 40600 levels inSilver and expecting a correction to towards 40600 levels in few trading sessions. MCX Silver (May) Trend: Bearish Price potential: 40600 Reversal: 42100 Pivot levels for the Day S1 S2 S3 Pivot R1 R2 R3 Gold 28566 28477 28372 28671 28760 28865 29163 Equities I Commodities I Currencies I Mutual FundsSEBI Registered - Research Analyst Equities I Commodities I Currencies I Mutual Funds Silver 41328 41139 40824 41643 41832 42147 42967
- 2. Base Metal Aaj Ka Trend 09th March’17 Technical View: MCX Copper price has been moving in horizontal channel pattern formation from past few months and price has faced the resistance of its upper band of the pattern on the 4 hourly chart. On the 4 hourly chart, MCX Copper prices h b t di b l 50 HEMA M t i di t MCX Copper Apr. 4 Hourly Chart CMP: 385.35 have been trading below 50 HEMA. Momentum indicator MACD has shown negative crossover on the 4 hourly time frame, which suggests downside momentum in the prices. For now, we expect prices to move lower towards 377 levels in coming trading sessions. MCX Copper (Apr) Trend: Bearish Price potential: 377 Reversal: 393 MCX Crude Oil March. Hourly Chart CMP: 3425 Energy MCX Crude Oil March. Hourly Chart CMP: 3425 Technical View: MCX Crude Oil price given breakdown of its symmetrical triangle pattern at 3510 levels on a daily chart. On the other hand, prices have been trading below its 21 DEMA on a daily chart. Momentum indicator MACD has given negative crossover on a daily chart which suggests chances of a further down side in the prices. However, the short term b hview remains bearish. For now, we expect prices to move lower towards 3400 levels in the few trading session. MCX Crude Oil (March) Trend: Bearish Price potential: 3400 Reversal: 3540Price potential: 3400 Reversal: 3540 Pivot levels for the Day S1 S2 S3 Pivot R1 R2 R3 Copper 385.1 383.7 381.2 388 389 391 398 Equities I Commodities I Currencies I Mutual FundsSEBI Registered - Research Analyst Equities I Commodities I Currencies I Mutual Funds Crude 3429 3395 3335 3489 3523 3583 3738
- 3. Other Base Metals & Energy Aaj Ka Trend 09th March’17 gy S1 S2 S3 Pivot R1 R2 R3 Trend Copper 385.1 383.7 381.2 388 389 391 398 Al i 124 8 124 2 123 6 125 4 126 0 126 6 128 4Aluminum 124.8 124.2 123.6 125.4 126.0 126.6 128.4 Lead 148.9 147.5 146.6 149.8 151.2 152.1 155.3 Nickel 667.8 655.5 632.8 690.5 702.8 725.5 783.3 Zinc 179.5 178.5 177.7 180.4 181.4 182.2 184.9 Natural Gas 191.8 187.2 184.8 194.2 198.8 201.2 210.6 Fundamental News: A report from ADP that showed the strongest creation of non‐farm private employment in nearly 11 years caused markets to further increase the odds on Wednesday for a rate hike by the Federal Reserve (Fed) at their meeting next week. According to Investing.com's Fed Rate Monitor Tool, Fed fund futures are currently pricing in a 90.8% chance of an increase in interest rates being announced on March 15. That compared to 86% earlier on Wednesday and just 66% the prior week. The dollar hit the highest levels of the day against a basket of the other major currencies on Wednesday after unexpectedly robust U.S. private sector hiring data bolstered optimism over the health of the labor market ahead of Friday’s government jobs report. After a string of recent hawkish comments from Fed members, odds have rapidly increased that the U.S. central bank will remove accommodative policy at the next meeting with some analysts suggesting that only a dismalbank will remove accommodative policy at the next meeting with some analysts suggesting that only a dismal employment report on Friday would be capable of staying a move to tighten monetary policy. Wall Street traded mixed on Wednesday after a strong report on the U.S. labor market sparked increased optimism over the economy but was also coupled with speculation about its impact on monetary policy. While the report set the stage for a positive read from the upcoming government jobs report on Friday, it also suggested that the Federal Reserve (Fed) would have no impediment to tightening policy at its meeting next week. Equities I Commodities I Currencies I Mutual FundsSEBI Registered - Research Analyst Equities I Commodities I Currencies I Mutual Funds Odds on future rate hikes have undergone volatility in the lead up to the March meeting, though they have moved beyond 80% this week from around 20% before a string of recent hawkish comments from Fed policy makers convinced markets that the central bank would make a move in their March 15 announcement.
- 4. International Market Aaj Ka Trend 09th March’17 Commodity Closing Price Gold 1207.41 Silver 17.22 COMEX/NYMEX/ICE ( Precious Metals & Energy) Currency & Commodity Index Currency (Spot) Current Price USD / INR 66.84 Silver 17.22 Crude Oil 50.59 Brent Crude Oil 53.53 Natural Gas 2.925 Dollar Index 102.14 EUR / USD 1.05 CRB Index* 185.053 Closing as on 08.03.17 *Closing as on 08.03.17 LME (Base Metals) ( $ per tones) Commodity Closing Price Copper 5765 Aluminum 1877 Zinc 2710 SHFE (Base Metals) (Yuan per tones) Commodity Closing Price Copper 46650 Aluminum 13640 Lead 2251 Nickel 10200 Zinc 21675 Lead 17600 Closing as on 08.03.17 Closing as on 08.03.17 LME INVENTORY DATA 02‐March‐17 03‐March‐17 06‐March‐17 07‐March‐17 08‐March‐17 Aluminium ‐7625 ‐19850 ‐19400 ‐23650 ‐16325 Copper ‐725 ‐3575 38825 26725 26550 Lead 300 ‐150 ‐25 ‐25 ‐25 Nickel 666 ‐714 ‐450 3816 5022 Equities I Commodities I Currencies I Mutual FundsSEBI Registered - Research Analyst Equities I Commodities I Currencies I Mutual Funds Zinc ‐25 ‐1025 3400 ‐425 ‐2175
- 5. Contact Us Aaj Ka Trend 09th March’17 Contact Us Amit Pathania Research Associate amit.pathania@choiceindia.com Anish Vyas Senior Research Associate anish.vyas@choiceindia.com Neeraj Yadav Research Advisor neeraj.yadav@choiceindia.com www.choicebroking.incustomercare@choiceindia.com This is solely for information of clients of Choice Broking and does not construe to be an investment advice. It is also not intended as an offer or solicitation for the purchase and sale of any financial instruments. Any action taken by you on the basis of the information contained herein is your responsibility alone and Choice Broking its subsidiaries or its employees or associates will not be liable in any manner for the consequences of such action taken by you. We h i d d dili i h ki h d h i i f h i f i i d i hi d i b Ch i B ki f Disclaimer have exercised due diligence in checking the correctness and authenticity of the information contained in this recommendation, but Choice Broking or any of its subsidiaries or associates or employees shall not be in any way responsible for any loss or damage that may arise to any person from any inadvertent error in the information contained in this recommendation or any action taken on basis of this information. Technical analysis studies market psychology, price patterns and volume levels. It is used to forecast future price and market movements. Technical analysis is complementary to fundamental analysis and news sources. The recommendations issued herewith might be contrary to recommendations issued by Choice Broking in the company research undertaken as the recommendations stated in this report is derived purely from technical analysis. Choice Broking has based this document on information obtained from sources it believes to be reliable but which it has not independently verified; Choice Broking makes no guarantee, representation or warranty and accepts no responsibility or liability as to its accuracy or completeness. The opinions contained within the report are based upon publicly available information at the time of publication and are subject to change without notice. The information and any disclosures provided herein are in summary form and have been prepared for informational purposes. The recommendations and suggested price levels are intended purely for trading purposes. The recommendations are valid for the day of the report however trading trends and volumes might vary substantially on an intraday basis and the recommendations may be subject to change. The information and any disclosures provided herein may be considered confidential. Any use, distribution, Equities I Commodities I Currencies I Mutual Funds y j g y p y y , , modification, copying, forwarding or disclosure by any person is strictly prohibited. The information and any disclosures provided herein do not constitute a solicitation or offer to purchase or sell any security or other financial product or instrument. The current performance may be unaudited. Past performance does not guarantee future returns. There can be no assurance that investments will achieve any targeted rates of return, and there is no guarantee against the loss of your entire investment. POTENTIAL CONFLICT OF INTEREST DISCLOSURE (as on date of report) Disclosure of interest statement – • Analyst interest of the stock /Instrument(s): - No. • Firm interest of the stock / Instrument (s): - No. SEBI Registered - Research Analyst Equities I Commodities I Currencies I Mutual Funds Amit Pathania Digitally signed by Amit Pathania DN: cn=Amit Pathania, o=Choice Equity Broking Pvt. ltd, ou=Research Department, email=amit.pathania@choiceindia.com, c=IN Date: 2017.03.09 09:14:43 +05'30'