Chapter 13 finding relationships
•
0 likes•270 views

This document contains information about statistics concepts like dependent and independent variables, scatter diagrams, correlation, and regression. It discusses how to interpret a scatter diagram and calculate the correlation coefficient to determine the strength of the linear relationship between two variables. It also explains how to find the line of best fit and use it to make predictions, along with calculating how accurately the line fits the real data using the coefficient of determination. As an example, it analyzes the relationship between marks achieved and time studied, finding a very strong positive correlation between the two variables.
Report
Share
Report
Share
Download to read offline

Recommended
Day 5 pp_august 25 tuesday
The document outlines an agenda for an August 25th Tuesday math class. It includes warm-up practice problems adding and identifying place values of decimals. The daily learning objective is for students to correctly line up decimals and add or subtract combinations of decimals and whole numbers. An overall concept explained is that when borrowing from a place value in decimal subtraction, you are borrowing that place value amount. An exit ticket asks students about decimal placement and the process for adding and subtracting decimals.
Mann Whitney U test
This presentation contains information about Mann Whitney U test, what is it, when to use it and how to use it. I have also put an example so that it may help you to easily understand it.
Ap Physics C Mathematical Concepts Vectors
This document covers mathematical concepts related to AP Physics C including:
1) Polynomials of different orders and their graphs.
2) Trigonometry definitions and relationships using right triangles.
3) Vectors having both direction and magnitude, while scalars have only magnitude. Vectors can be resolved into x and y components using trigonometry.
3) Vector addition and multiplication using graphical and numerical methods including dot products and cross products.
Mc1020
The document discusses techniques for curve fitting, or fitting curves to discrete data to obtain intermediate estimates. It describes two general approaches for curve fitting: least squares regression, which derives a single curve representing the general trend of scattered data, and interpolation, which passes a curve or series of curves through each precise data point. It then provides mathematical background on concepts used in curve fitting like the arithmetic mean, standard deviation, and linear regression.
November 9, 2015
The document provides a weekly schedule and topics for a math class. It outlines that the test will be on Thursday and will cover absolute value expressions and equations, adding and subtracting integers, and order of operations. It also includes sample test questions, solutions to practice problems, and the homework assignment for the current and next day.
Addition of Vectors | By Head to Tail Rule
Addition of Vectors | By Head to Tail Rule.
On this presentation i describe all about addition of vectors with head to tail rule with graphs and pics. Read and learn about addition.
Business statistics homework help service
This document provides information about a business statistics homework help service and examples of how to solve common business statistics problems. It discusses shifting trend origins and converting trend equations between different time periods, such as annual, monthly, and quarterly. Customers can contact the statistics help desk for homework assistance via phone, email, social media, or their blog.
QUARTILES, DECILES AND PERCENTILES
This document discusses different methods for organizing data, including percentiles, quartiles, and deciles. It provides the definitions and formulas for calculating each. Percentiles indicate the value below which a given percentage of observations fall. Quartiles divide a data set into four equal parts, with the median (Q2) separating the lower and upper halves. Deciles divide a data set into ten equal parts. The document gives examples of calculating percentiles, quartiles, and deciles for sample data sets.
Medidas de tendencia central
The document discusses different measures of central tendency (mean, median, mode). It provides examples of calculating these values for various data sets, including test scores, body mass, and height. It defines each measure and shows how to calculate the mean as the sum of all values divided by the number of data points, the median as the middle value when data is ordered from lowest to highest, and the mode as the most frequent value.
Data analysis, statistics, and probability review
This document provides an overview of topics related to data analysis, statistics, and probability that may be covered on the SAT. It includes brief explanations of different types of graphs used to display data, guidelines for interpreting data from graphs, tables, and charts, definitions and examples of common statistical concepts like mean, median, mode, and weighted average, and explanations of probability, independent and dependent events, and calculating probabilities using geometric models. Practice problems with solutions are provided as examples.
Quartile (ungrouped)
The document discusses measures of position for ungrouped data including quartiles, deciles, and percentiles. It specifically describes quartiles, which divide a distribution into four equal parts (Q1, Q2, Q3). The Mendenhall and Sincich method is presented for finding quartile values using a formula based on the number of data points. The method involves arranging data in order and determining the quartile positions. Linear interpolation is described for estimating quartile values that fall between data points. An example applies these methods to calculate quartiles for a set of student test scores.
Review on module 9
This document discusses bivariate data and scatter plots. Bivariate data involves collecting two variables in a research study: an independent variable that can cause changes in the dependent variable, which is influenced by the independent variable. Scatter plots are diagrams used to show the relationship between two sets of bivariate data by plotting them on an x-y coordinate plane. They can reveal positive or negative correlations depending on whether the points form an upward or downward sloping line. Two examples are given of scatter plots analyzing students' study/game time versus test scores.
quartiles,deciles,percentiles.ppt
This document defines and discusses quartiles, deciles, and percentiles. Quartiles divide a data set into four equal parts, with the first quartile (Q1) representing the lowest 25% of values. Deciles divide data into ten equal parts. Percentiles indicate the value below which a certain percentage of observations fall. Examples are provided for calculating Q1, Q3, D1 using formulas for grouped and ungrouped data sets. Quartiles, deciles, and percentiles are commonly used to summarize and report on statistical data.
Partitial values
This document defines percentiles, quartiles, and deciles as measures of statistical dispersion. It provides examples of calculating percentages from a data set and determining percentile rankings. Specifically, it shows how to find the percentile ranking of a value within a data set by counting the number of values below it. It also demonstrates how to determine the value that exists at a given percentile ranking by using the formula value # = percentile/(100/(n+1)).
Ch 1 Review
The document is a review sheet for a math test covering Chapter 1. It contains 16 multiple choice questions and 2 numeric response questions testing concepts like opposites, order of operations, absolute value, quadrants, and evaluating expressions. The review sheet provides practice for the Chapter 1 test the next day.
Exponents and powers--Part1
Scientific notation is used to write very large or small numbers in a standardized way. It takes the form of a number between 1 and 10 multiplied by a power of 10. This makes it easier to work with numbers that scientists and engineers commonly use. Standard form is the normal way we write numbers, while scientific notation moves the decimal place to have a leading digit between 1 and 9, and adds an exponent of 10 to show how many places the decimal was moved. This allows even huge and tiny numbers to be expressed concisely for calculations and comparisons.
Mann Whitney U Test And Chi Squared
The document provides instructions for performing the Mann-Whitney U test and the Chi-squared test. The Mann-Whitney U test can be used to compare two independent groups when the dependent variable is either ordinal or continuous. It involves ranking all observations from both groups together and comparing the sums of the ranks from each group. The Chi-squared test determines if there is a significant association between two categorical variables. It involves calculating expected frequencies and comparing them to observed frequencies using a Chi-squared distribution. Examples are given for performing both tests and interpreting their results.
4.3 Dilation and Composition
Identify dilations
Identify scale factors and solve proportions
Draw compositions of transformations
Quartile Deviation
This document contains the scores of 8 students in a management statistics course. It shows the individual scores ranging from 17 to 37. It then calculates the first quartile (Q1) as 21.5 and the third quartile (Q3) as 30.5. The interquartile range (IQR) is calculated as the difference between Q3 and Q1, which is 4.5. Formulas are also provided for calculating Q1 and Q3 based on the class size, total number of scores, and cumulative frequency.
Stopping Problems
This document summarizes Mohamed Seif's work on stopping problems. It introduces stopping problems, which involve choosing when to stop collecting information and make a decision. It then provides preliminaries on hypothesis testing. The main focus is on the sequential probability ratio test, which sequentially updates probabilities based on likelihood ratios of observations. Thresholds are used to determine when to stop observing and make a decision. The sequential probability ratio test is applied to the problem of compressive spectrum sensing in wireless networks.
Lesson 2 percentiles
Percentiles are positional measures used to indicate an individual's position within a group. They divide a data set into 100 equal parts, with percentiles (denoted Px) indicating what percent of values are less than a specified value. Common percentiles include the median (P50), quartiles (P25, P50, P75), and deciles. Percentiles are calculated using a formula that determines the position number based on the total number of data points and percentile value. This position is then used to find the corresponding value within ordered data.
Linear graph[1]edit
This document discusses linear graphs. It defines linear graphs as straight lines represented by the equation y=mx+c, where m is the gradient (steepness) and c is the y-intercept (where the graph crosses the y-axis). The document generates coordinate pairs from sample linear equations, plots the points on a graph, and draws the line connecting the points. It demonstrates that lines with different gradients (m values) have different slopes, and lines with different y-intercepts (c values) cross the y-axis at different points.
Understanding Statistics 1#12 Quartiles of Data
To understand a quartile, let us revisit median. For median, we cut off the data into two groups with equal number of points. Thus the middle value that separates these groups is the median. In the same way if we divide the data into 4 equal groups, the first differentiating point is the first quartile, the second differentiating point is the second quartile (which is the same as the median) and the third differentiating point is the third quartile.
To further see what quartiles do, the first quartile is at the 25th percentile. This means that 25% of the data is smaller than the first quartile and 75% of the data is larger than this. Similarly, in case of the third quartile, 25% of the data is larger than it while 75% of it is smaller. For the second quartile, which is nothing but the median, 50% or half of the data is smaller while half of the data is larger than this value
Education 309 – Statistics for Educational Research
This document discusses measures of variability and quartile deviation. It defines quantiles as values that divide a data set into equal parts, including the median, quartiles, deciles, and percentiles. Quartiles (Q1, Q2, Q3) divide the data into four equal parts. The interquartile range is the difference between Q3 and Q1. The quartile deviation is half the interquartile range, or (Q3 - Q1)/2. The document provides steps for calculating quartiles and quartile deviation from both ungrouped and grouped data sets. An example calculation is shown for grouped test score data.
Chapter 13 finding relationships
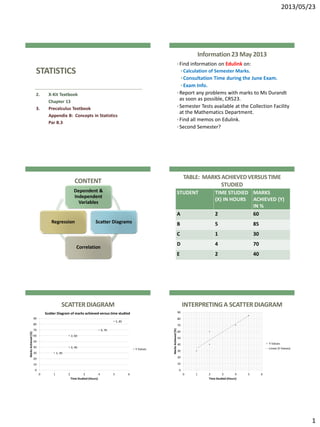
This document contains information about statistics concepts like dependent and independent variables, scatter diagrams, correlation, and regression. It discusses how to interpret a scatter diagram and calculate the correlation coefficient to determine the strength of the linear relationship between two variables. An example looks at the relationship between marks achieved and time studied for 5 students. It finds a strong positive correlation and uses regression to determine the line of best fit and coefficient of determination. The document explains how to use the line of best fit to make predictions, like predicting a student's mark if they studied for a certain number of hours.
TRIANGULOS
El documento proporciona instrucciones para identificar y dibujar diferentes tipos de triángulos según la longitud de sus lados, y también incluye ejercicios para calcular los grados de ángulos desconocidos en triángulos usando la propiedad de que la suma de los ángulos internos es 180 grados.
Proyecto final informatica
Este documento trata sobre el maltrato animal y la falta de conciencia sobre el cuidado y respeto de los animales. Describe cómo el maltrato animal ha aumentado a pesar de los esfuerzos para crear conciencia. El objetivo es generar reflexión sobre el trato que damos a los animales y enseñar a los niños a cuidarlos. Concluye que debemos respetar a todos los seres vivos y educar a los animales domésticos para que no sean agresivos.
Legislación Laboral Aplicada
Este documento describe los principios fundamentales de la legislación laboral colombiana, incluyendo la libertad de trabajo, la obligatoriedad de trabajo, la protección del trabajo, la igualdad de derechos, la primacía de la realidad, la favorabilidad, la estabilidad y la irrenunciabilidad de beneficios mínimos. También explica los mecanismos de garantía de los derechos laborales como el derecho de petición, la acción de tutela, la conciliación y la transacción.
Customer Experience - Changing Shopping Experiences In India – End to End Bra...
At the recently concluded eTailing India Expo 2017 – “India’s Flagship Conference & Exhibition on Retail, eCommerce and Mobile” (http://etailingindiaexpo.com), leading thought leaders shared their perspective on “Technology Services for Retail &eCommerce”. This article summarizes the session for Customer Experience: Changing Shopping Experiences in India – End to End Brand Experience.
5 Tech-Enabled Business Trends in 2017
The rapidly shifting technology environment raises serious questions on how to help their companies capitalize on the transformation under way. Advancing technologies and their swift adoption are upending traditional business models. So, today we bring you Five Hottest Tech-Enabled Business Trends in 2017.
More Related Content
What's hot
Medidas de tendencia central
The document discusses different measures of central tendency (mean, median, mode). It provides examples of calculating these values for various data sets, including test scores, body mass, and height. It defines each measure and shows how to calculate the mean as the sum of all values divided by the number of data points, the median as the middle value when data is ordered from lowest to highest, and the mode as the most frequent value.
Data analysis, statistics, and probability review
This document provides an overview of topics related to data analysis, statistics, and probability that may be covered on the SAT. It includes brief explanations of different types of graphs used to display data, guidelines for interpreting data from graphs, tables, and charts, definitions and examples of common statistical concepts like mean, median, mode, and weighted average, and explanations of probability, independent and dependent events, and calculating probabilities using geometric models. Practice problems with solutions are provided as examples.
Quartile (ungrouped)
The document discusses measures of position for ungrouped data including quartiles, deciles, and percentiles. It specifically describes quartiles, which divide a distribution into four equal parts (Q1, Q2, Q3). The Mendenhall and Sincich method is presented for finding quartile values using a formula based on the number of data points. The method involves arranging data in order and determining the quartile positions. Linear interpolation is described for estimating quartile values that fall between data points. An example applies these methods to calculate quartiles for a set of student test scores.
Review on module 9
This document discusses bivariate data and scatter plots. Bivariate data involves collecting two variables in a research study: an independent variable that can cause changes in the dependent variable, which is influenced by the independent variable. Scatter plots are diagrams used to show the relationship between two sets of bivariate data by plotting them on an x-y coordinate plane. They can reveal positive or negative correlations depending on whether the points form an upward or downward sloping line. Two examples are given of scatter plots analyzing students' study/game time versus test scores.
quartiles,deciles,percentiles.ppt
This document defines and discusses quartiles, deciles, and percentiles. Quartiles divide a data set into four equal parts, with the first quartile (Q1) representing the lowest 25% of values. Deciles divide data into ten equal parts. Percentiles indicate the value below which a certain percentage of observations fall. Examples are provided for calculating Q1, Q3, D1 using formulas for grouped and ungrouped data sets. Quartiles, deciles, and percentiles are commonly used to summarize and report on statistical data.
Partitial values
This document defines percentiles, quartiles, and deciles as measures of statistical dispersion. It provides examples of calculating percentages from a data set and determining percentile rankings. Specifically, it shows how to find the percentile ranking of a value within a data set by counting the number of values below it. It also demonstrates how to determine the value that exists at a given percentile ranking by using the formula value # = percentile/(100/(n+1)).
Ch 1 Review
The document is a review sheet for a math test covering Chapter 1. It contains 16 multiple choice questions and 2 numeric response questions testing concepts like opposites, order of operations, absolute value, quadrants, and evaluating expressions. The review sheet provides practice for the Chapter 1 test the next day.
Exponents and powers--Part1
Scientific notation is used to write very large or small numbers in a standardized way. It takes the form of a number between 1 and 10 multiplied by a power of 10. This makes it easier to work with numbers that scientists and engineers commonly use. Standard form is the normal way we write numbers, while scientific notation moves the decimal place to have a leading digit between 1 and 9, and adds an exponent of 10 to show how many places the decimal was moved. This allows even huge and tiny numbers to be expressed concisely for calculations and comparisons.
Mann Whitney U Test And Chi Squared
The document provides instructions for performing the Mann-Whitney U test and the Chi-squared test. The Mann-Whitney U test can be used to compare two independent groups when the dependent variable is either ordinal or continuous. It involves ranking all observations from both groups together and comparing the sums of the ranks from each group. The Chi-squared test determines if there is a significant association between two categorical variables. It involves calculating expected frequencies and comparing them to observed frequencies using a Chi-squared distribution. Examples are given for performing both tests and interpreting their results.
4.3 Dilation and Composition
Identify dilations
Identify scale factors and solve proportions
Draw compositions of transformations
Quartile Deviation
This document contains the scores of 8 students in a management statistics course. It shows the individual scores ranging from 17 to 37. It then calculates the first quartile (Q1) as 21.5 and the third quartile (Q3) as 30.5. The interquartile range (IQR) is calculated as the difference between Q3 and Q1, which is 4.5. Formulas are also provided for calculating Q1 and Q3 based on the class size, total number of scores, and cumulative frequency.
Stopping Problems
This document summarizes Mohamed Seif's work on stopping problems. It introduces stopping problems, which involve choosing when to stop collecting information and make a decision. It then provides preliminaries on hypothesis testing. The main focus is on the sequential probability ratio test, which sequentially updates probabilities based on likelihood ratios of observations. Thresholds are used to determine when to stop observing and make a decision. The sequential probability ratio test is applied to the problem of compressive spectrum sensing in wireless networks.
Lesson 2 percentiles
Percentiles are positional measures used to indicate an individual's position within a group. They divide a data set into 100 equal parts, with percentiles (denoted Px) indicating what percent of values are less than a specified value. Common percentiles include the median (P50), quartiles (P25, P50, P75), and deciles. Percentiles are calculated using a formula that determines the position number based on the total number of data points and percentile value. This position is then used to find the corresponding value within ordered data.
Linear graph[1]edit
This document discusses linear graphs. It defines linear graphs as straight lines represented by the equation y=mx+c, where m is the gradient (steepness) and c is the y-intercept (where the graph crosses the y-axis). The document generates coordinate pairs from sample linear equations, plots the points on a graph, and draws the line connecting the points. It demonstrates that lines with different gradients (m values) have different slopes, and lines with different y-intercepts (c values) cross the y-axis at different points.
Understanding Statistics 1#12 Quartiles of Data
To understand a quartile, let us revisit median. For median, we cut off the data into two groups with equal number of points. Thus the middle value that separates these groups is the median. In the same way if we divide the data into 4 equal groups, the first differentiating point is the first quartile, the second differentiating point is the second quartile (which is the same as the median) and the third differentiating point is the third quartile.
To further see what quartiles do, the first quartile is at the 25th percentile. This means that 25% of the data is smaller than the first quartile and 75% of the data is larger than this. Similarly, in case of the third quartile, 25% of the data is larger than it while 75% of it is smaller. For the second quartile, which is nothing but the median, 50% or half of the data is smaller while half of the data is larger than this value
Education 309 – Statistics for Educational Research
This document discusses measures of variability and quartile deviation. It defines quantiles as values that divide a data set into equal parts, including the median, quartiles, deciles, and percentiles. Quartiles (Q1, Q2, Q3) divide the data into four equal parts. The interquartile range is the difference between Q3 and Q1. The quartile deviation is half the interquartile range, or (Q3 - Q1)/2. The document provides steps for calculating quartiles and quartile deviation from both ungrouped and grouped data sets. An example calculation is shown for grouped test score data.
What's hot (16)
Education 309 – Statistics for Educational Research
Education 309 – Statistics for Educational Research
Viewers also liked
Chapter 13 finding relationships
This document contains information about statistics concepts like dependent and independent variables, scatter diagrams, correlation, and regression. It discusses how to interpret a scatter diagram and calculate the correlation coefficient to determine the strength of the linear relationship between two variables. An example looks at the relationship between marks achieved and time studied for 5 students. It finds a strong positive correlation and uses regression to determine the line of best fit and coefficient of determination. The document explains how to use the line of best fit to make predictions, like predicting a student's mark if they studied for a certain number of hours.
TRIANGULOS
El documento proporciona instrucciones para identificar y dibujar diferentes tipos de triángulos según la longitud de sus lados, y también incluye ejercicios para calcular los grados de ángulos desconocidos en triángulos usando la propiedad de que la suma de los ángulos internos es 180 grados.
Proyecto final informatica
Este documento trata sobre el maltrato animal y la falta de conciencia sobre el cuidado y respeto de los animales. Describe cómo el maltrato animal ha aumentado a pesar de los esfuerzos para crear conciencia. El objetivo es generar reflexión sobre el trato que damos a los animales y enseñar a los niños a cuidarlos. Concluye que debemos respetar a todos los seres vivos y educar a los animales domésticos para que no sean agresivos.
Legislación Laboral Aplicada
Este documento describe los principios fundamentales de la legislación laboral colombiana, incluyendo la libertad de trabajo, la obligatoriedad de trabajo, la protección del trabajo, la igualdad de derechos, la primacía de la realidad, la favorabilidad, la estabilidad y la irrenunciabilidad de beneficios mínimos. También explica los mecanismos de garantía de los derechos laborales como el derecho de petición, la acción de tutela, la conciliación y la transacción.
Customer Experience - Changing Shopping Experiences In India – End to End Bra...
At the recently concluded eTailing India Expo 2017 – “India’s Flagship Conference & Exhibition on Retail, eCommerce and Mobile” (http://etailingindiaexpo.com), leading thought leaders shared their perspective on “Technology Services for Retail &eCommerce”. This article summarizes the session for Customer Experience: Changing Shopping Experiences in India – End to End Brand Experience.
5 Tech-Enabled Business Trends in 2017
The rapidly shifting technology environment raises serious questions on how to help their companies capitalize on the transformation under way. Advancing technologies and their swift adoption are upending traditional business models. So, today we bring you Five Hottest Tech-Enabled Business Trends in 2017.
The Boon of Cross Border E-commerce
International express services provider DHL Express has launched a new service - ‘On Demand Delivery’ - enabling shippers in India to give their receivers across the border, the power to select from a range of delivery options.
eTailing India Expo Mumbai 2017 - Recap
With eTailing India, we are focused on building a world class knowledge platform through conferences, exhibitions & workshops. This year with eTailing India Expo 2017, we brought to you THE LARGEST eCommerce, Retail & Mobile Conference & Exhibition. Thousands of people will converge to Mumbai, with unique backgrounds and different experiences. Ready to question themselves and get inspired by others who are thriving in the Retail and eCommerce industry.
Chapter 8
The document discusses Intelligent Transportation Systems (ITS). ITS uses technologies like sensors, microchips and wireless communication to make transportation systems more efficient and safe. It allows different elements of transportation infrastructure like vehicles, traffic lights and message signs to communicate with each other. ITS aims to reduce traffic, environmental impact and accidents through real-time traffic information and communication between vehicles and infrastructure. ITS has become necessary due to high road accident deaths worldwide. Traditional safety improvements are not enough to address this problem so ITS provides a better solution through improved safety, mobility and connectivity. The document outlines some ITS applications for traffic management, commuters and emergency response.
Chapter 7
The document discusses various aspects of traffic regulation and control including driver controls, vehicle controls, traffic flow regulations, and general controls as per the Motor Vehicle Act. It describes different types of traffic control devices like signs, signals, markings, and islands. Specific topics covered include one-way streets, advantages and disadvantages of one-way systems, types of regulatory signs like stop, give way, prohibitory, no parking signs. Warning and informative signs are also explained.
6) gemo 005 guia tecnica audiometria
Este documento proporciona una guía técnica para realizar audiometrías ocupacionales. Explica el objetivo de identificar alteraciones de la audición relacionadas con la exposición a ruido en el trabajo. Describe los procedimientos, equipos y condiciones requeridas para realizar una evaluación audiométrica confiable, incluidos los requisitos para el operador, audiómetro, cámara acústica y laboratorio. También detalla las etapas de la evaluación, como la otoscopia, pruebas con diapasones y
Viewers also liked (11)
Customer Experience - Changing Shopping Experiences In India – End to End Bra...
Customer Experience - Changing Shopping Experiences In India – End to End Bra...
Similar to Chapter 13 finding relationships
Data mining 8 estimasi linear regression
Linear regression is a statistical method used to analyze and understand the relationship between two or more variables. It predicts a numeric target variable based on one or more independent variables. Single linear regression uses one independent variable to predict the dependent variable based on a linear equation. The document provides examples of calculating linear regression coefficients and making predictions using the linear regression equation. It also discusses evaluating linear regression models using metrics like MAE, MSE, and RMSE.
STANDARD DEVIATION (2018) (STATISTICS)
THIS IS A QUICK AND EASY METHOD TO LEARN STANDARD DEVIATION FOR DISCRETE AND GROUPED FREQUENCY DISTRIBUTION.
IT GIVES A STEP BY STEP, SIMPLE EXPLANATION OF PROBLEMS WITH FORMULAE.
SO WATCH THE ENTIRE VIDEO TODAY.
Measures of Central Tendency.pptx
The document provides information on measures of central tendency. It discusses five main measures - arithmetic mean, geometric mean, harmonic mean, mode, and median. For arithmetic mean, it provides formulas and examples for calculating the mean from ungrouped and grouped data using both the direct and assumed mean methods. It also discusses the merits and demerits of each measure.
Predictive Modelling
Predictive modeling aims to generate accurate estimates of future outcomes by analyzing current and historical data using statistical and machine learning techniques. It involves gathering data, exploring the data, building predictive models using algorithms like regression, decision trees, and neural networks, and evaluating the models. Some common predictive modeling techniques include time series analysis, regression analysis, and clustering algorithms.
Lesson 27 using statistical techniques in analyzing data
The document discusses statistical techniques for analyzing data, including scatter diagrams, correlation coefficients, regression analysis, and chi-square tests. It provides examples of using scatter diagrams to visualize the relationship between two variables, calculating the Pearson correlation coefficient to determine the strength of linear relationships, and using simple linear regression to find the regression equation that best predicts a dependent variable from an independent variable. It also explains how to perform a chi-square test to analyze relationships between categorical variables by comparing observed and expected frequencies.
Measures of-variation
1) The range, interquartile range, average deviation, variance, and standard deviation are common measures used to describe the distribution and variability of data.
2) The range is the difference between the greatest and least values in a data set. The interquartile range describes variability by looking at the spread between the first and third quartiles.
3) Variance and standard deviation both consider how far each observation is from the mean, with variance being the average of the squared deviations and standard deviation being the square root of the variance.
Frequency Distribution Table 3
This document discusses the preparation of frequency distribution tables for continuous data series. It provides examples and steps for creating a grouped frequency distribution table, including deciding the number of classes, determining the range and class interval, and obtaining the class limits and frequencies to summarize the distribution. An example is given using test marks from 60 students to demonstrate creating a table with 10 class intervals. The document also includes review questions to assess understanding of key concepts like discrete versus continuous frequency distributions, exclusive classification limits, and how the number of classes is determined.
frequency distribution table 3
This document discusses the preparation of frequency distribution tables for continuous data series. It provides examples and steps for creating a grouped frequency distribution table, including deciding the number of classes, determining the range and class interval, and obtaining the class limits and frequencies to summarize the distribution. An example is given using test marks from 60 students to demonstrate creating a table with 10 class intervals. The document also includes review questions to assess understanding of key concepts like discrete versus continuous frequency distributions, exclusive classification limits, and how the number of classes is determined.
Machine learning meetup
With R, Python, Apache Spark and a plethora of other open source tools, anyone with a computer can run machine learning algorithms in a jiffy! However, without an understanding of which algorithms to choose and when to apply a particular technique, most machine learning efforts turn into trial and error experiments with conclusions like "The algorithms don't work" or "Perhaps we should get more data".
In this lecture, we will focus on the key tenets of machine learning algorithms and how to choose an algorithm for a particular purpose. Rather than just showing how to run experiments in R ,Python or Apache Spark, we will provide an intuitive introduction to machine learning with just enough mathematics and basic statistics.
We will address:
• How do you differentiate Clustering, Classification and Prediction algorithms?
• What are the key steps in running a machine learning algorithm?
• How do you choose an algorithm for a specific goal?
• Where does exploratory data analysis and feature engineering fit into the picture?
• Once you run an algorithm, how do you evaluate the performance of an algorithm?
Types of graphs
This document provides information on different types of charts and graphs used in statistics. It defines bar graphs, pie charts, histograms, frequency polygons, ogives, pictograms and discusses their uses, advantages and disadvantages. Examples are given for each type of graph to demonstrate how they are constructed and how data is represented visually. Key information on choosing appropriate scales and plotting points for different graphs is also presented.
Measures of central tendency - STATISTICS
This document discusses measures of central tendency, specifically mean, median, and mode. It begins by defining measures of central tendency as averages that represent central or typical values within a data set. The document then outlines different methods for calculating the mean, or arithmetic average, of both raw (ungrouped) and grouped data sets. It provides examples of calculating the mean of raw data sets directly using the formula for mean, and through the assumed mean method which uses deviations from an assumed mean to simplify calculations for large data sets. The document emphasizes that the mean is the sum of all values divided by the number of values. It also discusses how mean is calculated for grouped data by assigning values to class intervals based on their midpoints.
Class X Mathematics Study Material
The document provides study material for mathematics for class 10 students of Kendriya Vidyalaya Sangathan. It was prepared by the Patna regional office in accordance with instructions from KVS headquarters. The study material aims to help students understand concepts well and meet quality expectations. It was prepared under the guidance of the Deputy Commissioner with contributions from teachers of KV No. 2 Gaya.
Mod 4 data presentation graphs bar charts tables
This document provides an overview of descriptive statistics and data representation techniques. It discusses measures of central tendency including the mean, median, and mode. It also covers different ways to present quantitative data visually, including graphs, tables, scatterplots, bar charts, histograms, and frequency polygons. The key purposes of descriptive statistics and data representation are to summarize patterns in data sets and communicate information effectively.
MEASURES OF DISPERSION NOTES.pdf
The document discusses various measures of dispersion used to quantify how data values are spread around the average value. It describes measures such as range, interquartile range, mean deviation, standard deviation, variance, and coefficient of variation. Standard deviation is highlighted as the most important measure of dispersion as it is widely used and capable of further algebraic treatment. Different methods for calculating standard deviation for individual series, discrete series, and continuous series are provided along with examples. The key properties and appropriate uses of each measure are also outlined.
ITEM ANALYSIS
UMT, Test Construction 2, Test Construction II, Item Analysis, Test Analysis, Test Construction, Discrimination Index, Difficulty Index, Waqas A. Khan, Prof. Dr. Abdul Hameed, Abdul Hameed, Dr. Abdul Hameed, SSH, University of Management and Technology, University of Management & Technology, www.waqas.org
Ee184405 statistika dan stokastik statistik deskriptif 1 grafik
Statistika adalah suatu bidang ilmu yang mempelajari cara-cara mengumpulkan data untuk selanjutnya dapat dideskripsikan dan diolah, kemudian melakukan induksi/inferensi dalam rangka membuat kesimpulan, agar dapat ditentukan keputusan yang akan diambil berdasarkan data yang dimiliki.
DATA =============> PROSES STATISTIK ===========> INFORMASI
Statistik Deskriptif adalah suatu cara menggambarkan persoalan yang berdasarkan data yang dimiliki yakni dengan cara menata data tersebut sedemikian rupa agar karakteristik data dapat dipahami dengan mudah sehingga berguna untuk keperluan selanjutnya.
633e639cc8efda0018e1ca63_##_Graphical Representation 01 _ Class Notes __ (Vic...
This document discusses different methods of graphically representing statistical data, including histograms, frequency polygons, and ogives (cumulative frequency curves). It provides examples of how to construct each type of graph using sample data. Histograms involve drawing rectangles with bases proportional to class intervals and heights proportional to frequencies. Ogives involve plotting cumulative frequencies on the y-axis against upper class limits on the x-axis and joining the points with a curve. Examples and step-by-step instructions are given for drawing each graph.
refreshENM1500.pdf
This document provides an overview of fundamental arithmetic concepts including:
1) The real number system and identifying types of real numbers.
2) The order of operations for performing calculations with real numbers, which specifies evaluating expressions in brackets first, then multiplication/division from left to right, followed by addition/subtraction from left to right.
3) Examples demonstrating the application of the order of operations without and with a calculator.
Pertemuan 1 pengukuran te d3
This document provides information about a Physics Applied course. It includes details such as the course code, credits, lecturer contact information, schedule, materials, assessment components, grading scale, and recommended textbooks. The course covers topics in mechanics including measurement, kinematics, dynamics, impulse and momentum, elasticity, electricity and magnetism, sound and optics. Student performance will be evaluated based on attitude, assignments, quizzes, midterm exam, and final exam.
plc learn
This document provides an overview of an INST 231 PLC Programming course, including objectives, schedule, assignments, and requirements. The key points are:
- The course teaches PLC wiring, programming, and configuration through theory sessions, labwork, exams, and a mastery exam requiring students to program a PLC to control a motor.
- Recommended daily schedules are provided for 4 sections covering PLC contact/coil/counter/timer programming and exams. Assignments include daily questions, lab activities, and optional feedback questions.
- Students must pass all mastery objectives by exam days to pass the course. Failure to do so results in re-takes or a failing grade. Grades are based
Similar to Chapter 13 finding relationships (20)
Lesson 27 using statistical techniques in analyzing data
Lesson 27 using statistical techniques in analyzing data
Ee184405 statistika dan stokastik statistik deskriptif 1 grafik
Ee184405 statistika dan stokastik statistik deskriptif 1 grafik
633e639cc8efda0018e1ca63_##_Graphical Representation 01 _ Class Notes __ (Vic...
633e639cc8efda0018e1ca63_##_Graphical Representation 01 _ Class Notes __ (Vic...
Recently uploaded
“I’m still / I’m still / Chaining from the Block”
“An Outlook of the Ongoing and Future Relationship between Blockchain Technologies and Process-aware Information Systems.” Invited talk at the joint workshop on Blockchain for Information Systems (BC4IS) and Blockchain for Trusted Data Sharing (B4TDS), co-located with with the 36th International Conference on Advanced Information Systems Engineering (CAiSE), 3 June 2024, Limassol, Cyprus.
GraphSummit Singapore | The Future of Agility: Supercharging Digital Transfor...
Leonard Jayamohan, Partner & Generative AI Lead, Deloitte
This keynote will reveal how Deloitte leverages Neo4j’s graph power for groundbreaking digital twin solutions, achieving a staggering 100x performance boost. Discover the essential role knowledge graphs play in successful generative AI implementations. Plus, get an exclusive look at an innovative Neo4j + Generative AI solution Deloitte is developing in-house.
Observability Concepts EVERY Developer Should Know -- DeveloperWeek Europe.pdf
Monitoring and observability aren’t traditionally found in software curriculums and many of us cobble this knowledge together from whatever vendor or ecosystem we were first introduced to and whatever is a part of your current company’s observability stack.
While the dev and ops silo continues to crumble….many organizations still relegate monitoring & observability as the purview of ops, infra and SRE teams. This is a mistake - achieving a highly observable system requires collaboration up and down the stack.
I, a former op, would like to extend an invitation to all application developers to join the observability party will share these foundational concepts to build on:
By Design, not by Accident - Agile Venture Bolzano 2024
As presented at the Agile Venture Bolzano, 4.06.2024
Uni Systems Copilot event_05062024_C.Vlachos.pdf
Unlocking Productivity: Leveraging the Potential of Copilot in Microsoft 365, a presentation by Christoforos Vlachos, Senior Solutions Manager – Modern Workplace, Uni Systems
GraphSummit Singapore | Enhancing Changi Airport Group's Passenger Experience...
Dr. Sean Tan, Head of Data Science, Changi Airport Group
Discover how Changi Airport Group (CAG) leverages graph technologies and generative AI to revolutionize their search capabilities. This session delves into the unique search needs of CAG’s diverse passengers and customers, showcasing how graph data structures enhance the accuracy and relevance of AI-generated search results, mitigating the risk of “hallucinations” and improving the overall customer journey.
GDG Cloud Southlake #33: Boule & Rebala: Effective AppSec in SDLC using Deplo...
Effective Application Security in Software Delivery lifecycle using Deployment Firewall and DBOM
The modern software delivery process (or the CI/CD process) includes many tools, distributed teams, open-source code, and cloud platforms. Constant focus on speed to release software to market, along with the traditional slow and manual security checks has caused gaps in continuous security as an important piece in the software supply chain. Today organizations feel more susceptible to external and internal cyber threats due to the vast attack surface in their applications supply chain and the lack of end-to-end governance and risk management.
The software team must secure its software delivery process to avoid vulnerability and security breaches. This needs to be achieved with existing tool chains and without extensive rework of the delivery processes. This talk will present strategies and techniques for providing visibility into the true risk of the existing vulnerabilities, preventing the introduction of security issues in the software, resolving vulnerabilities in production environments quickly, and capturing the deployment bill of materials (DBOM).
Speakers:
Bob Boule
Robert Boule is a technology enthusiast with PASSION for technology and making things work along with a knack for helping others understand how things work. He comes with around 20 years of solution engineering experience in application security, software continuous delivery, and SaaS platforms. He is known for his dynamic presentations in CI/CD and application security integrated in software delivery lifecycle.
Gopinath Rebala
Gopinath Rebala is the CTO of OpsMx, where he has overall responsibility for the machine learning and data processing architectures for Secure Software Delivery. Gopi also has a strong connection with our customers, leading design and architecture for strategic implementations. Gopi is a frequent speaker and well-known leader in continuous delivery and integrating security into software delivery.
Artificial Intelligence for XMLDevelopment
In the rapidly evolving landscape of technologies, XML continues to play a vital role in structuring, storing, and transporting data across diverse systems. The recent advancements in artificial intelligence (AI) present new methodologies for enhancing XML development workflows, introducing efficiency, automation, and intelligent capabilities. This presentation will outline the scope and perspective of utilizing AI in XML development. The potential benefits and the possible pitfalls will be highlighted, providing a balanced view of the subject.
We will explore the capabilities of AI in understanding XML markup languages and autonomously creating structured XML content. Additionally, we will examine the capacity of AI to enrich plain text with appropriate XML markup. Practical examples and methodological guidelines will be provided to elucidate how AI can be effectively prompted to interpret and generate accurate XML markup.
Further emphasis will be placed on the role of AI in developing XSLT, or schemas such as XSD and Schematron. We will address the techniques and strategies adopted to create prompts for generating code, explaining code, or refactoring the code, and the results achieved.
The discussion will extend to how AI can be used to transform XML content. In particular, the focus will be on the use of AI XPath extension functions in XSLT, Schematron, Schematron Quick Fixes, or for XML content refactoring.
The presentation aims to deliver a comprehensive overview of AI usage in XML development, providing attendees with the necessary knowledge to make informed decisions. Whether you’re at the early stages of adopting AI or considering integrating it in advanced XML development, this presentation will cover all levels of expertise.
By highlighting the potential advantages and challenges of integrating AI with XML development tools and languages, the presentation seeks to inspire thoughtful conversation around the future of XML development. We’ll not only delve into the technical aspects of AI-powered XML development but also discuss practical implications and possible future directions.
20240605 QFM017 Machine Intelligence Reading List May 2024
Everything I found interesting about machines behaving intelligently during May 2024
UiPath Test Automation using UiPath Test Suite series, part 5
Welcome to UiPath Test Automation using UiPath Test Suite series part 5. In this session, we will cover CI/CD with devops.
Topics covered:
CI/CD with in UiPath
End-to-end overview of CI/CD pipeline with Azure devops
Speaker:
Lyndsey Byblow, Test Suite Sales Engineer @ UiPath, Inc.
Alt. GDG Cloud Southlake #33: Boule & Rebala: Effective AppSec in SDLC using ...
Effective Application Security in Software Delivery lifecycle using Deployment Firewall and DBOM
The modern software delivery process (or the CI/CD process) includes many tools, distributed teams, open-source code, and cloud platforms. Constant focus on speed to release software to market, along with the traditional slow and manual security checks has caused gaps in continuous security as an important piece in the software supply chain. Today organizations feel more susceptible to external and internal cyber threats due to the vast attack surface in their applications supply chain and the lack of end-to-end governance and risk management.
The software team must secure its software delivery process to avoid vulnerability and security breaches. This needs to be achieved with existing tool chains and without extensive rework of the delivery processes. This talk will present strategies and techniques for providing visibility into the true risk of the existing vulnerabilities, preventing the introduction of security issues in the software, resolving vulnerabilities in production environments quickly, and capturing the deployment bill of materials (DBOM).
Speakers:
Bob Boule
Robert Boule is a technology enthusiast with PASSION for technology and making things work along with a knack for helping others understand how things work. He comes with around 20 years of solution engineering experience in application security, software continuous delivery, and SaaS platforms. He is known for his dynamic presentations in CI/CD and application security integrated in software delivery lifecycle.
Gopinath Rebala
Gopinath Rebala is the CTO of OpsMx, where he has overall responsibility for the machine learning and data processing architectures for Secure Software Delivery. Gopi also has a strong connection with our customers, leading design and architecture for strategic implementations. Gopi is a frequent speaker and well-known leader in continuous delivery and integrating security into software delivery.
FIDO Alliance Osaka Seminar: The WebAuthn API and Discoverable Credentials.pdf
FIDO Alliance Osaka Seminar
Encryption in Microsoft 365 - ExpertsLive Netherlands 2024
In this session I delve into the encryption technology used in Microsoft 365 and Microsoft Purview. Including the concepts of Customer Key and Double Key Encryption.
Securing your Kubernetes cluster_ a step-by-step guide to success !
Today, after several years of existence, an extremely active community and an ultra-dynamic ecosystem, Kubernetes has established itself as the de facto standard in container orchestration. Thanks to a wide range of managed services, it has never been so easy to set up a ready-to-use Kubernetes cluster.
However, this ease of use means that the subject of security in Kubernetes is often left for later, or even neglected. This exposes companies to significant risks.
In this talk, I'll show you step-by-step how to secure your Kubernetes cluster for greater peace of mind and reliability.
GraphSummit Singapore | Graphing Success: Revolutionising Organisational Stru...
Sudheer Mechineni, Head of Application Frameworks, Standard Chartered Bank
Discover how Standard Chartered Bank harnessed the power of Neo4j to transform complex data access challenges into a dynamic, scalable graph database solution. This keynote will cover their journey from initial adoption to deploying a fully automated, enterprise-grade causal cluster, highlighting key strategies for modelling organisational changes and ensuring robust disaster recovery. Learn how these innovations have not only enhanced Standard Chartered Bank’s data infrastructure but also positioned them as pioneers in the banking sector’s adoption of graph technology.
Unlock the Future of Search with MongoDB Atlas_ Vector Search Unleashed.pdf
Discover how MongoDB Atlas and vector search technology can revolutionize your application's search capabilities. This comprehensive presentation covers:
* What is Vector Search?
* Importance and benefits of vector search
* Practical use cases across various industries
* Step-by-step implementation guide
* Live demos with code snippets
* Enhancing LLM capabilities with vector search
* Best practices and optimization strategies
Perfect for developers, AI enthusiasts, and tech leaders. Learn how to leverage MongoDB Atlas to deliver highly relevant, context-aware search results, transforming your data retrieval process. Stay ahead in tech innovation and maximize the potential of your applications.
#MongoDB #VectorSearch #AI #SemanticSearch #TechInnovation #DataScience #LLM #MachineLearning #SearchTechnology
20240607 QFM018 Elixir Reading List May 2024
Everything I found interesting about the Elixir programming ecosystem in May 2024
A tale of scale & speed: How the US Navy is enabling software delivery from l...
Rapid and secure feature delivery is a goal across every application team and every branch of the DoD. The Navy’s DevSecOps platform, Party Barge, has achieved:
- Reduction in onboarding time from 5 weeks to 1 day
- Improved developer experience and productivity through actionable findings and reduction of false positives
- Maintenance of superior security standards and inherent policy enforcement with Authorization to Operate (ATO)
Development teams can ship efficiently and ensure applications are cyber ready for Navy Authorizing Officials (AOs). In this webinar, Sigma Defense and Anchore will give attendees a look behind the scenes and demo secure pipeline automation and security artifacts that speed up application ATO and time to production.
We will cover:
- How to remove silos in DevSecOps
- How to build efficient development pipeline roles and component templates
- How to deliver security artifacts that matter for ATO’s (SBOMs, vulnerability reports, and policy evidence)
- How to streamline operations with automated policy checks on container images
Recently uploaded (20)
GraphSummit Singapore | The Future of Agility: Supercharging Digital Transfor...
GraphSummit Singapore | The Future of Agility: Supercharging Digital Transfor...
Observability Concepts EVERY Developer Should Know -- DeveloperWeek Europe.pdf
Observability Concepts EVERY Developer Should Know -- DeveloperWeek Europe.pdf
By Design, not by Accident - Agile Venture Bolzano 2024
By Design, not by Accident - Agile Venture Bolzano 2024
GraphSummit Singapore | Enhancing Changi Airport Group's Passenger Experience...
GraphSummit Singapore | Enhancing Changi Airport Group's Passenger Experience...
GDG Cloud Southlake #33: Boule & Rebala: Effective AppSec in SDLC using Deplo...
GDG Cloud Southlake #33: Boule & Rebala: Effective AppSec in SDLC using Deplo...
20240605 QFM017 Machine Intelligence Reading List May 2024
20240605 QFM017 Machine Intelligence Reading List May 2024
UiPath Test Automation using UiPath Test Suite series, part 5
UiPath Test Automation using UiPath Test Suite series, part 5
Alt. GDG Cloud Southlake #33: Boule & Rebala: Effective AppSec in SDLC using ...
Alt. GDG Cloud Southlake #33: Boule & Rebala: Effective AppSec in SDLC using ...
FIDO Alliance Osaka Seminar: The WebAuthn API and Discoverable Credentials.pdf
FIDO Alliance Osaka Seminar: The WebAuthn API and Discoverable Credentials.pdf
Encryption in Microsoft 365 - ExpertsLive Netherlands 2024
Encryption in Microsoft 365 - ExpertsLive Netherlands 2024
Securing your Kubernetes cluster_ a step-by-step guide to success !
Securing your Kubernetes cluster_ a step-by-step guide to success !
GraphSummit Singapore | Graphing Success: Revolutionising Organisational Stru...
GraphSummit Singapore | Graphing Success: Revolutionising Organisational Stru...
Unlock the Future of Search with MongoDB Atlas_ Vector Search Unleashed.pdf
Unlock the Future of Search with MongoDB Atlas_ Vector Search Unleashed.pdf
A tale of scale & speed: How the US Navy is enabling software delivery from l...
A tale of scale & speed: How the US Navy is enabling software delivery from l...
Chapter 13 finding relationships
- 1. 2013/05/23 1 STATISTICS 2. X-Kit Textbook Chapter 13 3. Precalculus Textbook Appendix B: Concepts in Statistics Par B.3 Information23 May 2013 • Find information on Edulink on: • Calculation of Semester Marks. • Consultation Time during the June Exam. • Exam Info. • Report any problems with marks to Ms Durandt as soon as possible, CR523. • Semester Tests available at the Collection Facility at the Mathematics Department. • Find all memos on Edulink. • Second Semester? CONTENT Dependent & Independent Variables Scatter Diagrams Correlation Regression TABLE: MARKS ACHIEVEDVERSUSTIME STUDIED STUDENT TIME STUDIED (X) IN HOURS MARKS ACHIEVED (Y) IN % A 2 60 B 5 85 C 1 30 D 4 70 E 2 40 SCATTERDIAGRAM 2, 60 5, 85 1, 30 4, 70 2, 40 0 10 20 30 40 50 60 70 80 90 0 1 2 3 4 5 6 MarksAchieved(%) Time Studied (Hours) Scatter Diagram of marks achieved versus time studied Y-Values INTERPRETINGA SCATTERDIAGRAM 0 10 20 30 40 50 60 70 80 90 0 1 2 3 4 5 6 MarksAchieved(%) Time Studied (Hours) Y-Values Linear (Y-Values)
- 2. 2013/05/23 2 IS THERELATIONSHIPBETWEENVARIABLES STRONGOR WEAK? POSITIVE CORRELATION 0 5 10 15 20 25 30 35 40 0 2 4 6 Y-Values NEGATIVE CORRELATION 0 5 10 15 20 25 0 2 4 6 Y-Values IS THERELATIONSHIPBETWEENVARIABLES STRONGOR WEAK? NO CORRELATION 0 5 10 15 20 25 30 35 0 10 20 30 40 Y-Values NON-LINEAR CORRELATION 0 0.5 1 1.5 2 2.5 3 3.5 0 1 2 3 Y-Values SUMMINGUP CORRELATIONIN A NUMBER • The correlation coefficient 𝑟 is a number that tells us exactly how strong or weak the correlation between two variables is. • Calculate 𝑟 by using the formula: 𝒓 = 𝒙𝒚 − 𝒏𝒙 𝒚 𝒙 𝟐 − 𝒏𝒙 𝟐 𝒚 𝟐 − 𝒏𝒚 𝟐 • Calculate 𝑟 by using your calculator. THE MEANINGOF 𝒓 Perfect Strong Mode- rate Weak No Linear Correlation Weak Mode- rate Strong Perfect -1.00 -0.75 -0.50 -0.25 0.00 +0.25 +0.50 +0.75 +1.00 NEGATIVE CORRELATION POSITIVE CORRELATION CALCULATETHE CORRELATIONCOEFFICIENT: MARKS ACHIEVEDVERSUSTIME STUDIED STUDENT TIME STUDIED (X) IN HOURS MARKS ACHIEVED (Y) IN % A 2 60 B 5 85 C 1 30 D 4 70 E 2 40 SOLUTION 𝒓 = 𝟎. 𝟗𝟑𝟕 Very Strong Positive Linear Relationship
- 3. 2013/05/23 3 MAKE PREDICTIONS Follow the plan: •Find the LINE OF BEST FIT. •Decide how “well” it fits. •From a good fit we can make predictions. LINE OF BESTFIT (REGRESSIONLINE) • Formula 𝒚 = 𝒂 + 𝒃𝒙 • Formula for the regression coefficients: 𝒃 = 𝒙𝒚 − 𝒏𝒙 𝒚 𝒙 𝟐 − 𝒏𝒙 𝟐 𝒂 = 𝒚 − 𝒃𝒙 • Use your calculator to calculate the regression coefficients. CALCULATETHE REGRESSIONCOEFFICIENT: MARKS ACHIEVEDVERSUSTIME STUDIED STUDENT TIME STUDIED (X) IN HOURS MARKS ACHIEVED (Y) IN % A 2 60 B 5 85 C 1 30 D 4 70 E 2 40 LINE OF BESTFIT 𝒚 = 𝟐𝟏. 𝟓 + 𝟏𝟐. 𝟕𝒙 INTERPRETINGA SCATTERDIAGRAM y = 12.685x + 21.481 R² = 0.8777 0 10 20 30 40 50 60 70 80 90 0 1 2 3 4 5 6 MarksAchieved(%) Time Studied (Hours) Y-Values Y-Values Linear (Y-Values) MEASURINGHOW WELL THELINE FITS • How well does our line fit the real data? How accurate is our model? • 𝑟 , the CORRELATION COEFFICIENT tells us how STRONG the relationship is between two variables, or how closely the data fits our line. • 𝑟2 , the COEFFICIENT OF DETERMINATION measure the ACCURACY of our predictions. For a perfect fit 𝑟2 = 1 , closer to zero indicate a poorer fit. • The coefficient of determination tells us that 87.8% of the variation in students’ marks is linked to the amount of time they spend studying. The other 12.2% is due to other factors, like intelligence levels.
- 4. 2013/05/23 4 PREDICTINGFROMTHELINE OF “BEST FIT” If your friend only study for 2.5 hours, will he pass the test? 𝒚 = 𝟐𝟏. 𝟓 + 𝟏𝟐. 𝟕𝒙 HOMEWORK •Example X-Kit textbook page 310 – 311. •Practise for your exams page 312 number 1, 2, 3, 4, 5, & 6. •Par B.3 (page B14) all odd number questions.