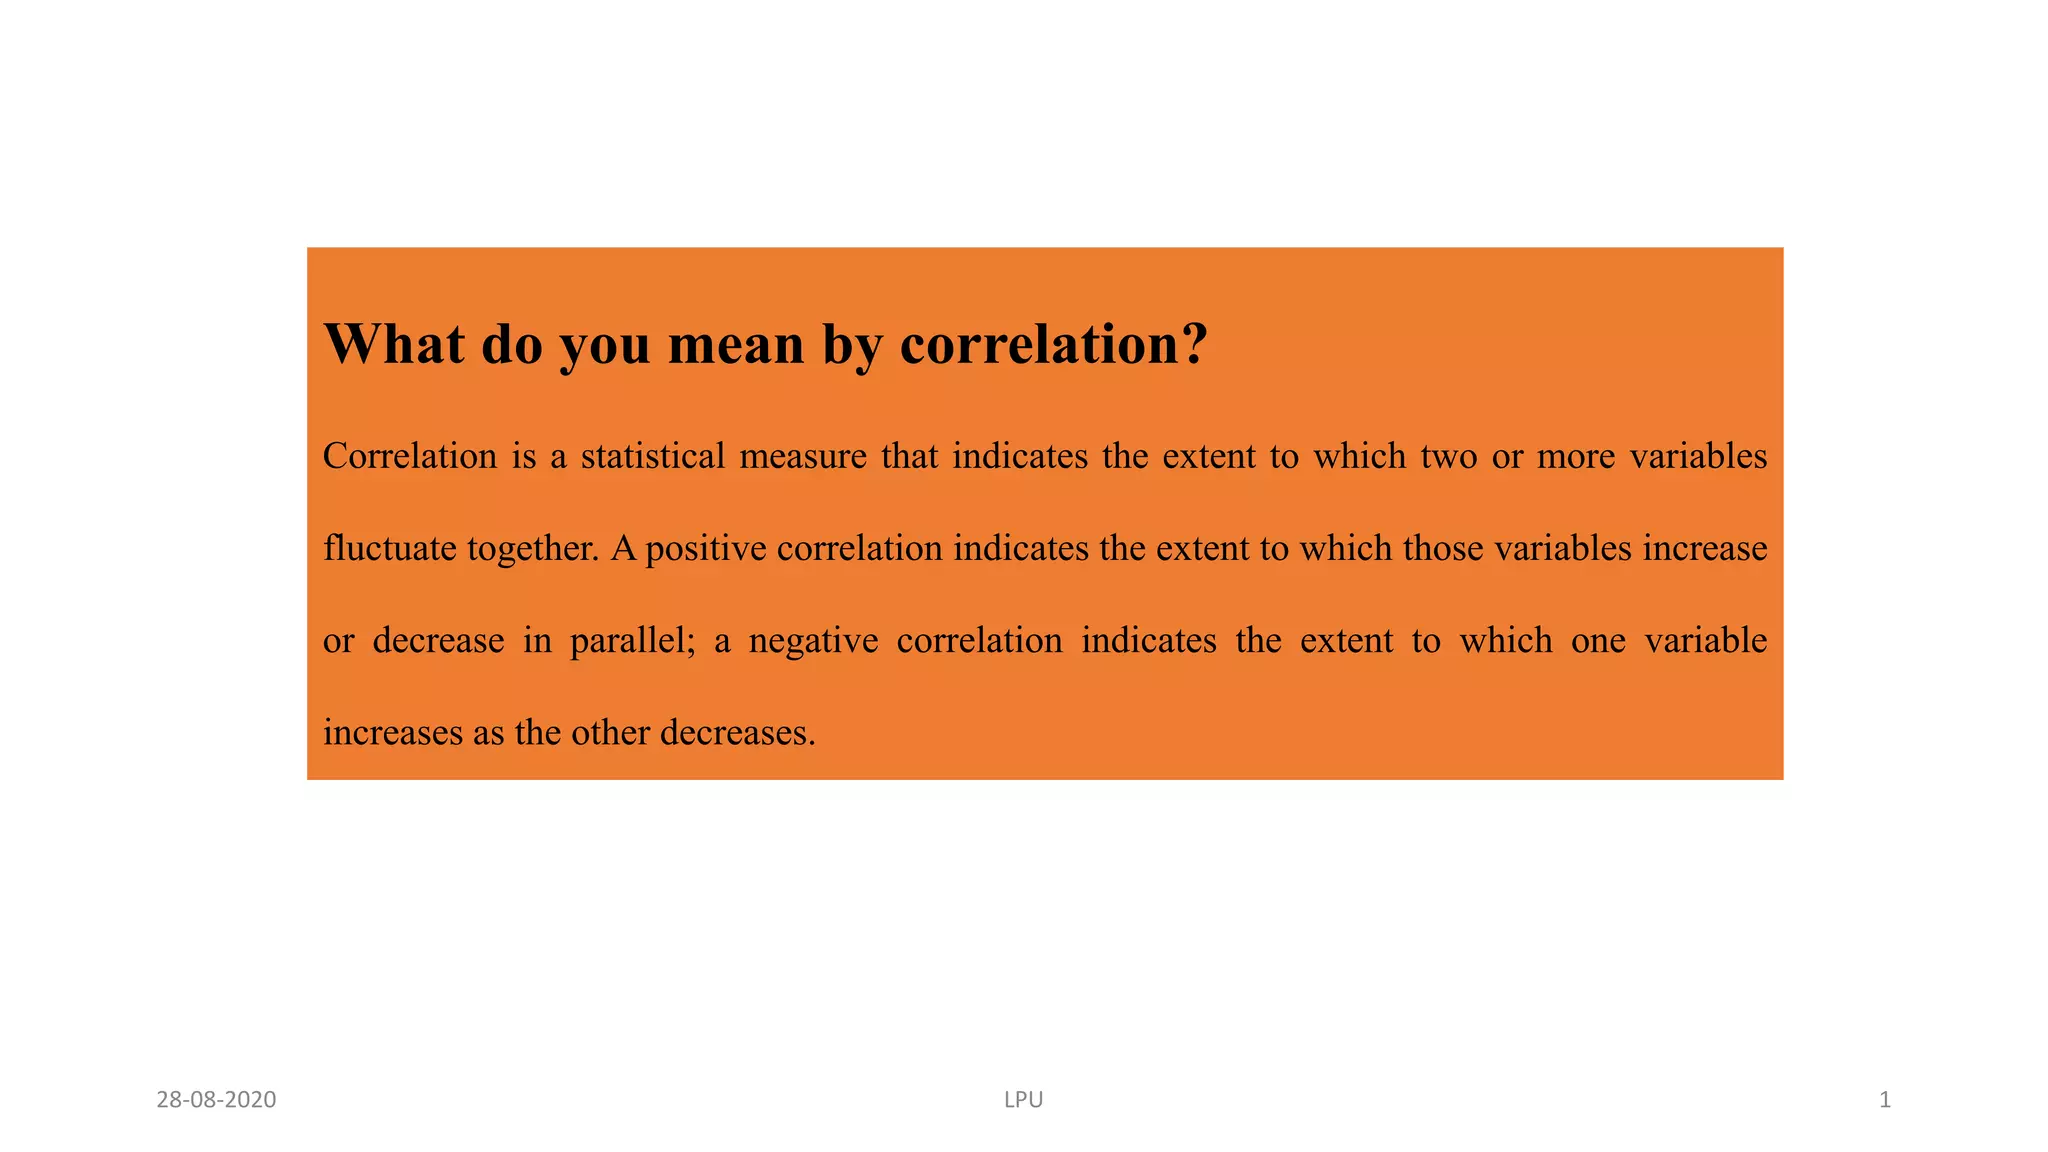
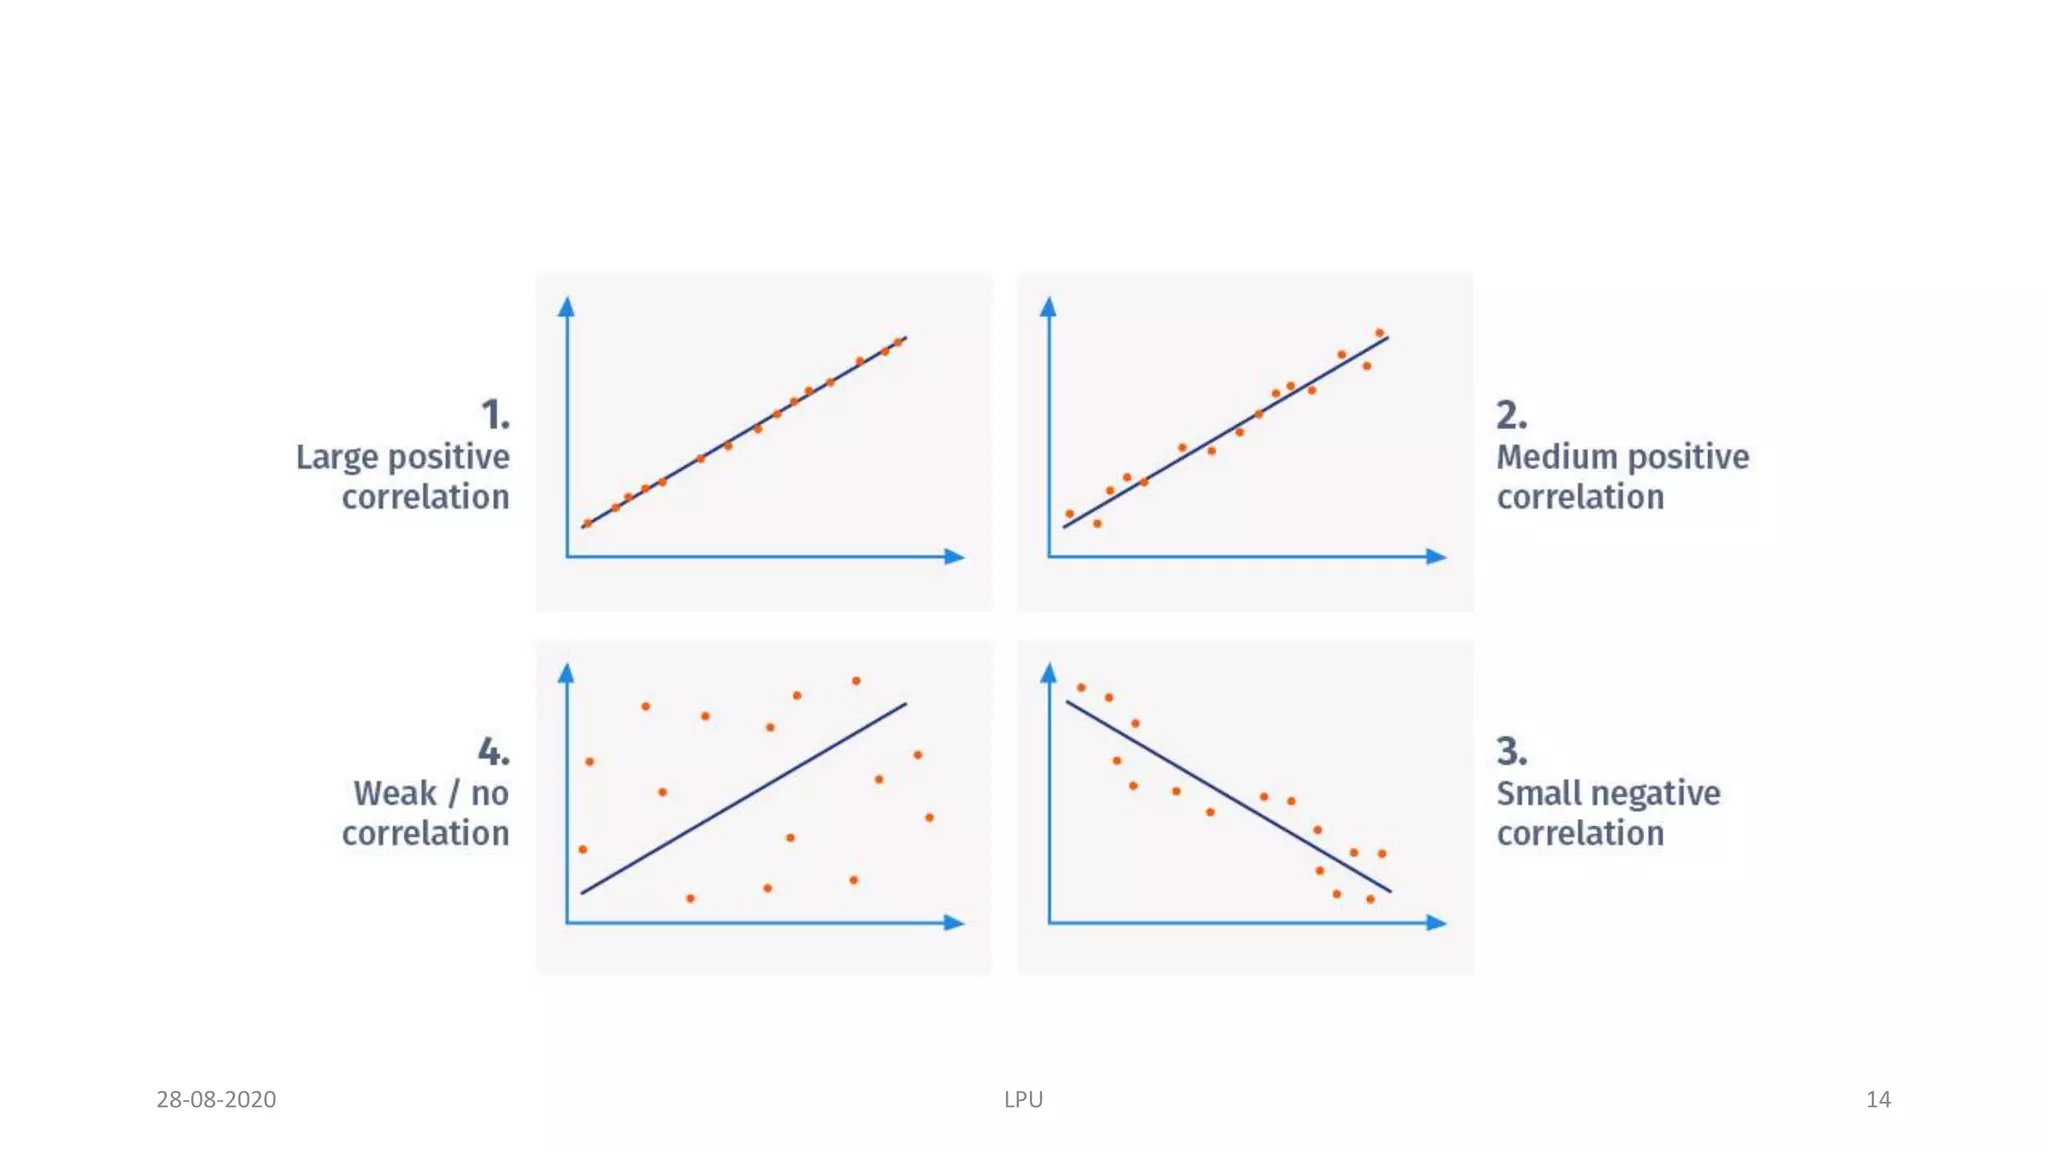
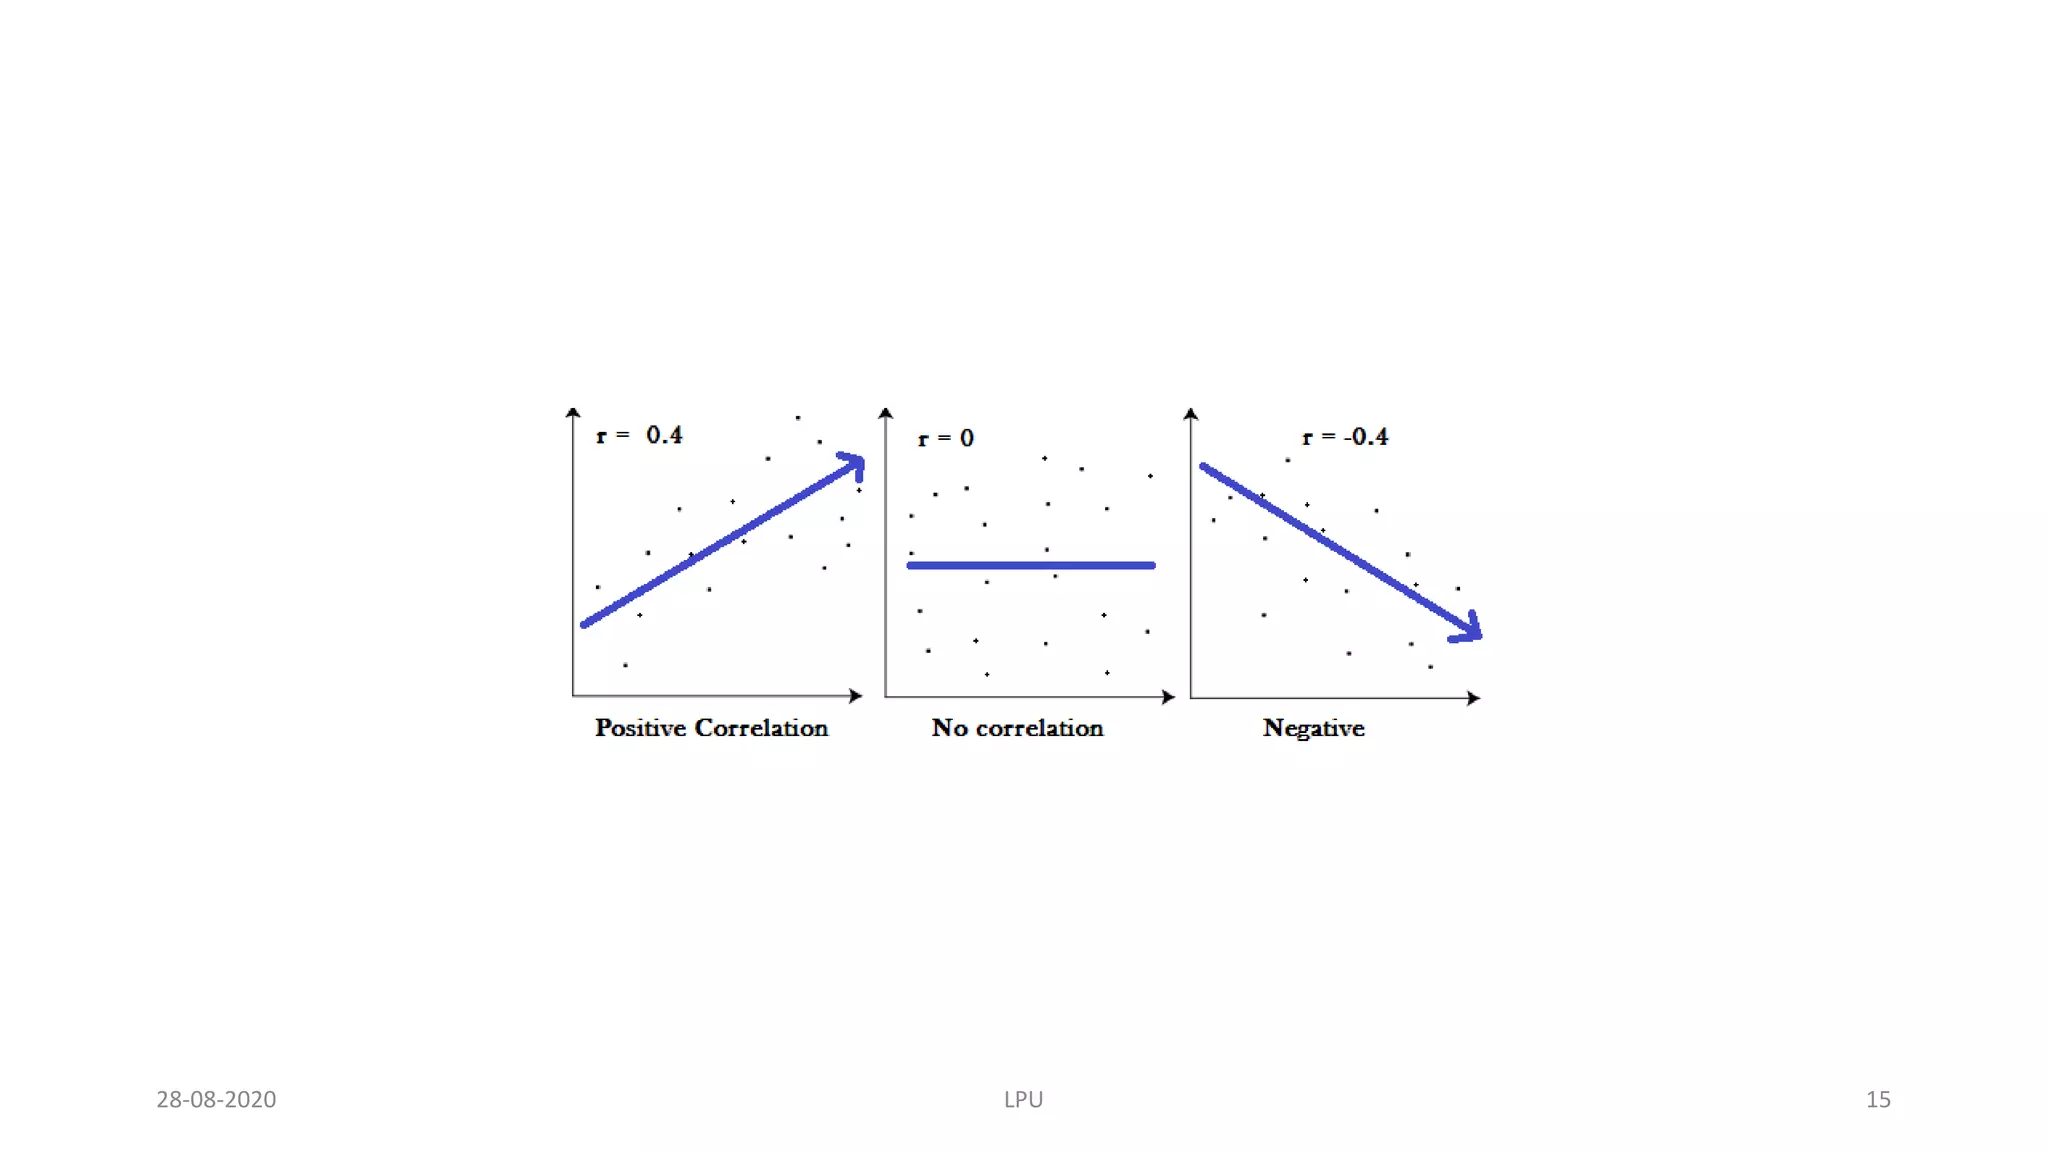
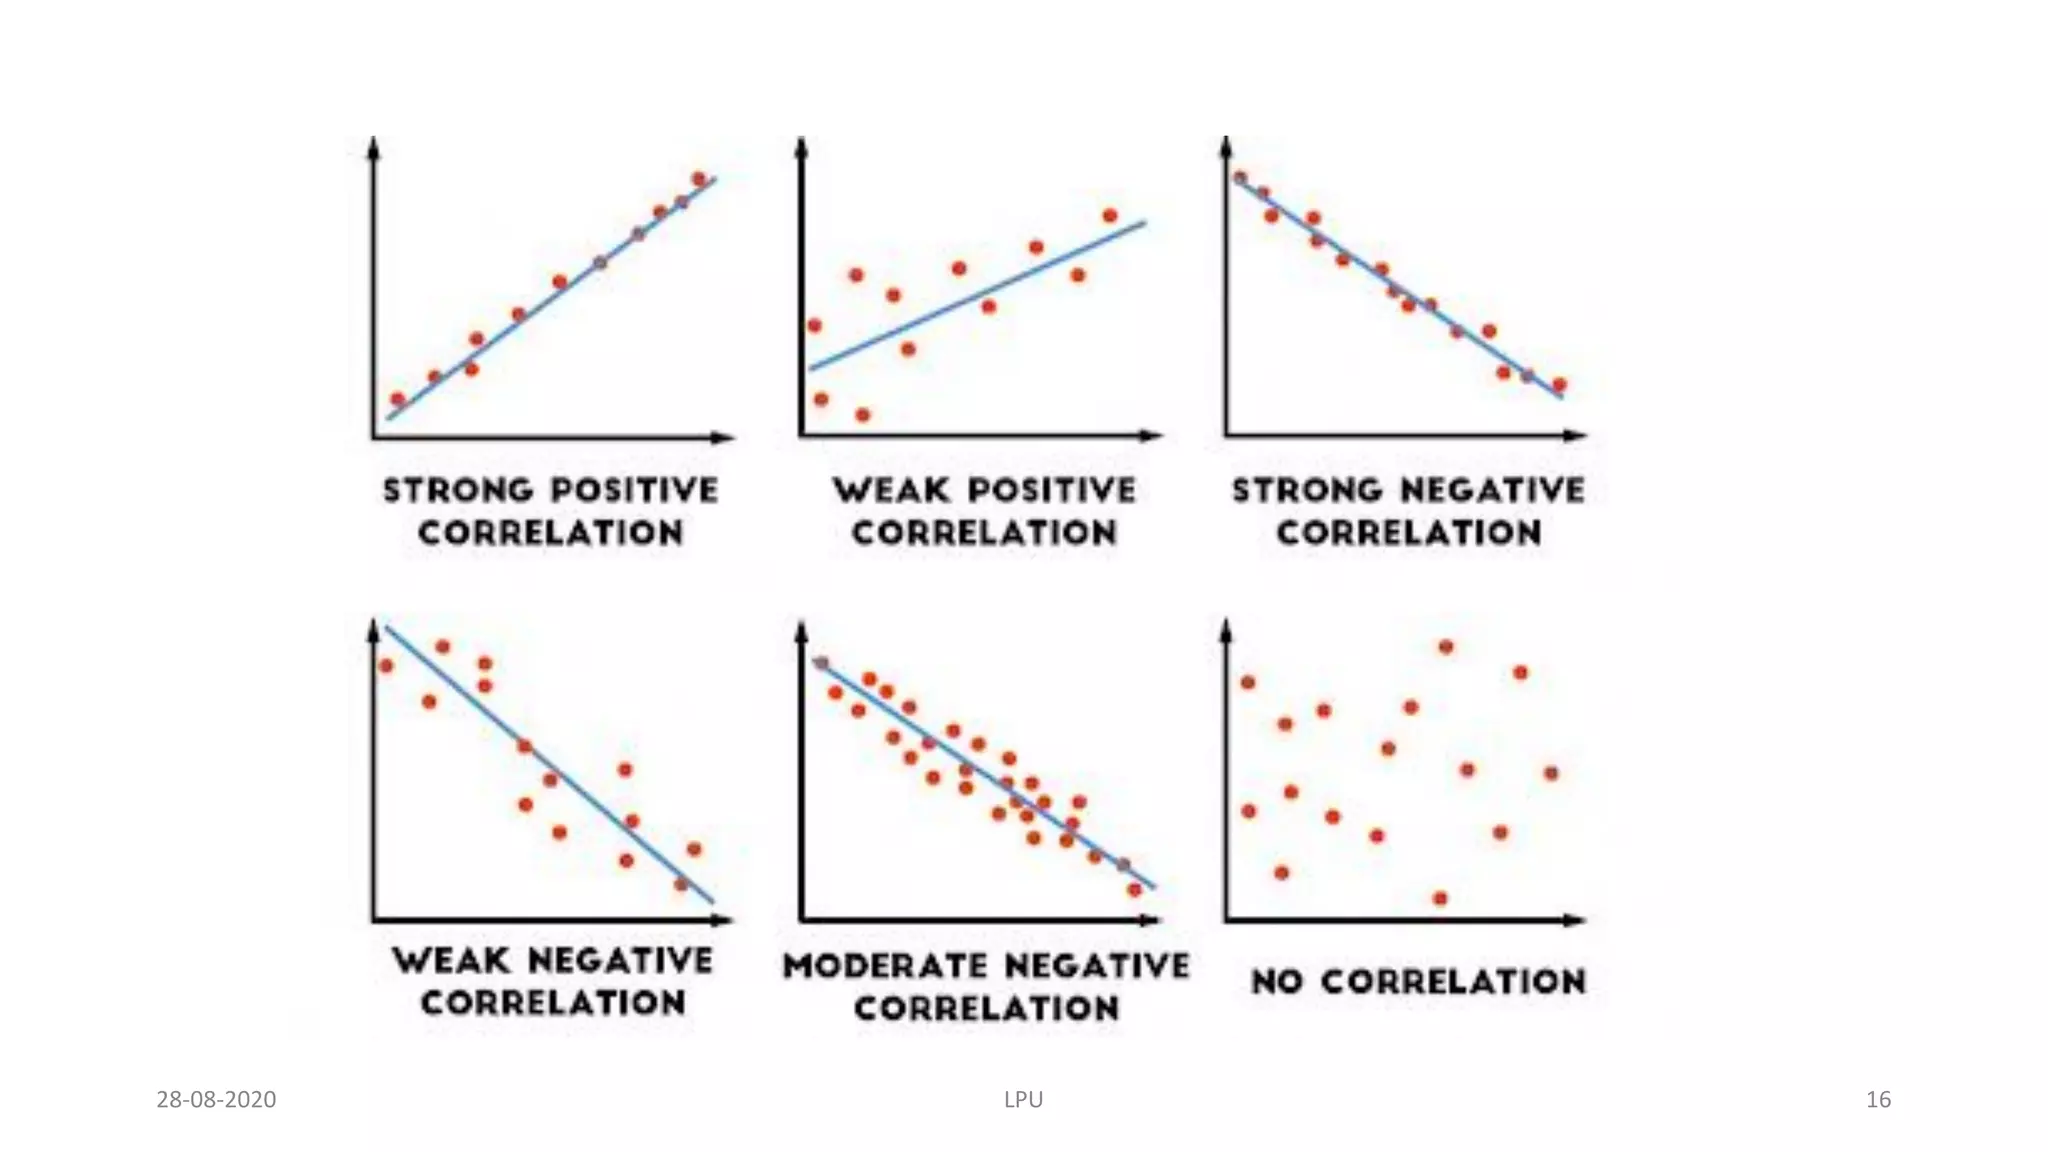
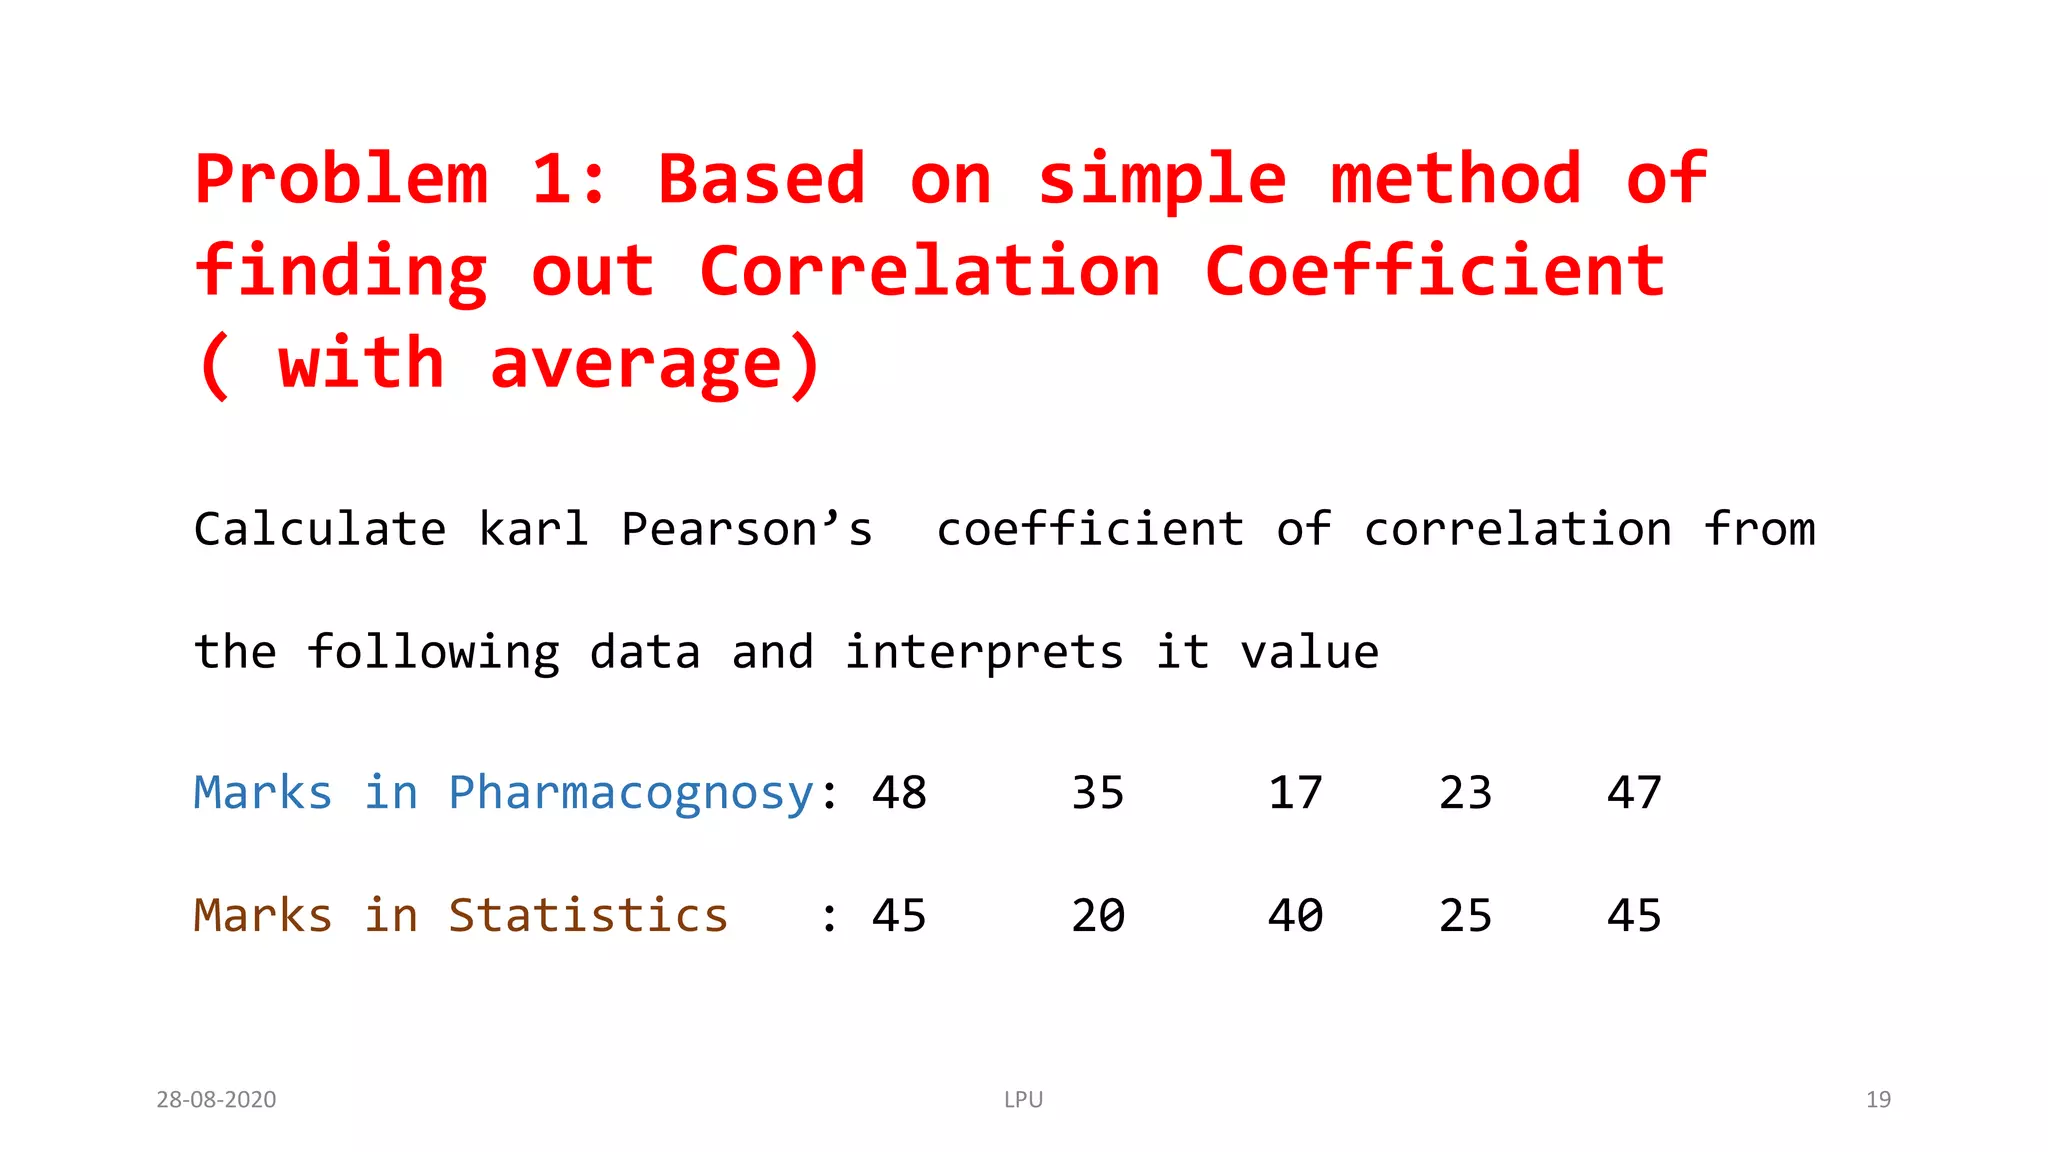
Correlation is a statistical measure that indicates the extent to which two or more variables fluctuate together. A positive correlation indicates that the variables increase or decrease in parallel, while a negative correlation indicates that one variable increases as the other decreases. A correlation of -0.97 represents a strong negative correlation, while 0.10 represents a weak positive correlation. Correlations above 0.4 are generally considered relatively strong. Even if there is no linear relationship between two variables, it does not necessarily mean that no relationship exists at all.

![Problem2. Based on regression analysis ( by actual mean method)
The following data relate to the scores obtained by 9 salesmen of a company
in an intelligence test and their weekly sales in thousands rupees:
a. Obtain the regression equation of sales on intelligence test scores of
salesmen.
b. If the intelligence score of a salesmen is 65, what would be his
expected weekly sales
Sal. Int A B C D E F G H I
Test [X]
Scores
50 60 50 60 80 50 80 40 70
Weekly
Sales [Y]
30 60 40 50 60 30 70 50 60
28-08-2020 LPU 23](https://image.slidesharecdn.com/unit1bp801tgcorrelationanalysis24022022-220224075106/75/Unit-1-bp801-t-g-correlation-analysis24022022-23-2048.jpg)
![Problem3. Based on regression analysis ( by assumed mean method)
The following table shows ages [X] and blood pressure [Y] of 8
persons:
Obtain the regression equation of Y on X and find the expected
blood pressure of a person who is 49 years old
Ages [X] 52 63 45 36 72 65 47 25
BP [Y] 62 53 51 25 79 43 60 33
28-08-2020 LPU 24](https://image.slidesharecdn.com/unit1bp801tgcorrelationanalysis24022022-220224075106/75/Unit-1-bp801-t-g-correlation-analysis24022022-24-2048.jpg)