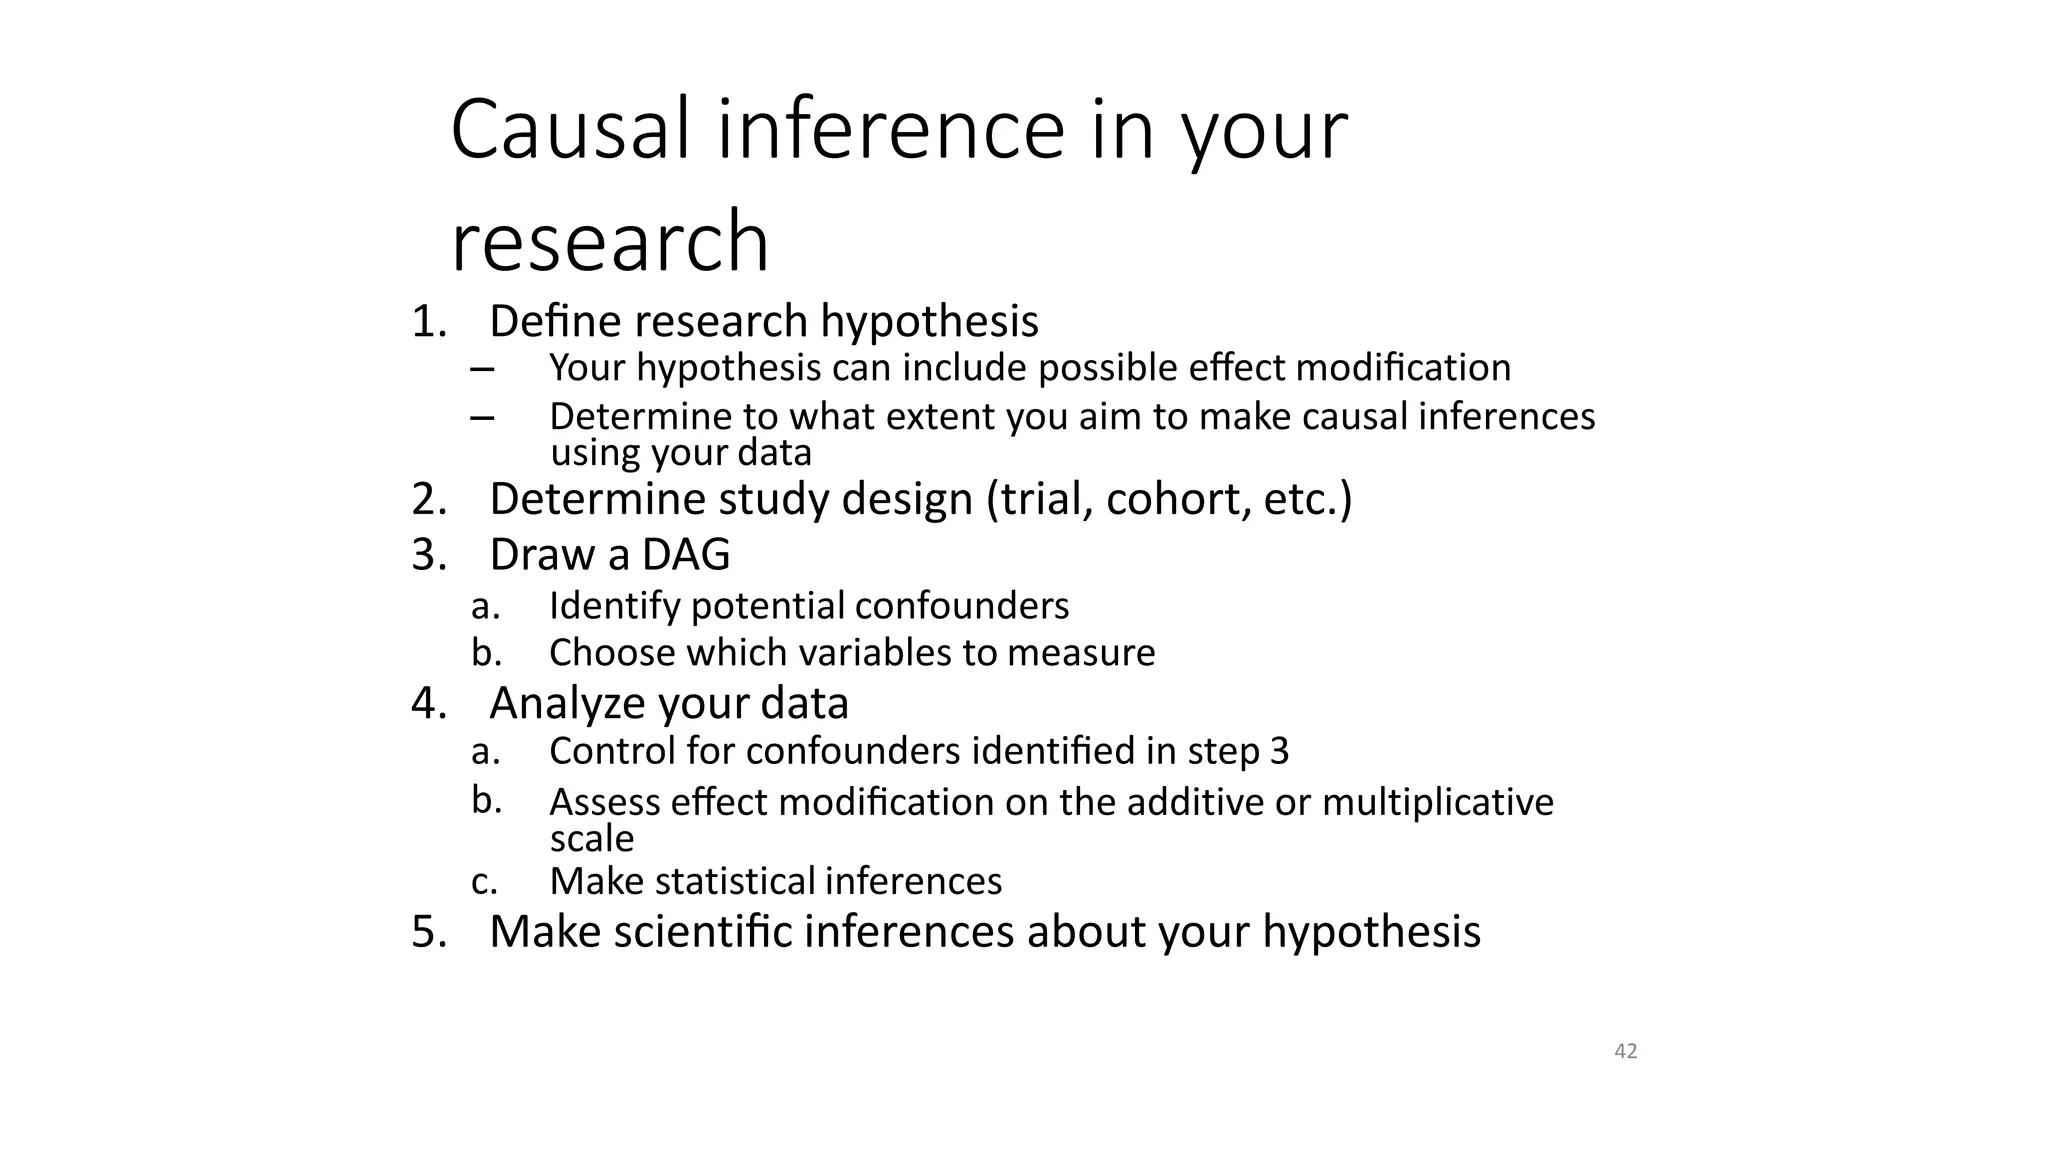
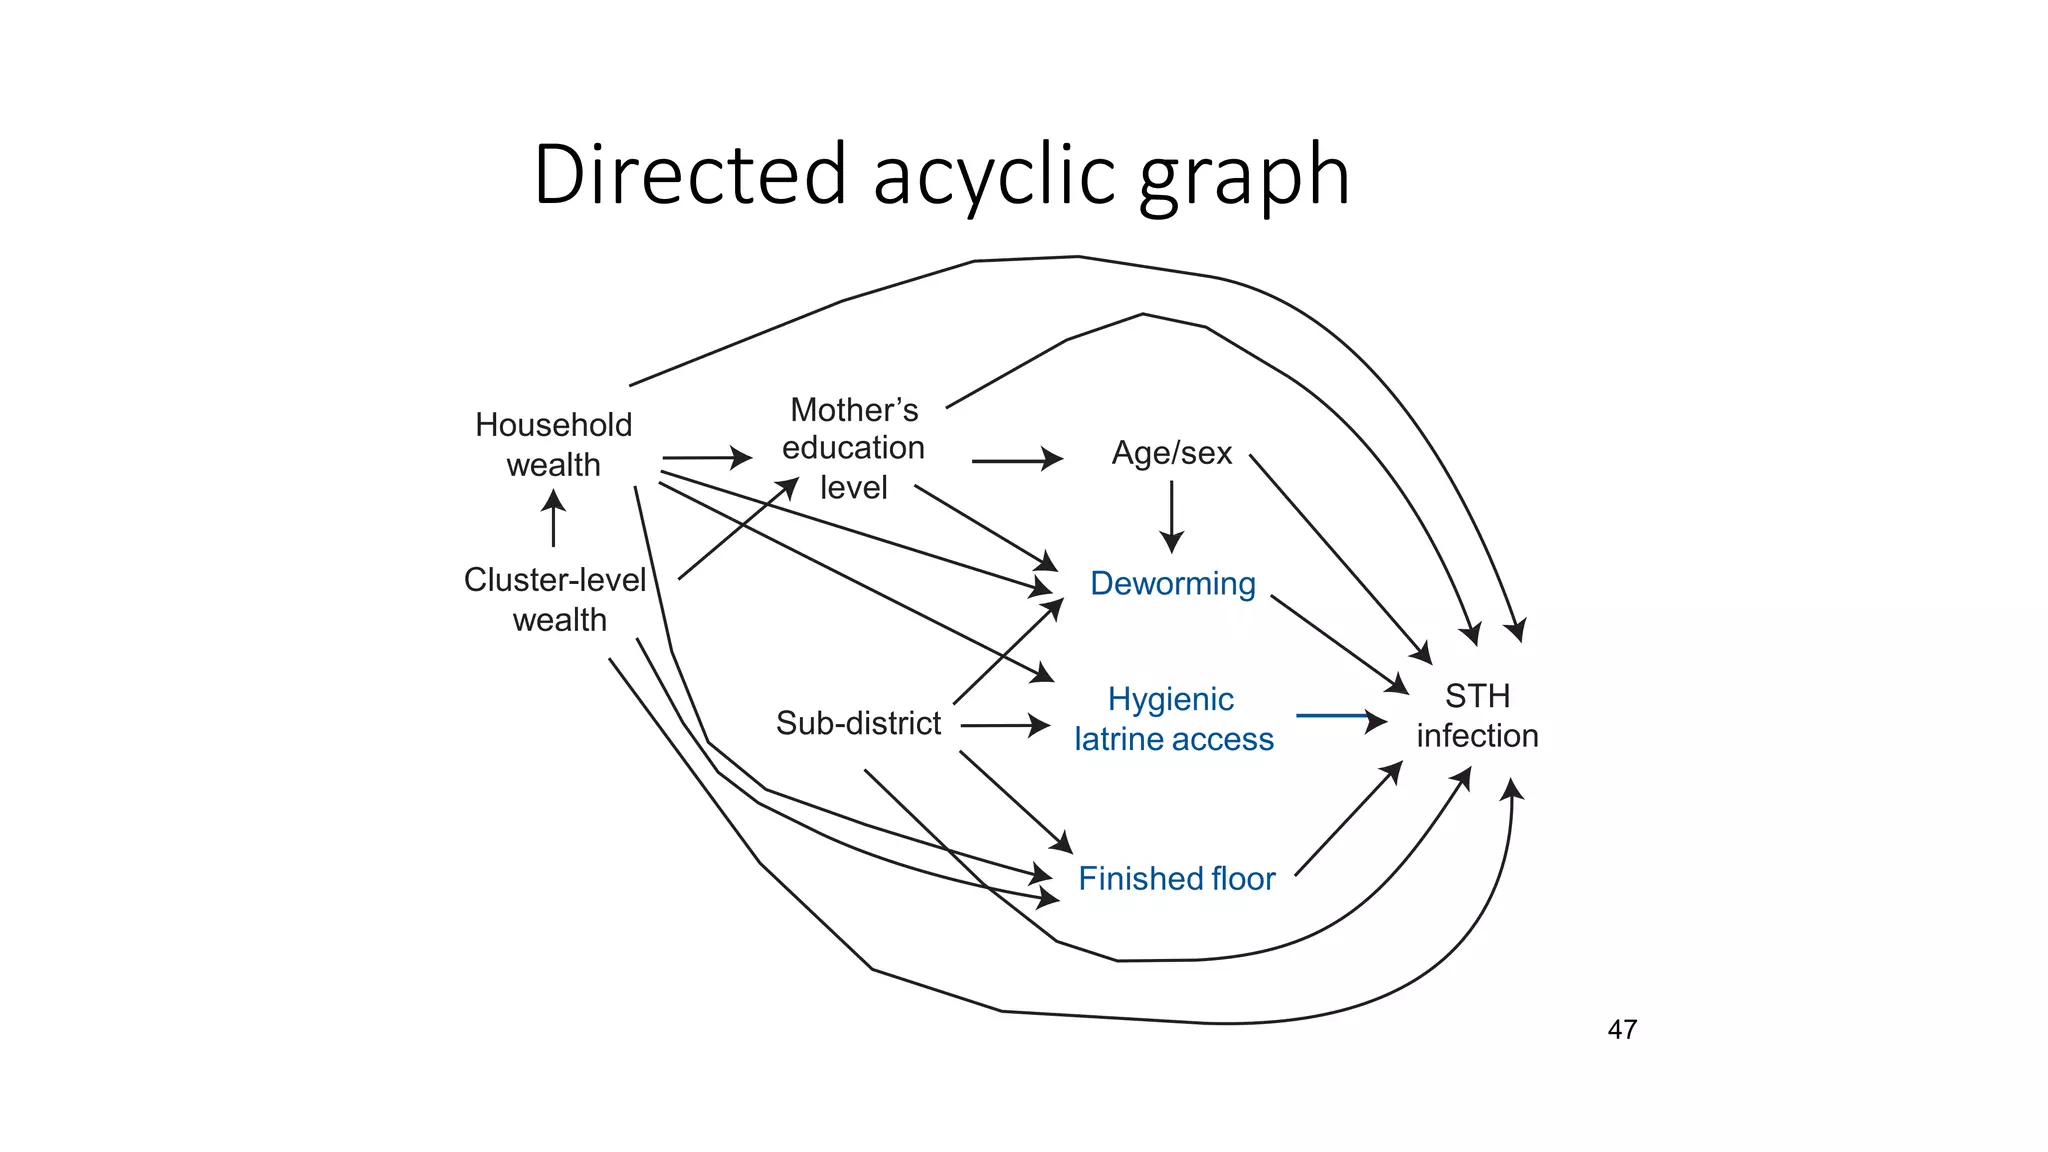
1. The document outlines steps for conducting causal inference research including defining a hypothesis, study design, drawing a directed acyclic graph (DAG) to identify confounders, analyzing data while controlling for confounders, and making scientific inferences.
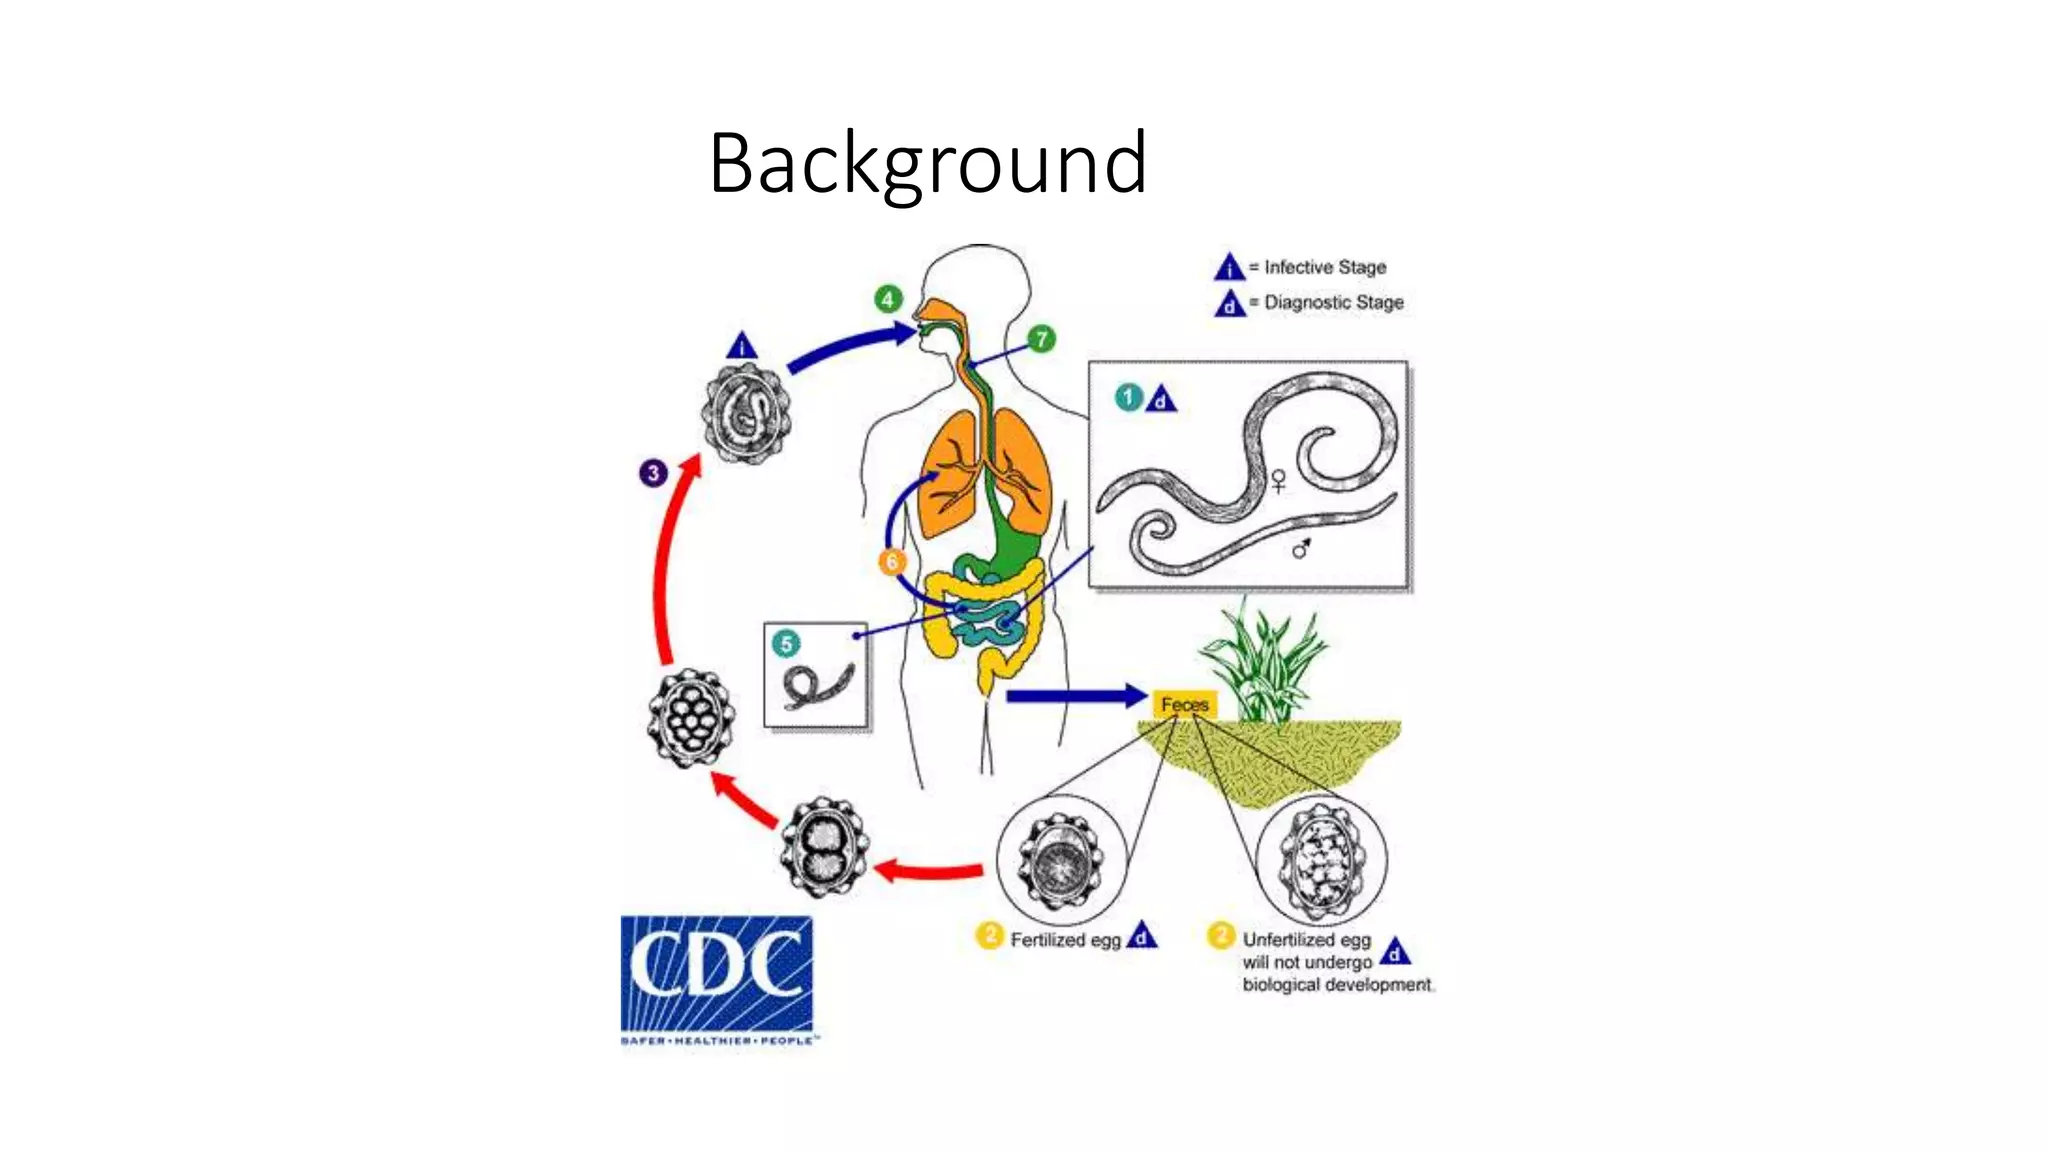
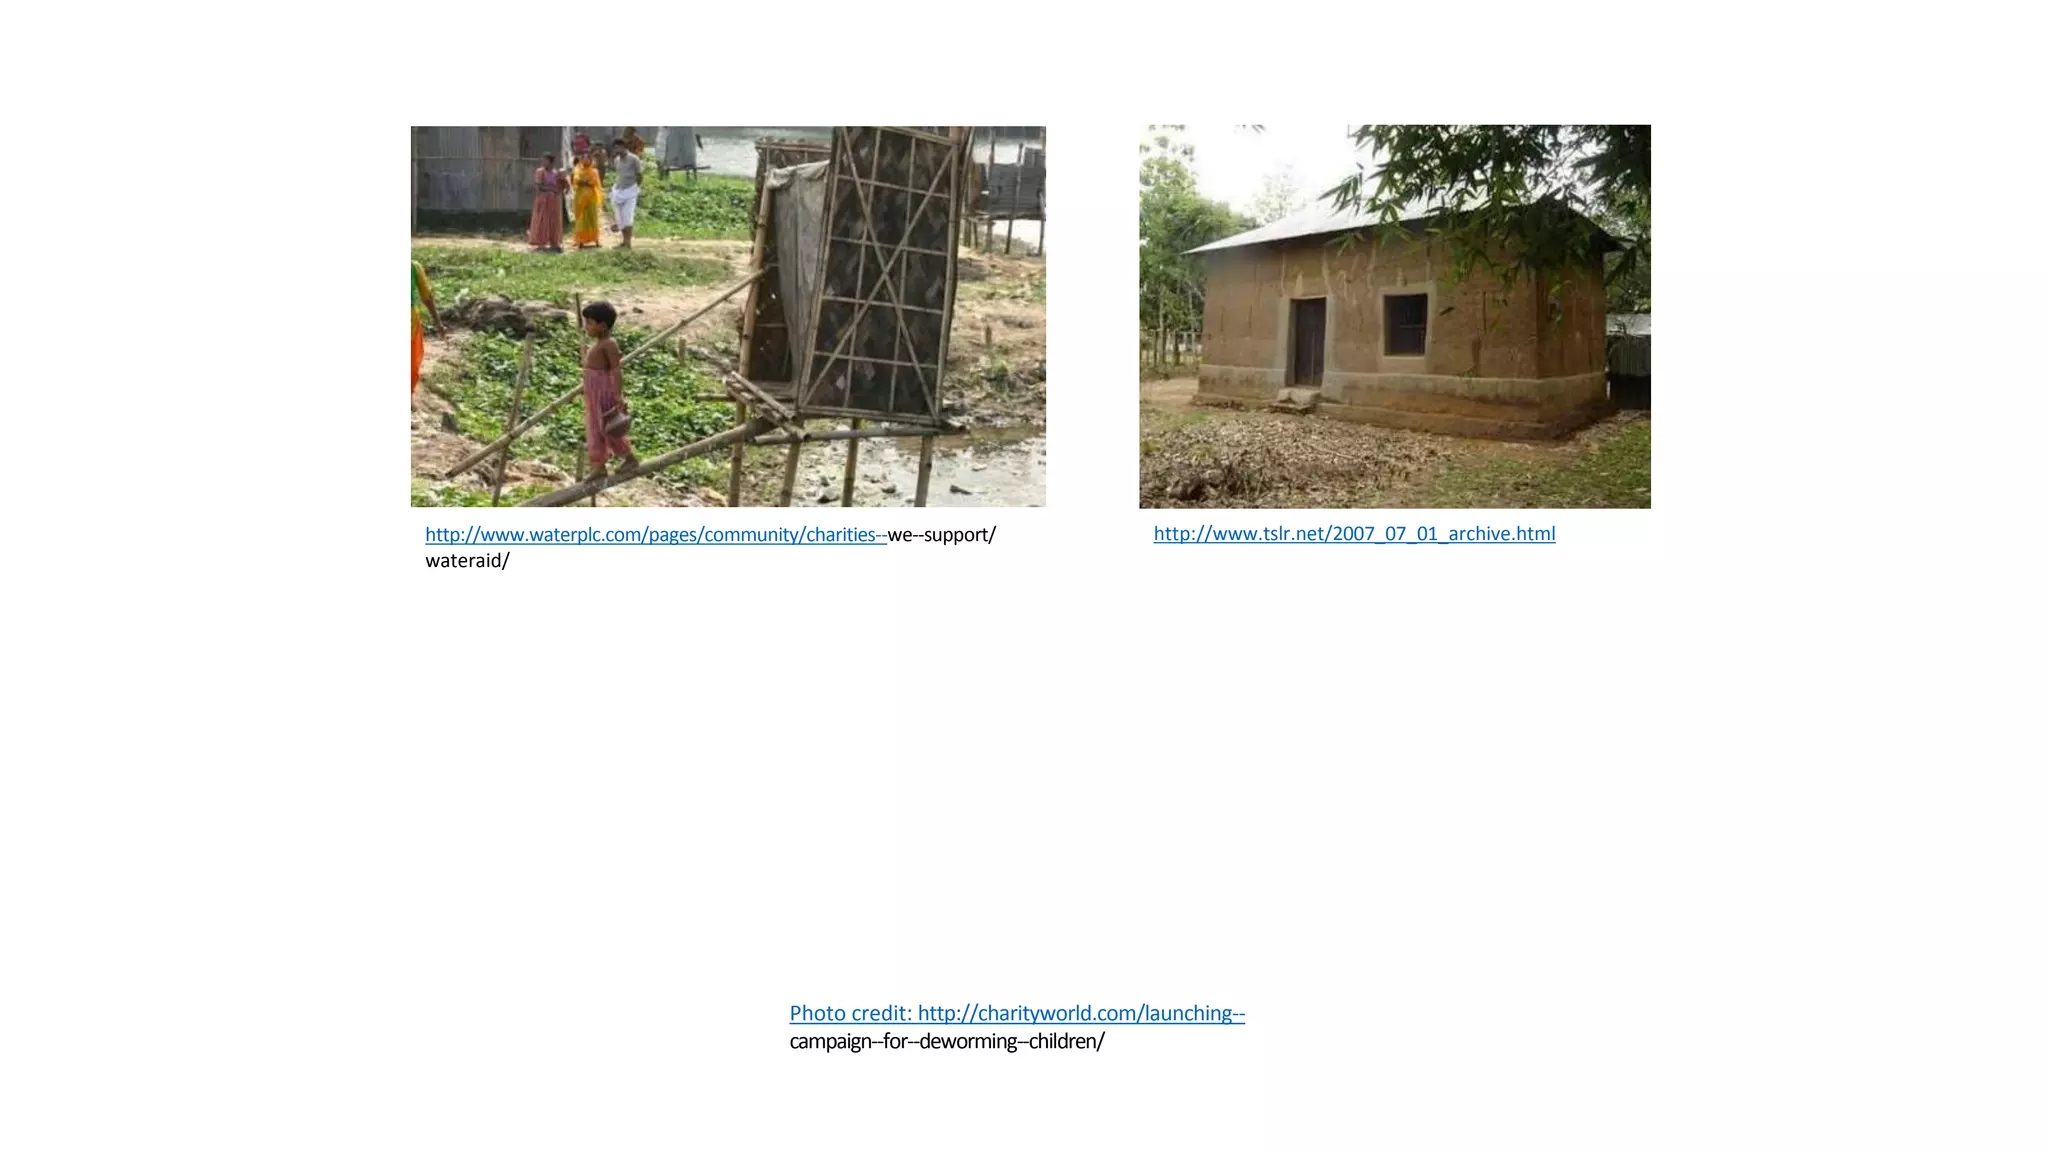
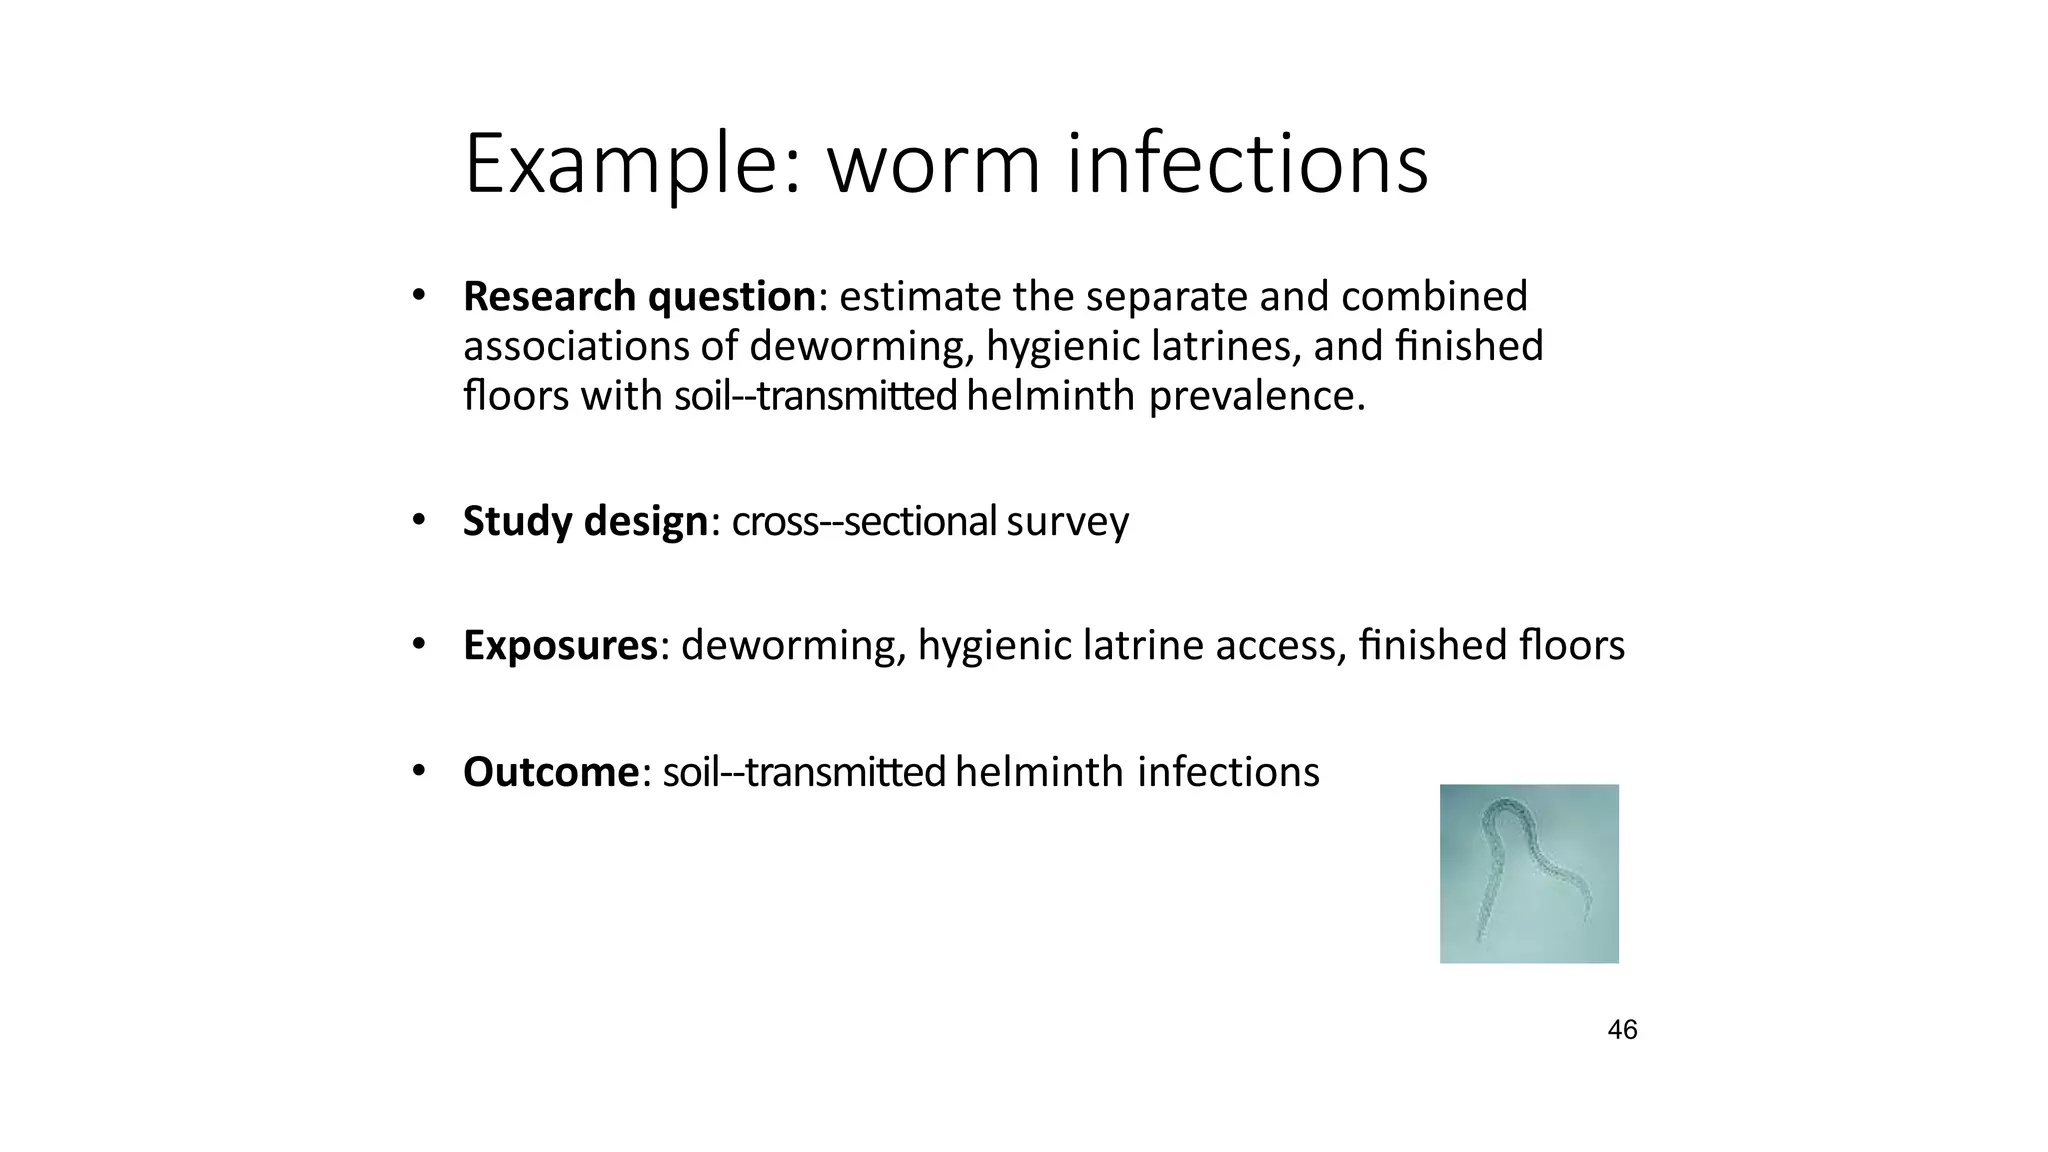
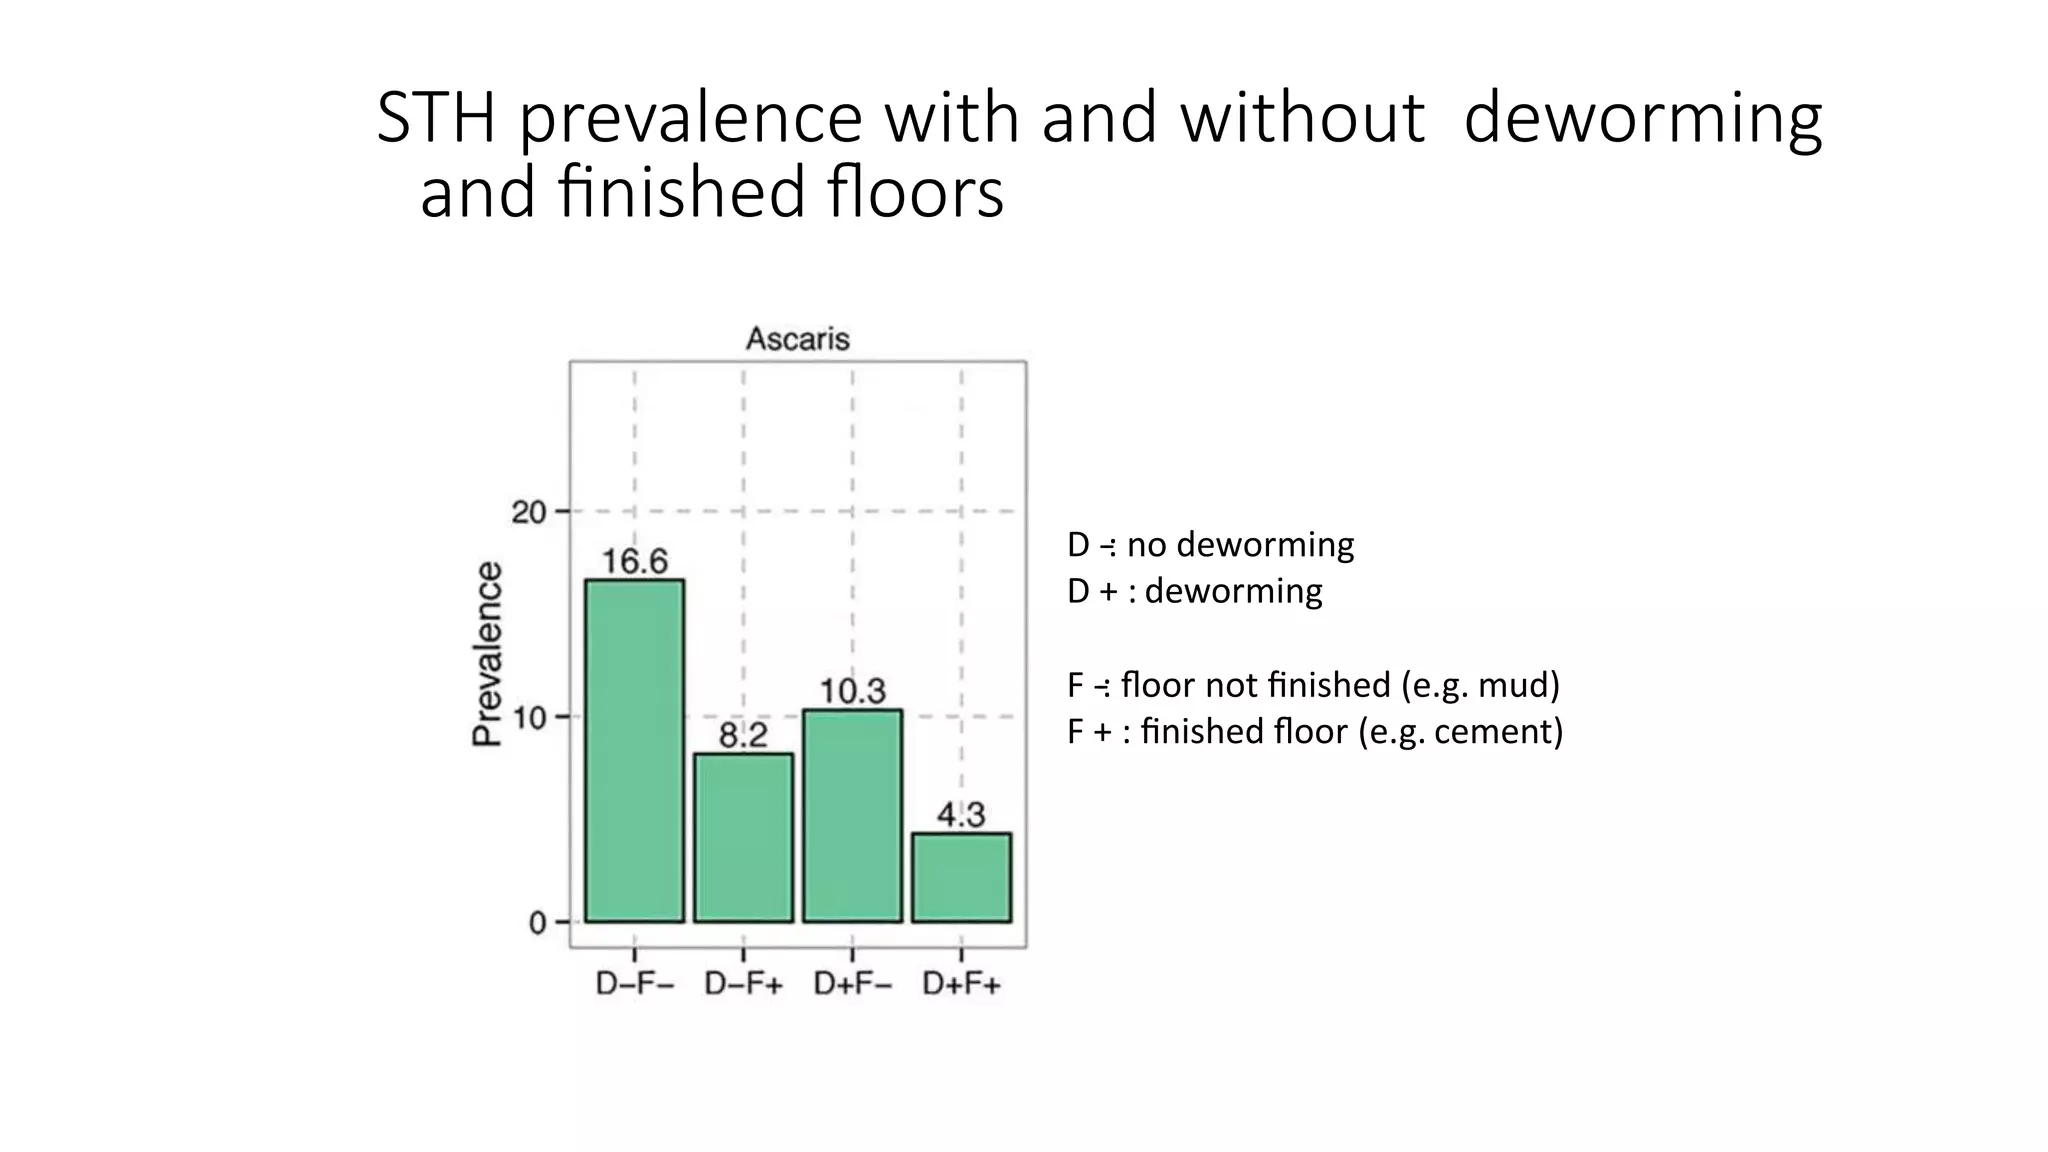
2. An example is provided on estimating associations between deworming, hygienic latrines, finished floors, and soil-transmitted helminth infections using a cross-sectional survey design.
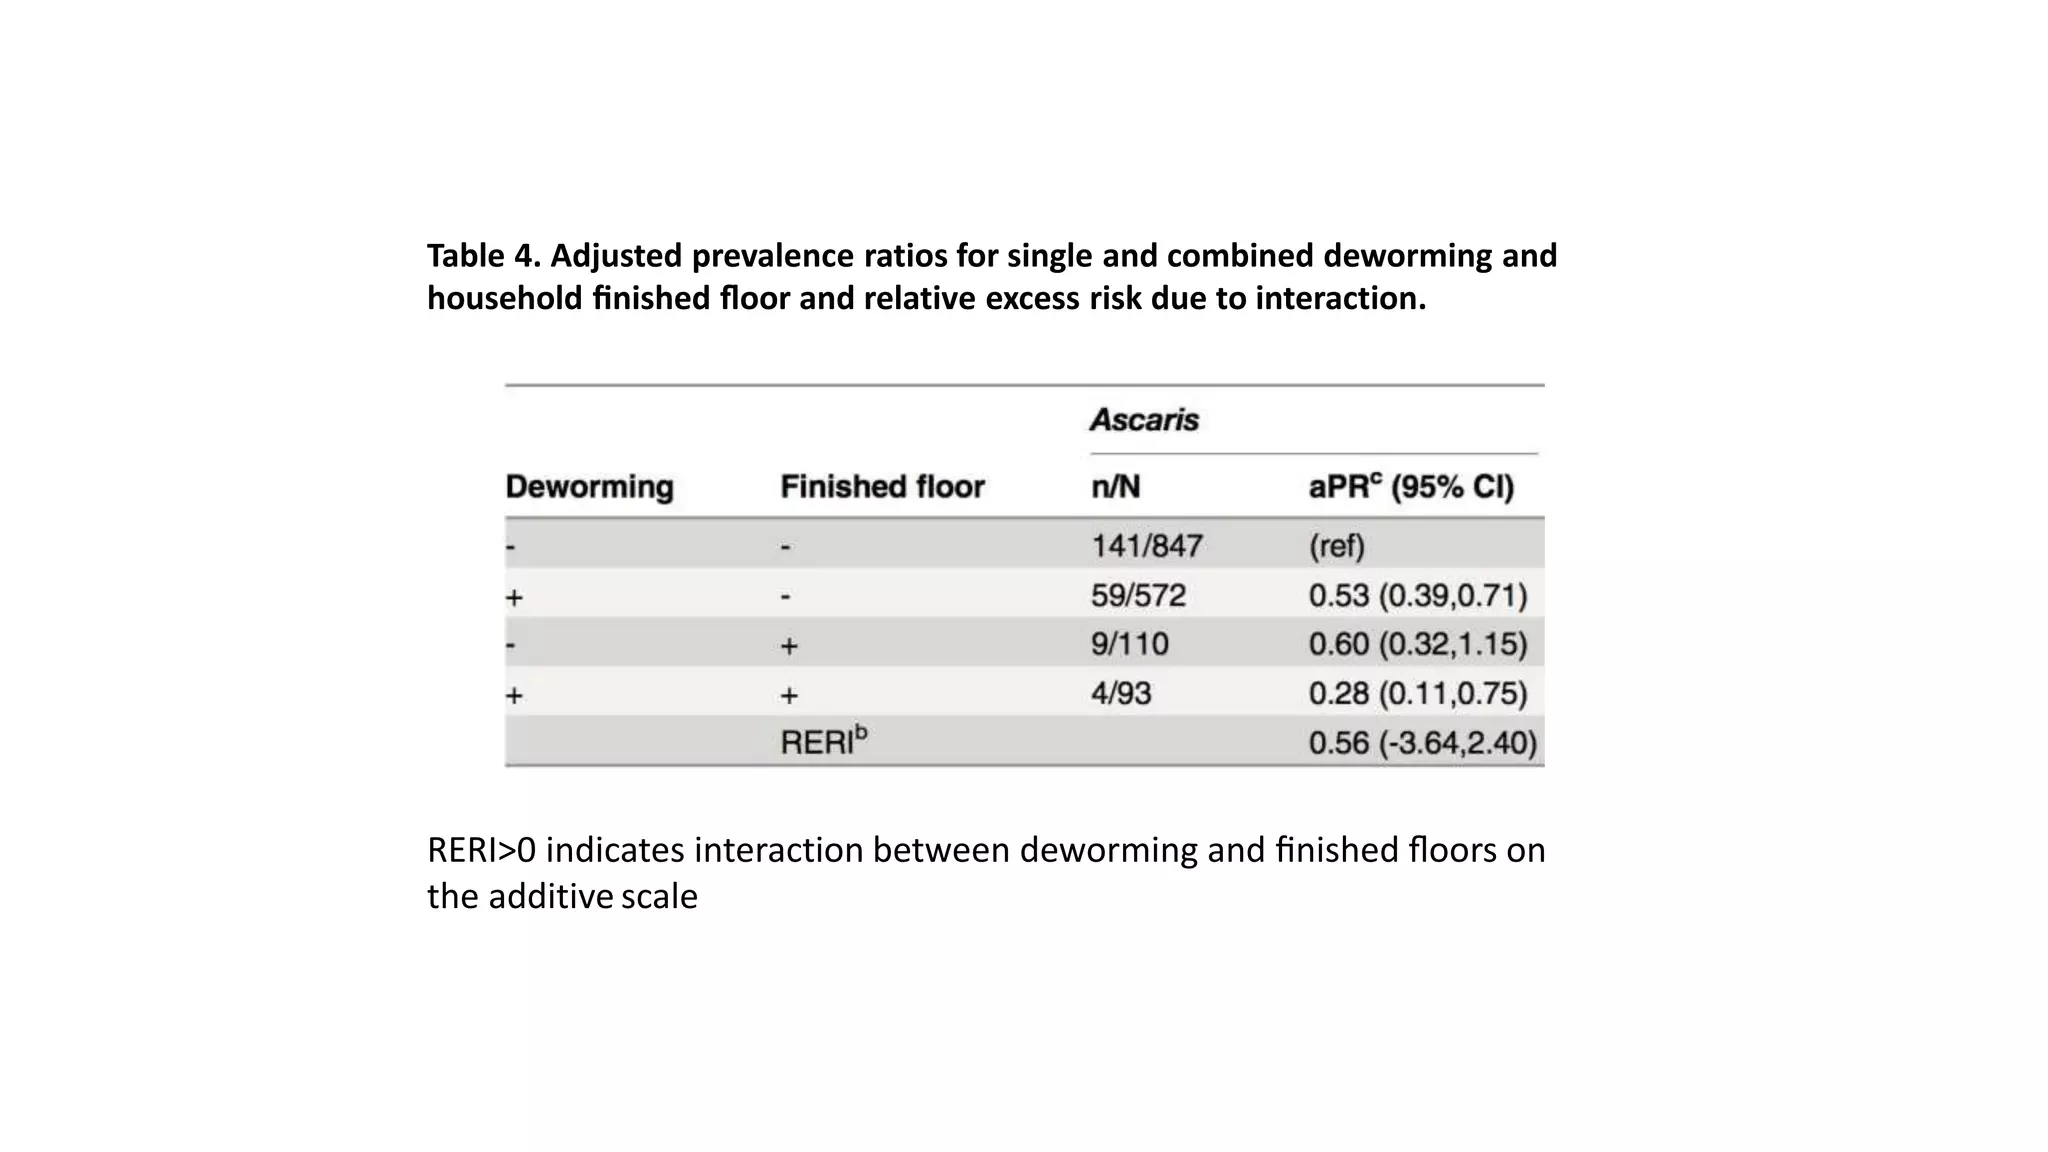
3. Results show the adjusted prevalence ratios for single and combined exposures on deworming and household characteristics on infection, including any additive interaction effects.
![51
Food for thought
• “A cause is something that makes a difference.” Susser (1991). AJE;
133:635-‐48.
• “Whether it is the social or biological sciences, there may
be no real ‘gold standard’ for [understanding causality].”
Galea (2010). IJE; 39:97-‐106.
• “Good description is the bread and butter of good science
and good policy research” Berk, 2004. Regression Analysis: A Constructive Critique.
Thousand Oaks: Sage.](https://image.slidesharecdn.com/5-161004173021/75/5-3-5-causal-inference-in-research-10-2048.jpg)