SlideShare a Scribd company logo
Cause and effect: the epidemiological
approach
Chapter 14
2015
On completion of your studies you should understand:
 The purpose of studying cause and effect in
epidemiology is to generate knowledge to prevent
and control disease.
 That cause and effect understanding is difficult to
achieve in epidemiology because of the long
natural history of diseases and because of ethical
restraints on human experimentation.
 How causal thinking in epidemiology fits in with
other domains of knowledge, both scientific and
non-scientific.
 The potential contributions of various study
designs for making contributions to causal
knowledge.
Cause and effect
 Cause and effect understanding is the
highest form of achievement of scientific
knowledge.
 Causal knowledge permits rational plans
and actions to break the links between
the factors causing disease, and disease
itself.
 Causal knowledge can help predict the
outcome of an intervention and help treat
disease.
 Quote Hippocrates "To know the causes
of a disease and to understand the use of
the various methods by which the disease
may be prevented amounts to the same
thing as being able to cure the disease".
Epidemiological contributions
to cause and effect A philosophy of health and disease.
 Models which illustrate that philosophy.
 Frameworks for interpreting and applying the
evidence.
 Study designs to produce evidence.
 Evidence for cause and effect in the
relationships of numerous factors and diseases.
 Development of the reasoning of other
disciplines including philosophy and
microbiology, in reaching judgement.
A cause?
 The first and difficult question is, what
is a cause?
 A cause is something which has an
effect.
 In epidemiology a cause can be
considered to be something that alters
the frequency of disease, health status
or associated factors in a population.
 Pragmatic definition.
 Philosophers have grappled with the
nature of causality for thousands of
years.
Epidemiological strategy and
reasoning: the example of Semelweis
 Diseases form patterns, which are ever changing.
 Clues to the causes of disease are inherent within these pattern.
 Semelweis (1818-1865) observed that the mortality from childbed fever
(now known as puerperal fever) was lower in women attending clinic 2 run
by midwives than it was in those attending clinic 1 run by doctors.
 Do these observations spark off any ideas of causation in your mind?
Births, deaths, and mortality rates (%) for all
patients at the two clinics 1841-1846
First clinic Second clinic
Births Deaths Rate Births Deaths Rate
20042 1989 9.92 17791 691 3.38
Semmelweis’ inspiration
 In 1847, his colleague and friend Professor
Kolletschka died following a fingerprick with a
knife used to conduct an autopsy.
 Kolletschka’s autopsy showed inflammation to be
widespread, with peritonitis, and meningitis.
 “Day and night I was haunted by the image of
Kolletschka’s disease and was forced to recognise,
ever more decisively that the disease from which
Kolletschka died was identical to that from which
so many maternity patients died.”
 Semelweis' inspired idea was that particles had
been transferred from the scalpel to the vascular
system of his friend and that the same particles
were killing maternity patients.
Semmelweis’ action
 If so, something stronger than ordinary soap was
needed for handwashing
 He introduced chlorina liquida, and then for reasons
of economy, chlorinated lime.
 The maternal mortality rate plummeted.
 Semelweis’s discovery was resented in Vienna.
.
 Deep knowledge derives from the explanation of
disease patterns, rather than in their description.
 Inspiration is needed, and may come from unexpected
sources, as here from Kolletschka’s autopsy.
 Action cannot always await understanding the
mechanism.
 Epidemiological data to show that laying an infant on
its front (prone position) to sleep raises the risk of
'cot death' or sudden infant death syndrome.
 A campaign to persuade parents to lay their infants on
their backs has halved the incidence of cot death.
 Epidemiologists are reliant on other sciences,
laboratory or social, to be equal partners, in pursuit
of the mechanisms.
Epidemiological principles and
models of cause and effect
 Most important of the cause and effect ideas
underpinned by epidemiology is that disease is virtually
always a result of the interplay of the environment, the
genetic and physical makeup of the individual, and the
agent of disease.
 Diseases attributed to single causes are invariably so by
definition.
 The fact that “tuberculosis” is “caused” by the tubercle
bacillus is a matter of definition.
 The causes of tuberculosis, from an epidemiological or
public-health perspective, are many, including
malnutrition and overcrowding.
 This idea is captured by several well known disease
causation models, such as the line, triangle, the wheel,
and the web.
Clues
Stable in incidence
Clusters in families
Clues
Incidence varies rapidly
over time or between
genetically similar
populations
Is the disease predominantly
genetic or environmental?
Genetic
Environmental
Down’s syndrome
Phenylketonuria
Sickle cell disease
Diabetes
Asthma
Coronary heart disease
Stroke
Lung cancer
Road traffic
accidents
Genetic Environmental
Host:
Inhalation of infective
organism, age, smoking,
male sex,
cardio-respiratory disease
Environment:
Presence of cooling towers
and complex hot water
systems; aerosols created
but not contained,
meteorological conditions
take aerosol to humans
Agent:
Virulent
Legionella
organisms, e.g.
pneumophila
serotype
Control smoking
and causes of
immunodeficiency
Avoid wet type cooling
towers, look for a better
design and location,
separate towers from
population and enhance
tower hygiene
Minimise growth of
organisms and factors
which enhance
pathogenicity, e.g. algae
Physical
environment
Social
environment
Chemical &
biological
environment
Gene /
host
The model
emphasises the unity
of the gene and host
within an interactive
environmental
envelope
The overlap between
environmental
components
emphasises the
arbitrary distinctions
Physical
environment:
availability of
health care
facilities for
diagnosis
Social
environment:
social support
to sustain
dietary change
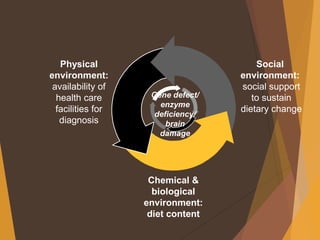
Chemical &
biological
environment:
diet content
Gene defect/
enzyme
deficiency/
brain
damage
Models of cause and effect
 Agent factors, arguably, receive less attention
than they deserve.
 Characterising the virulence of organisms is difficult.
 In other diseases conceptualising the cause as an agent
is not easy.
 The concept of the disease agent has been applied to
infections but it works well with many non-infectious
agents, for example, cigarettes, motor cars, and
alcohol.
 The interaction of the host, agent and environment is
rarely understood.
 The effect of cigarette smoking is substantially greater
in poor people than in rich people.
Models: the wheel
 The wheel of causation.
 Emphasises the unity of the interacting factors.
 Emphasises the fact that the division of the
environment into components is somewhat
arbitrary.
 Model is applied to phenylketonuria, the
archetypal genetic disorder.
 Phenylketonuria is an autosomal single gene
disease .
 An enzyme required to metabolise the dietary
amino-acid phenylalanine and turn it into tyrosine,
is deficient.
The wheel: phenylketonuria
 Brain damage is the outcome.
 The cause of this disease could be said
to be a gene.
 The cause of the disease could be
considered as a combination of a gene.
 Exposure to a chemical and biological
environment which provides a diet
containing a high amount of
phenylalanine.
 A social environment unable to
protect the child from the
consequences, of a gene disorder.
Models: the spider’s web
 For many disorders our understanding of
the causes is highly complex.
 Either the causes are truly complex, or equally likely,
our understanding is too rudimentary to permit
clarity.
 These disorders are referred to as multifactorial or
polyfactorial disorders.
 Mechanisms of causation are not apparent.
 Portrayed by the metaphor of the spider’s web.
 This modelindicates the potential for the disease to
influence the causes and not just the other way
around, so-called, reverse causality.
 It also poses a fundamental question: Where is the
spider that spun the web?
Rothman’s component causes model
 Rothman's interacting component causes model has
emphasised that the causes of disease comprise a
constellation of factors.
 It has broadened the sufficient cause concept to be a
minimal set of conditions which together inevitably
produce the disease.
 The concept is shown in figure 11
 Three combinations of factors (ABC, BED, ACE) are
shown here as sufficient causes of the disease.
 Each of the constituents of the causal "pie" are
necessary.
 Control of the disease could be achieved by removing
one of the components in each "pie" and if there
were a factor common to all "pies" the disease would
be eliminated by removing that alone.
Figure 11
A B
C
A E
D
A E
C
Each of the three components of the
interacting constellations of causes
(ABC, ADE, ACE) are in themselves
sufficient and each is necessary
Application of guidelines/criteria
to associations
 An association rarely reflects a causal relationship but
it may.
 These six criteria are a distillation of, or at least,
echo the ten Alfred Evans' postulates in Last's
Dictionary of Epidemiology (4th edition) and the nine
Bradford Hill criteria.
Strength and dose response
 Does exposure to the cause change
disease incidence?
 If not there is no epidemiological basis for a
conclusion on cause and effect.
 Failure to demonstrate this does not, however,
disprove a causal role.
 The usual measure of the increase in incidence is the
relative risk and the technical name for this criterion
is the strength of the association.
 Dose-response
 Does the disease incidence vary with the level of
exposure? If yes, the case for causality is advanced.
 The dose-response relation is also measured using the
relative risk.
Specificity
 Is the effect of the supposed cause specific to
relevant diseases, and, are diseases caused by a
limited number of supposed causes?
 Imagine a factor which was linked to all health
effects
 Why would that be so?
 Non-specificity is characteristic of spurious
associations eg underestimating the size of the
denominator.
 While specificity is not a critically important
criterion epidemiologists should take advantage of
the reasoning power it offers.
Consistency
 Is the evidence within and between studies consistent?
 Consistency is linked to generalisability of findings.
 Spurious associations are often local.
Experiment
 Does changing exposure to the supposed cause
change disease incidence?
 Often there have been natural experiments.
 Deliberate experimentation will be necessary.
 Human experiments or trials are sometimes
impossible on ethical grounds.
 Causal understanding can be greatly advanced
by laboratory and experimental observations.
Biological plausibility
 Is there a biological mechanism by which
the supposed cause can induce the
effect?
 For truly novel advances, however, the
biological plausibility may not be
apparent.
 Biologically plausible that laying an infant
on its back to sleep may lead to its
inhaling vomitus.
 Overturned by the biologically implausible
observation that laying a child on its back
halves the risk of cot death.
 Nonetheless, biological plausibility
remains relevant to establishing causality.
The pyramid of associations
1 Causal and mechanisms
understood
2 Causal
3 Non-causal
4 Confounded
5 Spurious / artefact
6 Chance
Interpretation of data, study design
and causal criteria
 Causal knowledge is born in the imagination and
understanding of the disease process of the
investigator.
 Same data can be interpreted in quite different
ways.
 The paradigm within which epidemiologists work
will determine the nature of the causal links they
see and emphasise.
 Researchers to make explicit in their writings their
guiding research philosophy.
 No epidemiological design confirms causality and
no design is incapable of adding important
evidence.
Summary
 Cause and effect understanding is the highest
form of scientific knowledge.
 Epidemiological and other forms of causal
thinking shows similarity.
 An association between disease and the
postulated causal factors lies at the core of
epidemiology.
 Demonstrating causality is difficult because of
the complexity and long natural history of
many human diseases and because of ethical
restraints on human experimentation.
Summary
 All judgements of cause and effect are tentative.
 Be alert for error, the play of chance and bias.
 Causal models broaden causal perspectives.
 Apply criteria for causality as an aid to thinking.
 Look for corroboration of causality from other
scientific frameworks.
BIAS AND CONFOUNDING
Chapter 15
2015
BIAS
Systematic, non-random deviation of results and inferences from the truth,
or processes leading to such deviation. Any trend in the collection, analysis,
interpretation, publication or review of data that can lead to conclusions
which are systematically different from the truth. (Dictionary of
Epidemiology, 3rd ed.)
MORE ON BIAS
Note that in bias, the focus is on an artifact of some
part of the research process (assembling subjects,
collecting data, analyzing data) that produces a
spurious result. Bias can produce either a type 1 or a
type 2 error, but we usually focus on type 1 errors
due to bias.
MORE ON BIAS
Bias can be either conscious or unconscious. In epidemiology,
the word bias does not imply, as in common usage, prejudice or
deliberate deviation from the truth.
CONFOUNDING
A problem resulting from the fact that one
feature of study subjects has not been
separated from a second feature, and has thus
been confounded with it, producing a spurious
result. The spuriousness arises from the
effect of the first feature being mistakenly
attributed to the second feature. Confounding
can produce either a type 1 or a type 2 error,
but we usually focus on type 1 errors.
THE DIFFERENCE BETWEEN BIAS
AND CONFOUNDING
Bias creates an association that is not true, but confounding
describes an association that is true, but potentially misleading.
EXAMPLES OF RANDOM ERROR, BIAS,
MISCLASSIFICATION AND
CONFOUNDING IN THE SAME STUDY:
STUDY: In a cohort study, babies of women who bottle feed and women
who breast feed are compared, and it is found that the incidence of
gastroenteritis, as recorded in medical records, is lower in the babies
who are breast-fed.
EXAMPLE OF RANDOM
ERROR
By chance, there are more episodes of gastroenteritis in the bottle-fed
group in the study sample, producing a type 1 error. (When in truth
breast feeding is not protective against gastroenteritis).
Or, also by chance, no difference in risk was found, producing a type 2
error (When in truth breast feeding is protective against gastroenteritis).
EXAMPLE OF BIAS
The medical records of bottle-fed babies only are less complete (perhaps
bottle fed babies go to the doctor less) than those of breast fed babies,
and thus record fewer episodes of gastro-enteritis in them only.
This is called ias because the observation itself is in error.
EXAMPLE OF CONFOUNDING
The mothers of breast-fed babies are of higher social class, and the babies
thus have better hygiene, less crowding and perhaps other factors that
protect against gastroenteritis. Crowding and hygiene are truly protective
against gastroenteritis, but we mistakenly attribute their effects to breast
feeding. This is called confounding. because the observation is correct,
but its explanation is wrong.
PROTECTION AGAINST RANDOM
ERROR AND RANDOM
MISCLASSIFICATION
Random error can work to falsely produce an association (type 1 error)
or falsely not produce an association (type 2 error).
We protect ourselves against random misclassification producing a type
2 error by choosing the most precise and accurate measures of
exposure and outcome.
PROTECTION AGAINST TYPE 1
ERRORS
We protect our study against random type 1 errors by establishing
that the result must be unlikely to have occurred by chance (e.g. p
< .05). P-values are established entirely to protect against
type 1 errors due to chance, and do not guarantee protection
against type 1 errors due to bias or confounding. This is the
reason we say statistics demonstrate association but not
causation.
PROTECTION AGAINST TYPE 2
ERRORS
We protect our study against random type 2
errors by
 providing adequate sample size, and
 hypothesizing large differences.
The larger the sample size, the easier it will
be to detect a true difference, and the largest
differences will be the easiest to detect.
(Imagine how hard it would be to detect a 1%
increase in the risk of gastroenteritis with
bottle-feeding).
KEY PRINCIPLE IN BIAS AND
CONFOUNDING
The factor that creates the bias, or the confounding
variable, must be associated with both the
independent and dependent variables (i.e. with the
exposure and the disease). Association of the bias or
confounder with just one of the two variables is not
enough to produce a spurious result.
In the example just given:
The BIAS, namely incomplete chart recording, has to be associated with
feeding type (the independent variable) and also with recording of
gastroenteritis (the dependent variable) to produce the false result.
The CONFOUNDING VARIABLE (or CONFOUNDER) better hygiene, has to
be associated with feeding type and also with gastroenteritis to produce
the spurious result.
Were the bias or the confounder associated with just the independent
variable or just the dependent variable, they would not produce bias or
confounding.
This gives a useful rule:
If you can show that a potential confounder is NOT associated with
either one of the two variables under study (exposure or outcome),
confounding can be ruled out.
Genetic vs. Environmental:
Detecting causes of disease
Chapter 16
2015
Learning objectives
 Critically review the concept of causality in relation to disease.
 Know Hill’s Criteria for Causality and why such criteria are needed
 Offer coherent arguments of nature versus nurture on health and
disease.
Different levels of causality
Thinking about causality
 What does the term “cause” imply?
 “That which produces an effect” (Chambers 20th C)
 Causality is the relation of cause and effect.
 In health care, we usually talk of cause and effect as etiological factor (cause)
and disease or pathological process (effect), e.g:
 Strep. Pneumoniea causes pneumonia and meningitis.
 Arterial occlusion causes tissue necrosis
Is that what we mean?
 However, what we really mean is:
 infection with Strep. Pneumoniea, under a limited range of conditions, can lead
to the development of pneumonia and meningitis.
 Arterial occlusion leads to tissue necrosis.
 Is this splitting hairs? No, because it reflects our thinking about disease:
what it is, its causes, and, most importantly, what strategies are used to
tackle it.
Different levels of causality
 Very few things have single, isolated causes. Instead they reflect
chains or nets, temporal sequences of events.
 Proximal causes: close factors
 Distal causes: distant factors
 Predisposing factors
 Genetic
 Environmental
 Lifestyle
Distinguishing cause and determinants
from chance associations
 Many factors influence the development of disease in addition to
the direct cause.
 Investigation of cause is complex;
 nature of affected (and unaffected individuals)
 nature of their exposure
Koch's Postulates
• 1. The specific organism should be shown to be
present in all cases of animals suffering from a
specific disease but should not be found in
healthy animals.
• 2. The specific microorganism should be isolated
from the diseased animal and grown in pure
culture on artificial laboratory media.
• 3. This freshly isolated microorganism, when
inoculated into a healthy laboratory animal, should
cause the same disease seen in the original
animal.
• 4. The microorganism should be reisolated in pure
culture from the experimental infection.
Hill’s criteria
 Strength of association
 Temporal relationship
 Distribution of the disease
 Gradient
 Consistency
 Specificity
 Biological plausability
 Experimental models
 Preventive trials
Risk
 Risk is the likelihood of an event occurring. In health care events, we
usually consider a negative consequence arising from exposure to a hazard.
 Types of risk
 Absolute: incidence of disease in any population
 Relative: ratio of the incidence rate in the group exposed to the hazard to the
incidence rate in the non-exposed group
 Attributable: Difference in incidence rates between exposed and non-exposed
groups.
Errors in thinking about causality
 The following reflect common mistakes in thinking about causes of
disease
 Genes cause disease
 Disease is due to "Lifestyle”
 Environment accounts for most variation in disease rates
 Why are they problematic?
 What do you think?
Problematic thinking: “disease-gene”
 All disease is a product of gene-environment interaction.
 Genes specify protein structures -ONLY
 Only when genes come into contact with an environment is their
advantage or disadvantage apparent: environment could be
cellular or geographic.
 Lifestyle, (includes ageing, nutrition, infection, toxin exposure)
Do genes cause disease?
 It all depends…on who…you ask
 Differentiate
 gene
a. genetic material instructing proteins that confer
relative advantage or disadvantage (inherited
polymorphisms): “normal”.
b. germ-line mutations: instructing proteins that
confer relative advantage or disadvantage
(sporadic/random polymorphisms) in germ cells -
inheritable
c. somatic mutation: instructing proteins that confer
relative advantage or disadvantage (sporadic or
random) limited to one cell.
What proportion of cancer is due to “cancer-
causing genes”?
 Can you see what is wrong with this question?
 Only ~10% of cancers are believed to be related to specific “cancer causing”
genes, e.g. BRCA1;
 Of these, most are “interactive”, accounted for by e.g. Ca prostate (~40% of
risk due to heritable factors; Ca Br. 27%; colorectal, 35%).
 Very few, rare cancers, e.g. retinoblastoma
Epidemiological model for
disease evaluation
Comparison of US Federal expenditure to
allocation of mortality according to
epidemiological modelEpidemiological
model
Federal health
expenditure
1974-1976 (%)
Allocation of
mortality (%)
• System of
medical care
organization
90.2 11
• Lifestyle 1.3 43
• Environment 1.6 19
• Human biology 6.9 27
Interactions
 Genes do not “cause” diseases. It is wrong to claim they do. Genes instruct
the manufacture of proteins, which may or may not advantage or disadvantage
the organism under certain conditions.
 Similarly, no single disease can be attributed to environment. Even poisoning is
influenced by phenotypical detoxification, which is genetically modulated.
 Lifestyle is even more complex that either genes or environment.
Barker’s Hypothesis
 Barker’s Hypothesis
 Take a look at the above link for further information.

More Related Content

What's hot

Nursing knowledge
Nursing knowledgeNursing knowledge
Nursing knowledge
Esther Ying
 
Duffy
DuffyDuffy
3.5.2 selection bias
3.5.2 selection bias3.5.2 selection bias
3.5.2 selection bias
A M
 
Concepts of Theories and Practices.
Concepts of Theories and Practices.Concepts of Theories and Practices.
Concepts of Theories and Practices.
DR .PALLAVI PATHANIA
 
Notification(degree)
Notification(degree)Notification(degree)
Notification(degree)
razakustaad
 
MYRA ESTRIN LEVINE PPT.pptx
MYRA ESTRIN LEVINE PPT.pptxMYRA ESTRIN LEVINE PPT.pptx
MYRA ESTRIN LEVINE PPT.pptx
Anmol155254
 
Causation in epidemiology
Causation in epidemiologyCausation in epidemiology
Causation in epidemiology
Soyebo Oluseye
 
Criteria for causal association
Criteria for causal associationCriteria for causal association
Criteria for causal association
drkaushikp
 
Watson's theory of human caring
Watson's theory of human caringWatson's theory of human caring
Watson's theory of human caring
Nisha Yadav
 
Association causation
Association causationAssociation causation
Association causation
Vishnu Yenganti
 
How to determine sample size
How to determine sample size How to determine sample size
How to determine sample size
saifur rahman
 
association and causation
association and causationassociation and causation
association and causation
guestc43c63
 
Association & cousation
Association & cousationAssociation & cousation
Association & cousation
mir hashem hosseini
 
3.5.1 information bias
3.5.1 information bias3.5.1 information bias
3.5.1 information bias
A M
 
Network meta analysis
Network meta analysisNetwork meta analysis
Network meta analysis
Nitisha Thakur
 
Association & causation
Association & causationAssociation & causation
Association & causation
Dr.Priyanka Sharma
 

What's hot (16)

Nursing knowledge
Nursing knowledgeNursing knowledge
Nursing knowledge
 
Duffy
DuffyDuffy
Duffy
 
3.5.2 selection bias
3.5.2 selection bias3.5.2 selection bias
3.5.2 selection bias
 
Concepts of Theories and Practices.
Concepts of Theories and Practices.Concepts of Theories and Practices.
Concepts of Theories and Practices.
 
Notification(degree)
Notification(degree)Notification(degree)
Notification(degree)
 
MYRA ESTRIN LEVINE PPT.pptx
MYRA ESTRIN LEVINE PPT.pptxMYRA ESTRIN LEVINE PPT.pptx
MYRA ESTRIN LEVINE PPT.pptx
 
Causation in epidemiology
Causation in epidemiologyCausation in epidemiology
Causation in epidemiology
 
Criteria for causal association
Criteria for causal associationCriteria for causal association
Criteria for causal association
 
Watson's theory of human caring
Watson's theory of human caringWatson's theory of human caring
Watson's theory of human caring
 
Association causation
Association causationAssociation causation
Association causation
 
How to determine sample size
How to determine sample size How to determine sample size
How to determine sample size
 
association and causation
association and causationassociation and causation
association and causation
 
Association & cousation
Association & cousationAssociation & cousation
Association & cousation
 
3.5.1 information bias
3.5.1 information bias3.5.1 information bias
3.5.1 information bias
 
Network meta analysis
Network meta analysisNetwork meta analysis
Network meta analysis
 
Association & causation
Association & causationAssociation & causation
Association & causation
 

Similar to Week 4 chapter 14 15 and 16

Association and causation
Association and causationAssociation and causation
Association and causation
SharanyaSreekumar
 
2. IOHA - The exposome
2. IOHA - The exposome2. IOHA - The exposome
2. IOHA - The exposome
Retired
 
CONCEPT OF DISEASE CAUSATION AND NATURE HISTORY OF DISEASE.pptx
CONCEPT OF DISEASE CAUSATION AND NATURE HISTORY OF DISEASE.pptxCONCEPT OF DISEASE CAUSATION AND NATURE HISTORY OF DISEASE.pptx
CONCEPT OF DISEASE CAUSATION AND NATURE HISTORY OF DISEASE.pptx
PRATIKAWALE5
 
Causation or association
Causation or associationCausation or association
Causation or association
Hamdi Alhakimi
 
Etiology of diseases(claudin.caryl)
Etiology of diseases(claudin.caryl)Etiology of diseases(claudin.caryl)
Etiology of diseases(claudin.caryl)
Kym Anne Surmion II
 
Introduction to Epidemiology
Introduction to EpidemiologyIntroduction to Epidemiology
Introduction to Epidemiology
Aya Mohamed
 
Concepts of disease causation
Concepts of disease causationConcepts of disease causation
Concepts of disease causation
Bhoj Raj Singh
 
Theories of disease causation..ppt
Theories of disease causation..pptTheories of disease causation..ppt
Theories of disease causation..ppt
Monika Sharma
 
Theories of disease causation..ppt
Theories of disease causation..pptTheories of disease causation..ppt
Theories of disease causation..ppt
Monika Sharma
 
ARTÍCULO_Epidemiology the foundation of public health (Inglés) autor Roger De...
ARTÍCULO_Epidemiology the foundation of public health (Inglés) autor Roger De...ARTÍCULO_Epidemiology the foundation of public health (Inglés) autor Roger De...
ARTÍCULO_Epidemiology the foundation of public health (Inglés) autor Roger De...
Hilda Santos Padrón
 
Disease causation
Disease causationDisease causation
Disease causation
Bhoj Raj Singh
 
Causation in epidemiology
Causation in epidemiologyCausation in epidemiology
Causation in epidemiology
Mehwish Iqbal
 
Association & Causation
Association & CausationAssociation & Causation
Association & Causation
Dr. Ravi Prakash
 
Russo Madrid Medicine Oct07
Russo Madrid Medicine Oct07Russo Madrid Medicine Oct07
the theories of illness pharmocology pptx
the theories of illness pharmocology pptxthe theories of illness pharmocology pptx
the theories of illness pharmocology pptx
advjitendraagrawal
 
Theories of illness
Theories of illnessTheories of illness
Theories of illness
Anant Layall
 
Association &amp; causation m
Association &amp; causation mAssociation &amp; causation m
Association &amp; causation m
Manjesh Goswami
 
Epidemiology Course Summary
Epidemiology Course SummaryEpidemiology Course Summary
Epidemiology Course Summary
Rikki Wright
 
Final Thesis 4.21
Final Thesis 4.21Final Thesis 4.21
Final Thesis 4.21
Bennett Doughty
 
This section loois back to some gourd breaking centributions to pubic (1).pdf
This section loois back to some gourd breaking centributions to pubic (1).pdfThis section loois back to some gourd breaking centributions to pubic (1).pdf
This section loois back to some gourd breaking centributions to pubic (1).pdf
aslachennain
 

Similar to Week 4 chapter 14 15 and 16 (20)

Association and causation
Association and causationAssociation and causation
Association and causation
 
2. IOHA - The exposome
2. IOHA - The exposome2. IOHA - The exposome
2. IOHA - The exposome
 
CONCEPT OF DISEASE CAUSATION AND NATURE HISTORY OF DISEASE.pptx
CONCEPT OF DISEASE CAUSATION AND NATURE HISTORY OF DISEASE.pptxCONCEPT OF DISEASE CAUSATION AND NATURE HISTORY OF DISEASE.pptx
CONCEPT OF DISEASE CAUSATION AND NATURE HISTORY OF DISEASE.pptx
 
Causation or association
Causation or associationCausation or association
Causation or association
 
Etiology of diseases(claudin.caryl)
Etiology of diseases(claudin.caryl)Etiology of diseases(claudin.caryl)
Etiology of diseases(claudin.caryl)
 
Introduction to Epidemiology
Introduction to EpidemiologyIntroduction to Epidemiology
Introduction to Epidemiology
 
Concepts of disease causation
Concepts of disease causationConcepts of disease causation
Concepts of disease causation
 
Theories of disease causation..ppt
Theories of disease causation..pptTheories of disease causation..ppt
Theories of disease causation..ppt
 
Theories of disease causation..ppt
Theories of disease causation..pptTheories of disease causation..ppt
Theories of disease causation..ppt
 
ARTÍCULO_Epidemiology the foundation of public health (Inglés) autor Roger De...
ARTÍCULO_Epidemiology the foundation of public health (Inglés) autor Roger De...ARTÍCULO_Epidemiology the foundation of public health (Inglés) autor Roger De...
ARTÍCULO_Epidemiology the foundation of public health (Inglés) autor Roger De...
 
Disease causation
Disease causationDisease causation
Disease causation
 
Causation in epidemiology
Causation in epidemiologyCausation in epidemiology
Causation in epidemiology
 
Association & Causation
Association & CausationAssociation & Causation
Association & Causation
 
Russo Madrid Medicine Oct07
Russo Madrid Medicine Oct07Russo Madrid Medicine Oct07
Russo Madrid Medicine Oct07
 
the theories of illness pharmocology pptx
the theories of illness pharmocology pptxthe theories of illness pharmocology pptx
the theories of illness pharmocology pptx
 
Theories of illness
Theories of illnessTheories of illness
Theories of illness
 
Association &amp; causation m
Association &amp; causation mAssociation &amp; causation m
Association &amp; causation m
 
Epidemiology Course Summary
Epidemiology Course SummaryEpidemiology Course Summary
Epidemiology Course Summary
 
Final Thesis 4.21
Final Thesis 4.21Final Thesis 4.21
Final Thesis 4.21
 
This section loois back to some gourd breaking centributions to pubic (1).pdf
This section loois back to some gourd breaking centributions to pubic (1).pdfThis section loois back to some gourd breaking centributions to pubic (1).pdf
This section loois back to some gourd breaking centributions to pubic (1).pdf
 

More from stanbridge

Micro Lab 3 Lecture
Micro Lab 3 LectureMicro Lab 3 Lecture
Micro Lab 3 Lecture
stanbridge
 
Creating a poster v2
Creating a poster v2Creating a poster v2
Creating a poster v2
stanbridge
 
Creating a poster
Creating a posterCreating a poster
Creating a poster
stanbridge
 
Sample poster
Sample posterSample poster
Sample poster
stanbridge
 
OT 5018 Thesis Dissemination
OT 5018 Thesis DisseminationOT 5018 Thesis Dissemination
OT 5018 Thesis Dissemination
stanbridge
 
Ot5101 005 week 5
Ot5101 005 week 5Ot5101 005 week 5
Ot5101 005 week 5
stanbridge
 
Ot5101 005 week4
Ot5101 005 week4Ot5101 005 week4
Ot5101 005 week4
stanbridge
 
Compliance, motivation, and health behaviors
Compliance, motivation, and health behaviors Compliance, motivation, and health behaviors
Compliance, motivation, and health behaviors
stanbridge
 
Ch 5 developmental stages of the learner
Ch 5   developmental stages of the learnerCh 5   developmental stages of the learner
Ch 5 developmental stages of the learner
stanbridge
 
OT 5101 week2 theory policy
OT 5101 week2 theory policyOT 5101 week2 theory policy
OT 5101 week2 theory policy
stanbridge
 
OT 5101 week3 planning needs assessment
OT 5101 week3 planning needs assessmentOT 5101 week3 planning needs assessment
OT 5101 week3 planning needs assessment
stanbridge
 
Ot5101 week1
Ot5101 week1Ot5101 week1
Ot5101 week1
stanbridge
 
NUR 304 Chapter005
NUR 304 Chapter005NUR 304 Chapter005
NUR 304 Chapter005
stanbridge
 
NUR 3043 Chapter007
NUR 3043 Chapter007NUR 3043 Chapter007
NUR 3043 Chapter007
stanbridge
 
NUR 3043 Chapter006
NUR 3043 Chapter006NUR 3043 Chapter006
NUR 3043 Chapter006
stanbridge
 
NUR 3043 Chapter004
NUR 3043 Chapter004NUR 3043 Chapter004
NUR 3043 Chapter004
stanbridge
 
3043 Chapter009
3043 Chapter0093043 Chapter009
3043 Chapter009
stanbridge
 
3043 Chapter008
 3043 Chapter008 3043 Chapter008
3043 Chapter008
stanbridge
 
Melnyk ppt chapter_21
Melnyk ppt chapter_21Melnyk ppt chapter_21
Melnyk ppt chapter_21
stanbridge
 
Melnyk ppt chapter_22
Melnyk ppt chapter_22Melnyk ppt chapter_22
Melnyk ppt chapter_22
stanbridge
 

More from stanbridge (20)

Micro Lab 3 Lecture
Micro Lab 3 LectureMicro Lab 3 Lecture
Micro Lab 3 Lecture
 
Creating a poster v2
Creating a poster v2Creating a poster v2
Creating a poster v2
 
Creating a poster
Creating a posterCreating a poster
Creating a poster
 
Sample poster
Sample posterSample poster
Sample poster
 
OT 5018 Thesis Dissemination
OT 5018 Thesis DisseminationOT 5018 Thesis Dissemination
OT 5018 Thesis Dissemination
 
Ot5101 005 week 5
Ot5101 005 week 5Ot5101 005 week 5
Ot5101 005 week 5
 
Ot5101 005 week4
Ot5101 005 week4Ot5101 005 week4
Ot5101 005 week4
 
Compliance, motivation, and health behaviors
Compliance, motivation, and health behaviors Compliance, motivation, and health behaviors
Compliance, motivation, and health behaviors
 
Ch 5 developmental stages of the learner
Ch 5   developmental stages of the learnerCh 5   developmental stages of the learner
Ch 5 developmental stages of the learner
 
OT 5101 week2 theory policy
OT 5101 week2 theory policyOT 5101 week2 theory policy
OT 5101 week2 theory policy
 
OT 5101 week3 planning needs assessment
OT 5101 week3 planning needs assessmentOT 5101 week3 planning needs assessment
OT 5101 week3 planning needs assessment
 
Ot5101 week1
Ot5101 week1Ot5101 week1
Ot5101 week1
 
NUR 304 Chapter005
NUR 304 Chapter005NUR 304 Chapter005
NUR 304 Chapter005
 
NUR 3043 Chapter007
NUR 3043 Chapter007NUR 3043 Chapter007
NUR 3043 Chapter007
 
NUR 3043 Chapter006
NUR 3043 Chapter006NUR 3043 Chapter006
NUR 3043 Chapter006
 
NUR 3043 Chapter004
NUR 3043 Chapter004NUR 3043 Chapter004
NUR 3043 Chapter004
 
3043 Chapter009
3043 Chapter0093043 Chapter009
3043 Chapter009
 
3043 Chapter008
 3043 Chapter008 3043 Chapter008
3043 Chapter008
 
Melnyk ppt chapter_21
Melnyk ppt chapter_21Melnyk ppt chapter_21
Melnyk ppt chapter_21
 
Melnyk ppt chapter_22
Melnyk ppt chapter_22Melnyk ppt chapter_22
Melnyk ppt chapter_22
 

Week 4 chapter 14 15 and 16

  • 1. Cause and effect: the epidemiological approach Chapter 14 2015
  • 2. On completion of your studies you should understand:  The purpose of studying cause and effect in epidemiology is to generate knowledge to prevent and control disease.  That cause and effect understanding is difficult to achieve in epidemiology because of the long natural history of diseases and because of ethical restraints on human experimentation.  How causal thinking in epidemiology fits in with other domains of knowledge, both scientific and non-scientific.  The potential contributions of various study designs for making contributions to causal knowledge.
  • 3. Cause and effect  Cause and effect understanding is the highest form of achievement of scientific knowledge.  Causal knowledge permits rational plans and actions to break the links between the factors causing disease, and disease itself.  Causal knowledge can help predict the outcome of an intervention and help treat disease.  Quote Hippocrates "To know the causes of a disease and to understand the use of the various methods by which the disease may be prevented amounts to the same thing as being able to cure the disease".
  • 4. Epidemiological contributions to cause and effect A philosophy of health and disease.  Models which illustrate that philosophy.  Frameworks for interpreting and applying the evidence.  Study designs to produce evidence.  Evidence for cause and effect in the relationships of numerous factors and diseases.  Development of the reasoning of other disciplines including philosophy and microbiology, in reaching judgement.
  • 5. A cause?  The first and difficult question is, what is a cause?  A cause is something which has an effect.  In epidemiology a cause can be considered to be something that alters the frequency of disease, health status or associated factors in a population.  Pragmatic definition.  Philosophers have grappled with the nature of causality for thousands of years.
  • 6. Epidemiological strategy and reasoning: the example of Semelweis  Diseases form patterns, which are ever changing.  Clues to the causes of disease are inherent within these pattern.  Semelweis (1818-1865) observed that the mortality from childbed fever (now known as puerperal fever) was lower in women attending clinic 2 run by midwives than it was in those attending clinic 1 run by doctors.  Do these observations spark off any ideas of causation in your mind?
  • 7. Births, deaths, and mortality rates (%) for all patients at the two clinics 1841-1846 First clinic Second clinic Births Deaths Rate Births Deaths Rate 20042 1989 9.92 17791 691 3.38
  • 8. Semmelweis’ inspiration  In 1847, his colleague and friend Professor Kolletschka died following a fingerprick with a knife used to conduct an autopsy.  Kolletschka’s autopsy showed inflammation to be widespread, with peritonitis, and meningitis.  “Day and night I was haunted by the image of Kolletschka’s disease and was forced to recognise, ever more decisively that the disease from which Kolletschka died was identical to that from which so many maternity patients died.”  Semelweis' inspired idea was that particles had been transferred from the scalpel to the vascular system of his friend and that the same particles were killing maternity patients.
  • 9. Semmelweis’ action  If so, something stronger than ordinary soap was needed for handwashing  He introduced chlorina liquida, and then for reasons of economy, chlorinated lime.  The maternal mortality rate plummeted.  Semelweis’s discovery was resented in Vienna. .
  • 10.  Deep knowledge derives from the explanation of disease patterns, rather than in their description.  Inspiration is needed, and may come from unexpected sources, as here from Kolletschka’s autopsy.  Action cannot always await understanding the mechanism.  Epidemiological data to show that laying an infant on its front (prone position) to sleep raises the risk of 'cot death' or sudden infant death syndrome.  A campaign to persuade parents to lay their infants on their backs has halved the incidence of cot death.  Epidemiologists are reliant on other sciences, laboratory or social, to be equal partners, in pursuit of the mechanisms.
  • 11. Epidemiological principles and models of cause and effect  Most important of the cause and effect ideas underpinned by epidemiology is that disease is virtually always a result of the interplay of the environment, the genetic and physical makeup of the individual, and the agent of disease.  Diseases attributed to single causes are invariably so by definition.  The fact that “tuberculosis” is “caused” by the tubercle bacillus is a matter of definition.  The causes of tuberculosis, from an epidemiological or public-health perspective, are many, including malnutrition and overcrowding.  This idea is captured by several well known disease causation models, such as the line, triangle, the wheel, and the web.
  • 12. Clues Stable in incidence Clusters in families Clues Incidence varies rapidly over time or between genetically similar populations Is the disease predominantly genetic or environmental? Genetic Environmental
  • 13. Down’s syndrome Phenylketonuria Sickle cell disease Diabetes Asthma Coronary heart disease Stroke Lung cancer Road traffic accidents Genetic Environmental
  • 14. Host: Inhalation of infective organism, age, smoking, male sex, cardio-respiratory disease Environment: Presence of cooling towers and complex hot water systems; aerosols created but not contained, meteorological conditions take aerosol to humans Agent: Virulent Legionella organisms, e.g. pneumophila serotype
  • 15. Control smoking and causes of immunodeficiency Avoid wet type cooling towers, look for a better design and location, separate towers from population and enhance tower hygiene Minimise growth of organisms and factors which enhance pathogenicity, e.g. algae
  • 16. Physical environment Social environment Chemical & biological environment Gene / host The model emphasises the unity of the gene and host within an interactive environmental envelope The overlap between environmental components emphasises the arbitrary distinctions
  • 17. Physical environment: availability of health care facilities for diagnosis Social environment: social support to sustain dietary change Chemical & biological environment: diet content Gene defect/ enzyme deficiency/ brain damage
  • 18. Models of cause and effect  Agent factors, arguably, receive less attention than they deserve.  Characterising the virulence of organisms is difficult.  In other diseases conceptualising the cause as an agent is not easy.  The concept of the disease agent has been applied to infections but it works well with many non-infectious agents, for example, cigarettes, motor cars, and alcohol.  The interaction of the host, agent and environment is rarely understood.  The effect of cigarette smoking is substantially greater in poor people than in rich people.
  • 19. Models: the wheel  The wheel of causation.  Emphasises the unity of the interacting factors.  Emphasises the fact that the division of the environment into components is somewhat arbitrary.  Model is applied to phenylketonuria, the archetypal genetic disorder.  Phenylketonuria is an autosomal single gene disease .  An enzyme required to metabolise the dietary amino-acid phenylalanine and turn it into tyrosine, is deficient.
  • 20. The wheel: phenylketonuria  Brain damage is the outcome.  The cause of this disease could be said to be a gene.  The cause of the disease could be considered as a combination of a gene.  Exposure to a chemical and biological environment which provides a diet containing a high amount of phenylalanine.  A social environment unable to protect the child from the consequences, of a gene disorder.
  • 21. Models: the spider’s web  For many disorders our understanding of the causes is highly complex.  Either the causes are truly complex, or equally likely, our understanding is too rudimentary to permit clarity.  These disorders are referred to as multifactorial or polyfactorial disorders.  Mechanisms of causation are not apparent.  Portrayed by the metaphor of the spider’s web.  This modelindicates the potential for the disease to influence the causes and not just the other way around, so-called, reverse causality.  It also poses a fundamental question: Where is the spider that spun the web?
  • 22.
  • 23.
  • 24. Rothman’s component causes model  Rothman's interacting component causes model has emphasised that the causes of disease comprise a constellation of factors.  It has broadened the sufficient cause concept to be a minimal set of conditions which together inevitably produce the disease.  The concept is shown in figure 11  Three combinations of factors (ABC, BED, ACE) are shown here as sufficient causes of the disease.  Each of the constituents of the causal "pie" are necessary.  Control of the disease could be achieved by removing one of the components in each "pie" and if there were a factor common to all "pies" the disease would be eliminated by removing that alone.
  • 25. Figure 11 A B C A E D A E C Each of the three components of the interacting constellations of causes (ABC, ADE, ACE) are in themselves sufficient and each is necessary
  • 26. Application of guidelines/criteria to associations  An association rarely reflects a causal relationship but it may.  These six criteria are a distillation of, or at least, echo the ten Alfred Evans' postulates in Last's Dictionary of Epidemiology (4th edition) and the nine Bradford Hill criteria.
  • 27. Strength and dose response  Does exposure to the cause change disease incidence?  If not there is no epidemiological basis for a conclusion on cause and effect.  Failure to demonstrate this does not, however, disprove a causal role.  The usual measure of the increase in incidence is the relative risk and the technical name for this criterion is the strength of the association.  Dose-response  Does the disease incidence vary with the level of exposure? If yes, the case for causality is advanced.  The dose-response relation is also measured using the relative risk.
  • 28. Specificity  Is the effect of the supposed cause specific to relevant diseases, and, are diseases caused by a limited number of supposed causes?  Imagine a factor which was linked to all health effects  Why would that be so?  Non-specificity is characteristic of spurious associations eg underestimating the size of the denominator.  While specificity is not a critically important criterion epidemiologists should take advantage of the reasoning power it offers.
  • 29. Consistency  Is the evidence within and between studies consistent?  Consistency is linked to generalisability of findings.  Spurious associations are often local.
  • 30. Experiment  Does changing exposure to the supposed cause change disease incidence?  Often there have been natural experiments.  Deliberate experimentation will be necessary.  Human experiments or trials are sometimes impossible on ethical grounds.  Causal understanding can be greatly advanced by laboratory and experimental observations.
  • 31. Biological plausibility  Is there a biological mechanism by which the supposed cause can induce the effect?  For truly novel advances, however, the biological plausibility may not be apparent.  Biologically plausible that laying an infant on its back to sleep may lead to its inhaling vomitus.  Overturned by the biologically implausible observation that laying a child on its back halves the risk of cot death.  Nonetheless, biological plausibility remains relevant to establishing causality.
  • 32. The pyramid of associations 1 Causal and mechanisms understood 2 Causal 3 Non-causal 4 Confounded 5 Spurious / artefact 6 Chance
  • 33. Interpretation of data, study design and causal criteria  Causal knowledge is born in the imagination and understanding of the disease process of the investigator.  Same data can be interpreted in quite different ways.  The paradigm within which epidemiologists work will determine the nature of the causal links they see and emphasise.  Researchers to make explicit in their writings their guiding research philosophy.  No epidemiological design confirms causality and no design is incapable of adding important evidence.
  • 34. Summary  Cause and effect understanding is the highest form of scientific knowledge.  Epidemiological and other forms of causal thinking shows similarity.  An association between disease and the postulated causal factors lies at the core of epidemiology.  Demonstrating causality is difficult because of the complexity and long natural history of many human diseases and because of ethical restraints on human experimentation.
  • 35. Summary  All judgements of cause and effect are tentative.  Be alert for error, the play of chance and bias.  Causal models broaden causal perspectives.  Apply criteria for causality as an aid to thinking.  Look for corroboration of causality from other scientific frameworks.
  • 37. BIAS Systematic, non-random deviation of results and inferences from the truth, or processes leading to such deviation. Any trend in the collection, analysis, interpretation, publication or review of data that can lead to conclusions which are systematically different from the truth. (Dictionary of Epidemiology, 3rd ed.)
  • 38. MORE ON BIAS Note that in bias, the focus is on an artifact of some part of the research process (assembling subjects, collecting data, analyzing data) that produces a spurious result. Bias can produce either a type 1 or a type 2 error, but we usually focus on type 1 errors due to bias.
  • 39. MORE ON BIAS Bias can be either conscious or unconscious. In epidemiology, the word bias does not imply, as in common usage, prejudice or deliberate deviation from the truth.
  • 40. CONFOUNDING A problem resulting from the fact that one feature of study subjects has not been separated from a second feature, and has thus been confounded with it, producing a spurious result. The spuriousness arises from the effect of the first feature being mistakenly attributed to the second feature. Confounding can produce either a type 1 or a type 2 error, but we usually focus on type 1 errors.
  • 41. THE DIFFERENCE BETWEEN BIAS AND CONFOUNDING Bias creates an association that is not true, but confounding describes an association that is true, but potentially misleading.
  • 42. EXAMPLES OF RANDOM ERROR, BIAS, MISCLASSIFICATION AND CONFOUNDING IN THE SAME STUDY: STUDY: In a cohort study, babies of women who bottle feed and women who breast feed are compared, and it is found that the incidence of gastroenteritis, as recorded in medical records, is lower in the babies who are breast-fed.
  • 43. EXAMPLE OF RANDOM ERROR By chance, there are more episodes of gastroenteritis in the bottle-fed group in the study sample, producing a type 1 error. (When in truth breast feeding is not protective against gastroenteritis). Or, also by chance, no difference in risk was found, producing a type 2 error (When in truth breast feeding is protective against gastroenteritis).
  • 44. EXAMPLE OF BIAS The medical records of bottle-fed babies only are less complete (perhaps bottle fed babies go to the doctor less) than those of breast fed babies, and thus record fewer episodes of gastro-enteritis in them only. This is called ias because the observation itself is in error.
  • 45. EXAMPLE OF CONFOUNDING The mothers of breast-fed babies are of higher social class, and the babies thus have better hygiene, less crowding and perhaps other factors that protect against gastroenteritis. Crowding and hygiene are truly protective against gastroenteritis, but we mistakenly attribute their effects to breast feeding. This is called confounding. because the observation is correct, but its explanation is wrong.
  • 46. PROTECTION AGAINST RANDOM ERROR AND RANDOM MISCLASSIFICATION Random error can work to falsely produce an association (type 1 error) or falsely not produce an association (type 2 error). We protect ourselves against random misclassification producing a type 2 error by choosing the most precise and accurate measures of exposure and outcome.
  • 47. PROTECTION AGAINST TYPE 1 ERRORS We protect our study against random type 1 errors by establishing that the result must be unlikely to have occurred by chance (e.g. p < .05). P-values are established entirely to protect against type 1 errors due to chance, and do not guarantee protection against type 1 errors due to bias or confounding. This is the reason we say statistics demonstrate association but not causation.
  • 48. PROTECTION AGAINST TYPE 2 ERRORS We protect our study against random type 2 errors by  providing adequate sample size, and  hypothesizing large differences. The larger the sample size, the easier it will be to detect a true difference, and the largest differences will be the easiest to detect. (Imagine how hard it would be to detect a 1% increase in the risk of gastroenteritis with bottle-feeding).
  • 49. KEY PRINCIPLE IN BIAS AND CONFOUNDING The factor that creates the bias, or the confounding variable, must be associated with both the independent and dependent variables (i.e. with the exposure and the disease). Association of the bias or confounder with just one of the two variables is not enough to produce a spurious result.
  • 50. In the example just given: The BIAS, namely incomplete chart recording, has to be associated with feeding type (the independent variable) and also with recording of gastroenteritis (the dependent variable) to produce the false result. The CONFOUNDING VARIABLE (or CONFOUNDER) better hygiene, has to be associated with feeding type and also with gastroenteritis to produce the spurious result.
  • 51. Were the bias or the confounder associated with just the independent variable or just the dependent variable, they would not produce bias or confounding. This gives a useful rule: If you can show that a potential confounder is NOT associated with either one of the two variables under study (exposure or outcome), confounding can be ruled out.
  • 52.
  • 53. Genetic vs. Environmental: Detecting causes of disease Chapter 16 2015
  • 54. Learning objectives  Critically review the concept of causality in relation to disease.  Know Hill’s Criteria for Causality and why such criteria are needed  Offer coherent arguments of nature versus nurture on health and disease.
  • 55. Different levels of causality
  • 56. Thinking about causality  What does the term “cause” imply?  “That which produces an effect” (Chambers 20th C)  Causality is the relation of cause and effect.  In health care, we usually talk of cause and effect as etiological factor (cause) and disease or pathological process (effect), e.g:  Strep. Pneumoniea causes pneumonia and meningitis.  Arterial occlusion causes tissue necrosis
  • 57. Is that what we mean?  However, what we really mean is:  infection with Strep. Pneumoniea, under a limited range of conditions, can lead to the development of pneumonia and meningitis.  Arterial occlusion leads to tissue necrosis.  Is this splitting hairs? No, because it reflects our thinking about disease: what it is, its causes, and, most importantly, what strategies are used to tackle it.
  • 58. Different levels of causality  Very few things have single, isolated causes. Instead they reflect chains or nets, temporal sequences of events.  Proximal causes: close factors  Distal causes: distant factors  Predisposing factors  Genetic  Environmental  Lifestyle
  • 59. Distinguishing cause and determinants from chance associations  Many factors influence the development of disease in addition to the direct cause.  Investigation of cause is complex;  nature of affected (and unaffected individuals)  nature of their exposure
  • 60. Koch's Postulates • 1. The specific organism should be shown to be present in all cases of animals suffering from a specific disease but should not be found in healthy animals. • 2. The specific microorganism should be isolated from the diseased animal and grown in pure culture on artificial laboratory media. • 3. This freshly isolated microorganism, when inoculated into a healthy laboratory animal, should cause the same disease seen in the original animal. • 4. The microorganism should be reisolated in pure culture from the experimental infection.
  • 61. Hill’s criteria  Strength of association  Temporal relationship  Distribution of the disease  Gradient  Consistency  Specificity  Biological plausability  Experimental models  Preventive trials
  • 62. Risk  Risk is the likelihood of an event occurring. In health care events, we usually consider a negative consequence arising from exposure to a hazard.  Types of risk  Absolute: incidence of disease in any population  Relative: ratio of the incidence rate in the group exposed to the hazard to the incidence rate in the non-exposed group  Attributable: Difference in incidence rates between exposed and non-exposed groups.
  • 63. Errors in thinking about causality  The following reflect common mistakes in thinking about causes of disease  Genes cause disease  Disease is due to "Lifestyle”  Environment accounts for most variation in disease rates  Why are they problematic?  What do you think?
  • 64. Problematic thinking: “disease-gene”  All disease is a product of gene-environment interaction.  Genes specify protein structures -ONLY  Only when genes come into contact with an environment is their advantage or disadvantage apparent: environment could be cellular or geographic.  Lifestyle, (includes ageing, nutrition, infection, toxin exposure)
  • 65. Do genes cause disease?  It all depends…on who…you ask  Differentiate  gene a. genetic material instructing proteins that confer relative advantage or disadvantage (inherited polymorphisms): “normal”. b. germ-line mutations: instructing proteins that confer relative advantage or disadvantage (sporadic/random polymorphisms) in germ cells - inheritable c. somatic mutation: instructing proteins that confer relative advantage or disadvantage (sporadic or random) limited to one cell.
  • 66. What proportion of cancer is due to “cancer- causing genes”?  Can you see what is wrong with this question?  Only ~10% of cancers are believed to be related to specific “cancer causing” genes, e.g. BRCA1;  Of these, most are “interactive”, accounted for by e.g. Ca prostate (~40% of risk due to heritable factors; Ca Br. 27%; colorectal, 35%).  Very few, rare cancers, e.g. retinoblastoma
  • 68. Comparison of US Federal expenditure to allocation of mortality according to epidemiological modelEpidemiological model Federal health expenditure 1974-1976 (%) Allocation of mortality (%) • System of medical care organization 90.2 11 • Lifestyle 1.3 43 • Environment 1.6 19 • Human biology 6.9 27
  • 69. Interactions  Genes do not “cause” diseases. It is wrong to claim they do. Genes instruct the manufacture of proteins, which may or may not advantage or disadvantage the organism under certain conditions.  Similarly, no single disease can be attributed to environment. Even poisoning is influenced by phenotypical detoxification, which is genetically modulated.  Lifestyle is even more complex that either genes or environment.
  • 70. Barker’s Hypothesis  Barker’s Hypothesis  Take a look at the above link for further information.

Editor's Notes

  1. Slides supporting chapter 14 of the book:
  2. How to use a systematic approach which checks for error, chance and bias before reaching judgements on cause and effect. That epidemiological approaches to and criteria for causality are not a checklist and therefore conclusions must be carefully judged and tentative. The need to synthesise data from epidemiological studies and other disciplines before reaching conclusions
  3. Epidemiology is best conducted as a multidisciplinary endeavour.
  4. The model broadens the causal thinking within the gene/host envelope &amp; emphasis the broader cause &amp; provides a basis for prevention and control
  5. There is no single cause Causes of disease are interacting Disentangling is high possible Causality may be two way
  6. This lecture is to prompt you to think about some of the issues in understanding how diseases might emerge. There is much publicity, and even wild speculation about the benefits that will be derived from the “cracking” of the genetic code. However, the history of medicine is the history of claims of future benefit (see Porter’s article in the web-link). This lecture looks at some issues, tries to prompt you to think and hopefully, it may open up a creative view that might just lead to identifying a new way forward for some aspect of health care. As retrieved from: R. Fielding Dept. Community Medicine, HKU http://www.commed.hku.hk/
  7. In this lecture we will critically review the concept of causality in relation to disease. This involves an understanding of how we think about disease, as well as a background in the development of tools we now use to explore the relationship between disease causes and their effects. Finally, we need to consider the relative contributions of nature, as genetic processes, and nurture, as environmental influence, to develop a realistic model of how disease develops.
  8. We use the word “cause” far too loosely. Few things in medicine have clear causes, though disease determinants, risk factors and precursors can and have been readily identified. Loose language both reflects and leads to loose thinking. When we say a virus “causes” a disease, is that really the case? For example, do the viruses associated with common Colds cause the colds? For causality to be confirmed, certain criteria must be met. The effect should not occur in the absence of the putative cause; The greater the “dose” of the cause, the greater should be the magnitude of the effect; In the case of disease, the mechanisms should be biologically plausible; Does the virus model of colds fit these criteria? The cold viruses are almost always present, but cold symptoms are not; Increasing the viral load increases symptoms. No symptoms in the absence of viruses. Viruses are plausible biological agents. So, viruses seem to be necessary, but they are only part of the picture. And that is the problem because it is all too often assumed that they are the whole picture. And that is wrong.
  9. It is very rare that only one thing causes one effect so consistently that it is clearly known. It has long been understood that certain compounds or plants have physiological effects if ingested. This is where almost all of our active medicines come from. However, let’s consider bugs some more: Strep. Pneumoniea can lead to pneumonia, but not always. Many other factors will influence this. If the immune system is active and sharp, the body can protect itself from many microbes. But knock out t-lymphocytes, as in AIDS for example, and all kinds of things that were previously not “causes” become highly effective at producing disease. So, is the cause of these AIDS-related diseases, like fungal pneumonia, the fungal agent (proximal cause) or the human immune deficiency virus (pre-disposing factor)? Or is it the damage to the skin that enabled the virus to gain entry to the body? Or is it the emotional resistance to using condoms which enables the virus to cross from one person to another? Or the opportunity for unprotected sexual intercourse with more than one person (distal cause)? When we look at things this way, we see chains or “nets” of cause and effect, with nodes where several factors converge and an effect emerges, or is suppressed, much like constructive and destructive interference between waveforms. (As an illustration of how our thinking influences how we see the world, in the causal network, diseases can be due to the suppression of “good” effects as well as the occurrence of “bad” effects. This implication isn’t apparent from the simple cause-effect model.) How we think about causes will determine what we do to try to fix or prevent a disease. Indeed, we can go further and ask what exactly is a disease?
  10. Generally, diseases are physiological abnormalities, determined on the basis of a change in form, function or feeling, or on the basis of a physiological measure falling outside of some pre-determined range of values (normal range). Three main classes or dimensions of cause are popularly grouped under the following headings: Genetic: all and any heritable factors associated with a disease Environment: all and any non-heritable factors, particularly those related to physical and/or internal physiological environment. Lifestyle: the exposure history of a person or activities, habits, and locations that constitute their sequence of lived environments and acts. This is dependent upon a person’s location, acts, and interactions. These three groups constitute the majority of popular “explanations” for why disease occurs where and when it does. This disease is due to “faulty genes”, that disease is due to “environmental influences”, another disease is due to “lifestyle factors”, and so on. However, “explanations are not causes, but everywhere they are treated as if they were”. (quote, source unknown). However, there are some clearer and more specific criteria for determining if a agent is causally connected to an effect we label a disease.
  11. Carefully controlled experiments that test equally rigourously derived hypotheses should be used to examine the effects of each postulated cause. In a laboratory situation it is possible to eliminate, or adjust for the effects of factors that are either not of interest, such as diet or family interaction, or which are considered to confound the impact of some putative cause. The effect of the causal agent can then be assessed by exposing half of the group of subjects to it and preventing exposure in the other half - the control group while both groups are kept in standard conditions. Such a design allows us to be confident that the consequent development of the effects of exposure only in those exposed, are due to the causal agent and not something else. However, in most situations, these kinds of rigourously controlled experiments are impractical on large numbers of people who live their day-to-day lives in the real world. More important, they are often unethical. So we must adopt other methods. Different types of evidence (which ultimately underpin the EBP standards of evidence) that can be used to determine the extent that a cause and effect are linked are found in two main sets of guidelines developed to address these questions: Koch’s Postulates and Hill’s Criteria. Both are very similar, with Hill’s Criteria being derived largely from the earlier work of Koch.
  12. The principles were developed by Koch, the microbiologist who identified the tuberculosis bacillus. At the time they were proposed (late 19th Century), most disease was believed to arise from infectious agents or other, almost completely unknown processes. Koch’s Postulates are still used today to demonstrate causal association between an infectious agent and the development of a disease. Find a person with the disease, identify the microorganism, culture it, inoculate another animal with the cultured microorganism, and if it develops the same disease as the original person, you have isolated the infectious agent. These principles are in use today over 100 years after Koch proposed them. They work. For infections. For simple uni-causal conditions. However, they do not work for example, to help us identify the cause of lung cancer. So how do we identify causes of diseases that are not a result of infectious, living organisms that can be cultured in a Petri dish, such as diabetes or lung cancer? For these kinds of diseases a different, but related set of decision tools are needed.
  13. To distinguish cause from simple association several factors need to be considered. Hill’s Criteria outline these. Strength of association: the stronger the association between a putative cause and effect, the more likely there is to be a connection between the two. Timing: The cause should precede the effect. Never the other way around. Distribution: The spatial distribution of the disease should approximate to the spatial distribution of the causal agent. Gradient: The response should correlate with the dose; more dose=more effect. Consistency: The cause-effect relationship needs to be duplicated in different studies in different places. Specificity: People not exposed to the cause should not develop the effect. Biological plausibility: the biological activity of the suspected cause should be consistent with its effects. Experimental models: animal or other experimental models should demonstrate the effect under experimental conditions. Preventive trials: removal of the suspected cause should lead to removal of the effect.
  14. The above concepts of risk are very important in health care because they represents the strength of the cause-effect relationship for a disease (or associated protective factor, e.g. exercise in Type II diabetes). Absolute Risk is not very useful because there are always variations in exposure to hazards within a population or group. Absolute Risk is an average that cannot show the differences in disease incidence due to differences in exposure. Relative Risk is sometimes expressed as a percentage measure of proportionate increase or decrease (in the case of a protective agent) in disease rates in an exposed group. It is a more useful measure than Absolute Risk. Attributable Risk represents the risk arising from exposure to a particular hazard (or protective factor), I.e. is the risk attributable to the given hazard.
  15. Why are the above erroneous? Because they over-simplify the true picture. They fail to consider that all our biological status is an interaction between the phenotype and the physical environment. Lifestyle is a way of saying “different environments” and no more. However, it’s a useful phrase because when people talk about environmental factors, they usually refer to things external to the body, such as solar radiation, air pollution, smoking and so forth. Lifestyle incorporates these and includes other things found to be important, such as activity level, diet and behaviour, which are more “interactive” aspects between phenotype and environment.
  16. To take a specific, evolutionary perspective, genes encode information to make proteins. That’s all. Nothing more. Now, a specific protein may provide some advantage to an organism such as a cell, in terms of efficiency of metabolism, or absorption or excretion, or it may not. It might provide a disadvantage to that cell. Whether a protein is advantageous, neutral or disadvantageous is solely dependent on the interaction the cell has with its immediate surroundings, other proteins, and so forth. In environments that confer advantage, the cell is more likely to survive and reproduce, and hence the numbers of cells carrying that particular gene will also increase - the frequency of the gene will increase in the population. If the environmental conditions change, there may be a selective disadvantage against cells carrying that gene, so the gene frequency will decline with each cell that fails to reproduce. Useful genes are usually “conserved”, that is, they may not be expressed, or only be partly expressed under conditions where there is no advantage. Disadvantageous genes under one type of environment may prove to advantageous in a different environment. A gene that alters the structure of the red blood cell membrane so that malarial parasites are less likely to successfully develop will do two things: it makes it more difficult for the cells to function normally, but it doesn’t kill you. Malaria, on the other hand, can kill you, so it is to the organism’s advantage to be a little weaker, but alive to reproduce, than to be strong, perfect and dead before reaching puberty. So it is the interaction of a specific phenotype with the range of selection pressures presented by environment and lifestyle that leads to the development of specific advantageous and disadvantageous outcomes. The disadvantageous ones we now call disease, but we have simply tended to ignore the advantageous ones, so far. A key point here to remember is that, from a population perspective, gene frequencies only change over generational time, taking hundreds, if not thousands of years to increase or decline.
  17. Follow the web-links, there are three, to see three different views of this question. We can think of different levels of cause. Normal variations in the human genome, some of which provide advantage and some disadvantage, such as height, eye colour and proportion. Taller people are more successful in life, they are more likely to get better jobs, earn more money and so are advantaged. Their offspring are more likely to get a good start and hence survive, ensuring that trait is maintained. The opposite will also be the case, namely that there are normal variants which are disadvantageous in the present environment of C21st Urban humankind. If there was a sudden change, such as the earth being struck by a large lump of space debris, these disadvantageous genes might come in very useful, ensuring that, while different individuals lived or died, the species as a whole would continue. This variation is the vital genetic flexibility of our species. This includes inherited genes that confer strong disadvantage, such as that for Huntington’s chorea. These tend to be very rare, but because they are only expressed after reproduction, carriers are not selected against by failure of reproduction. Germ line mutations. New changes or polymorphisms in the germ line, (which are heritable). The ones drawn to the attention of the medical profession are usually those that disadvantage the child or adult. Few parents take their child to a doctor because the child is too intelligent for school, or taller than their peers, or better at sports, or can play the piano at 3 years of age. Somatic mutations. New changes to the somatic line (non-inheritable). This includes errors of DNA copying when cells divide, and is implicated as the basis of ageing and some if not most cancer.
  18. There are a great many problems associated with attributing cause to diseases. Cancer is considered the “jewel in the crown” of medical cures. S/he who can cure cancer will undoubtedly win the Nobel Prize and be as famous as Jenner and Pasteur. However, it is seriously problematic from the point of view of cause. At a recent guest lecture to HKU, the Chairman of the Imperial Cancer Research Fund, the oldest and wealthiest in the UK, the director, Sir Walter Bodmer, showed a slide indicating the only around 10% of cancers were due to heritable factors, which he considered at great length. He failed to discuss the other 90% of the most common diseases called cancer. With the exceptions of very rare cancers, such as retinoblastoma, most cancers arise only in the presence of certain environmental factors which have impacted over a lifetime. The longer a person lives and their environment determines their exposure. Their body’s ability to detoxify their environment is partly genotypically determined, but also depends on factors life income (poor can’t afford adequate nutrition, such as fresh fruits, vegetables, clean air), diet, and behaviour (toxin load, from smoking, alcohol use etc.) “True” genetic cancers are very rare for a very good reason. They are selected against.
  19. This table outlines some interesting data. The first column on the left gives the proportion of deaths attributable to the six top causes of mortality in the USA in 1973, listed in the second column (Heart dis. =all heart disease; CVD, cerebro-vascular disease; pneumon = pneumonia; Respiratory= all other respiratory diseases). The third to sixth columns list the proportional contribution to the disease estimated to arise from each of the four columns of: 1. medical care (how much medical care does to prevent mortality from the particular diseases in column two), 2. lifestyle, 3. environmental and 4.biological contributions. These proportions are derived from epidemiological studies which What can you conclude about the predominant sources of cause or prevention of these conditions? If we look at the fourth most important cause of death in the USA in 1973, accidents, we see that about 85% of the variance in accident rates arises from life style and environmental factors, with biology being largely irrelevant as a contributor (2%) and subsequent medical care accounting for little more than one sixth (13%) of the variation in mortality from accidents. Other causes, like cancer,have a larger estimated contribution from biology, but less from treatment.
  20. Compare this table with the previous one. This table details the expenditure in the USA in 1974-6 on the four different areas or components listed in the previous table (medical care, lifestyle, environment and biology). The right hand column lists the total estimated contribution to overall mortality from each of the four areas. The middle column gives the proportion of government expenditure allocated to each of these four areas in 1974-1976. While these data are getting dated now, the pattern of spending remains fairly unchanged. They do indicate one thing quite clearly when you consider this table with the data in the previous table. Can you say what this is?
  21. A study of 44,788 pairs of twins in Swedish, Danish and Finnish twin registries (NEJM July 2000) estimated that heritable factors accounted for 42% of risk for prostate cancer, 35% for colorectal cancer and 27% for breast cancer. At present, current genes identified account for much lower proportions of risk in these diseases. So there remain major gaps in knowledge of the genetics of cancer, but still the majority of risk variation is accountable by other, non-heritable factors. Few diseases are caused purely by genes. Genes are only information carriers. External factors can and do disrupt every level from the genes themselves to their final phenotype. At the other end of the spectrum, injuries sustained in a road traffic accident (RTA) have a genetic component, but you wouldn’t want to look for a gene predisposing to RTAs. To do so would be considered silly. Lifestyle is the term used to describe the range of exposures a person receives over their life. These exposures may be in the form of toxins, they may be in the form of microbiological agents, they may be in the form of a pattern of behaviour, dictated by a culture or family which modulates exposure to other toxins, such as tobacco or hazards such as work. Lifestyle is the interaction between heritable and non-heritable influences on a person. Genes exist because they serve some purpose. Polymorphisms are conserved because they provide some advantages under certain environmental conditions; for example it may be a “tolerable” side effect of some other advantageous feature, such as HLA typology, and important immune feature, or may confer some advantage in times of dietary stress. An example is that thalassemias and sickle-cell disease provide some benefit in areas of high malarial prevalence, though are disadvantageous at other times and places. Type 2 Diabetes “genes” are likely to be advantageous when nourishment is scarce, not when plentiful.
  22. Finally, the uterine environment seems to “set” the embryo’s metabolism for what to expect after birth. In lean times, a poorly nourished mother may produce a baby whose metabolism is set to be efficient with energy extraction and storage. Fifty years later, if food has been plentiful, a person’s risk of heart disease, and probably their weight, is much increased. Similar uterine effects have been proposed for other disease, such as breast cancer. This model is called Barker’s Hypothesis.