SlideShare a Scribd company logo
Outline
1. What does causal inference entail?
2. Using directed acyclic graphs
a. DAG basics
b. Identifying confounding
c. Understanding selection bias
3. Causal perspective on effect modification
a. Brief recap of effect modification (EM)
b. Linking EM in our studies to reality
c. Types of interaction
d. Causal interaction / EM
1. Sufficient cause model (“causalpies”)
2. Potential outcomes model (“causal types”)
e. Choosing which measure of interaction to estimate and report
4. Integrating causal concepts into your research
Identifying confounding using DAGs
Outline
1. Review 3 traditional criteria for identifying
confounding
2. DAG criteria to identify confounding
3. Stratification decisions using DAGs
4. Traditional criteria vs. DAGs
Review: 3 criteria for confounding
1. The factor causes the outcome in the source
population
SES
Smoking Cancer
Review: 3 criteria for confounding
1. The factor causes the outcome in the source
population
2. Factor must be associated with the exposure
in the source population
SES
Smoking Cancer
Review: 3 criteria for confounding
1. The factor causes the outcome in the source population
2. Factor must be associated with the exposure in the source
population
3. Factor must not be caused by exposure or
disease SES
Cancer
Smoking
X X
Smoking
Smoking
Cancer
T
ar Mutations
Cancer
• Absence of a directed path from X to Y
implies X has no effect on Y
– Directed paths not in the graph as important as those in
the graph
• Note: Not all intermediate steps between two
variables need to be represented
– Depends on level of detail of the model
6
Quick DAG assumptions reminder
• All common causes of exposure and disease are
included
– Common causes that are not observed should still be
included
U (religious
beliefs, culture,
lifestyle, etc.)
Alcohol Use
Smoking
Heart Disease
Quick DAG assumptions reminder
7
Identifying confounding with DAGs
Approach 1
1) Remove all direct effects of the exposure
– These are the effects of interest
– In their absence, is an association still present?
– This can be assessed with the next step
Health behaviors
Vitamins Cancer
8
Identifying confounding with DAGs
Approach 1
2) Check whether disease and exposure share a common
cause (ancestor)
– Does any variable connect to E and to D by following only
forward pointing arrows?
– If E and D have a common cause then confounding is present
– A common cause will lead to an association between E and D
that is not due to the effect of E on D
Health behaviors
Vitamins Cancer
9
Prenatal care
Difficulty conceiving
SES
Maternal genetics
Identifying confounding with DAGs
Vitamins Birth defects
1
0
Approach 1 -
‐Example
– If we just adjust for prenatal care, is it sufficient to control
for confounding between vitamins and birth defects?
Prenatal care Maternal genetics
Identifying confounding with DAGs
Vitamins Birth defects
1
1
Approach 1 -
‐Example
– Step 1: Is prenatal care caused by vitamin use or birth
defects? If yes, we should not adjust for it
– Do not adjust for an effect of the exposure or outcome of
interest
SES Difficulty conceiving
– Step 2: Delete all non-‐ancestorsof vitamin use, birth
defects, or prenatal care
– If not an ancestor of vitamin use or birth defects, then cannot be a
common cause
– If not an ancestor of prenatal care, then new associations between
exposure and disease cannot be created by adjusting for prenatal
care
SES Difficulty conceiving
Prenatal care Maternal genetics
Identifying confounding with DAGs
Vitamins Birth defects
1
2
Approach 1 -
‐Example
Prenatal care
Difficulty conceiving
SES
Maternal genetics
– Step 3: Delete all direct effects of vitamins
– These are the effects of interest
– In their absence, is an association still present?
– If so, we still have confounding
Vitamins Birth defects
1
3
Identifying confounding with DAGs
Approach 1 -
‐Example
– Step 4: Connect any two causes sharing a common effect
– Adjustment for the effect will result in association of its common
causes
Prenatal care
Difficulty conceiving
SES
Maternal genetics
Identifying confounding with DAGs
Vitamins Birth defects
1
4
Approach 1 -
‐Example
– Step 5 : Strip arrow heads from all edges
– Moving from a graph that represents causal effects to a graph that
represents the associations we expect to observe under null
hypothesis (as a result of both confounding and adjustment)
Prenatal care
Difficulty conceiving
SES
Maternal genetics
Identifying confounding with DAGs
Vitamins Birth defects
50
Approach 1 -
‐Example
– Step 6 : Delete prenatal care
– Equivalent to adjusting for prenatal care, now that we have added
to the graph the new associations that will be created by adjusting
Prenatal care
Difficulty conceiving
SES
Maternal genetics
Identifying confounding with DAGs
Vitamins Birth defects
1
6
Approach 1 -
‐Example
– Test: are vitamins and birth defects still connected?
– Yes – adjusting for prenatal care is not sufficient to control
confounding
Difficulty conceiving
SES
Maternal genetics
Identifying confounding with DAGs
Vitamins Birth defects
1
7
Approach 1 -
‐Example
Difficulty conceiving
SES
Maternal genetics
Identifying confounding with DAGs
Vitamins Birth defects
1
8
Approach 1 -
‐Example
– After adjusting for prenatal care, vitamins and birth defects
will still be associated even if vitamins have no causal effect
on birth defects
– What set would be sufficient to control confounding?
– Prenatal care and one of SES, difficulty conceiving or maternal
genetics
Difficulty conceiving
SES
Maternal genetics
Identifying confounding with DAGs
Vitamins Birth defects
1
9
Approach 1 -
‐Example
2
0
1) No variables in C should be descendants of E or D
2) Delete all non-ancestors of {E, D, C}
3) Delete all arrows emanating from E
4) Connect any two parents with a common child
5) Strip arrowheads from all edges
6) Delete C
• Test: If E is disconnected from D in the remaining graph,
then adjustment for C is sufficient to remove confounding
Identifying confounding with DAGs
Approach 1 – Summary of Steps
• Summary of steps to assess whether adjustment for a set
of confounders “C” sufficient to control for confounding of
the relationship between E and D
Identifying confounding with DAGs
Approach 2
X Y
• Goal: block all back-door paths from X to Y
• Back-door path: an undirected path from X to Y that has an arrow
pointing into X
Z
X Y
Z
A back-‐doorpath is
present (blue arrows)
2
1
This is a directed path,
and there are no back-‐
door pathways in this
DAG
57
1. The potential confounders are not descendants of X
2. There is no open back-door path from X to Y after controlling for them
• When the back-door criterion is met, we can identify the effect of X
on Y
Identifying confounding with DAGs
Approach 2
• Back-door criterion:
X: Low
education
Y: Diabetes
W: Mother
had diabetes
Z1: Family
income
during
childhood
Z2 :Mother’s
genetic
diabetes risk
Prenatal care
Difficulty conceiving
SES
Maternal genetics
• Controlling for prenatal care opens a path from SES to difficulty
conceiving
Identifying confounding with DAGs
Vitamins Birth defects
2
3
Approach 2 -
‐Example
Prenatal care Maternal genetics
• Controlling for prenatal care opens a path from SES to difficulty
conceiving
• Controlling for maternal genetics or difficulty conceiving closes the
remaining backdoor pathway
• To identify the effect of vitamins on birth defects, control for prenatal
care & maternal genetics or prenatal care & difficulty conceiving
SES Difficulty conceiving
Identifying confounding with DAGs
Vitamins Birth defects
2
4
Approach 2 -
‐Example
• Criterion 2 states the confounder is “associated with the
exposure in the source population”
• For association to exist when one variable does not
cause the other, they have to share a common cause –
the common cause may be unmeasured
U (religious
beliefs, culture,
lifestyle, etc.)
Alcohol Use
Smoking Heart Disease
Note on a connection between DAG
and 3 criteria approaches
60
2
6
• Lessons learned
• It may not be immediately intuitive what variables we
need to control for in our analysis
• Adjustment/stratification can introduce new sources of
association in our data
• These must be accounted for in our attempt to control
confounding
• Step by step analysis of a DAG provides a rigorous check
whether we have adequately controlled for confounding
Identifying confounding with DAGs
2
7
• Lessons learned
• Adjustment for several different sets of confounders may
each be sufficient to control confounding of the same
exposure disease relation
• Can inform study design
• Example: may be easier to measure SES than difficulty
conceiving or genetics
Identifying confounding with DAGs
2
8
Identifying confounding with DAGs
• Objection to identifying confounding using causal
relations:
– Knowledge of my problem is too limited to specify a DAG
• Response:
– Problem is inherent in your analysis – not fault of the
DAG!
• Treating a variable as a confounder makes
assumptions about causal relations, whether you
have depicted them or not
• DAGs can help you recognize the assumptions you
are making
2
9
3 Traditional criteria vs. DAGs
– What does this provide that the “three rules”
approach does not?
– Clear identification of colliders
– Sufficiency of confounder adjustment
– Usually the “three rules” approach and the DAG
approach agree, but when they do not it is the “three
rules” that fail
Example of disagreement between 3 criteria and DAGs
X: Low
education
Y: Diabetes
W: Mother
had diabetes
Z1: Family
income
during
childhood
Z2 :Mother’s
genetic
diabetes risk
• Is mother’s diabetes history a confounder of the relationship
between low education and diabetes?
Rothman ME3, Pg 188, 195
Example of disagreement between 3 criteria and DAGs
X: Low
education
Y: Diabetes
W: Mother
had diabetes
Z1: Family
income
during
childhood
Z2 :Mother’s
genetic
diabetes risk
3 traditional criteria ! We should control for W
1. W causes Y
2. W causes X
3. W is not affected by X or Y
Rothman ME3, Pg 188, 195
Example of disagreement between 3 criteria and DAGs
X: Low
education
Y: Diabetes
W: Mother
had diabetes
Z1: Family
income
during
childhood
Z2 :Mother’s
genetic
diabetes risk
DAG criteria ! We should not control for W
X ! W ! Y
1. There is one directed path from X to Y:
2. W is a collider on that path
Rothman ME3, Pg 188, 195
Example of disagreement between 3 criteria and DAGs
X: Low
education
Y: Diabetes
W: Mother
had diabetes
Z1: Family
income
during
childhood
Z2 :Mother’s
genetic
diabetes risk
Conditioning on W could lead to unintentional collider bias!
Rothman ME3, Pg 188, 195
Example of disagreement between 3 criteria and DAGs
X: Low
education
Y: Diabetes
W: Mother
had diabetes
Z1: Family
income
during
childhood
Z2 :Mother’s
genetic
diabetes risk
What are alternative sets of variables we could control for using DAG criteria?
Rothman ME3, Pg 188, 195
Example of disagreement between 3 criteria and DAGs
X: Low
education
Y: Diabetes
W: Mother
had diabetes
Z1: Family
income
during
childhood
Z2 :Mother’s
genetic
diabetes risk
Same variables different DAG ! W is a confounder under both criteria
Rothman ME3, Pg 188, 195

More Related Content

What's hot

5.2.3 dags for selection bias
5.2.3 dags for selection bias5.2.3 dags for selection bias
5.2.3 dags for selection bias
A M
 
Nested case control,
Nested case control,Nested case control,
Nested case control,
shefali jain
 
Association and Causation
Association and CausationAssociation and Causation
Association and Causation
Jayaramachandran S
 
Question study design
Question study designQuestion study design
Question study design
Anisur Rahman
 
Bias and confounding
Bias and confoundingBias and confounding
Bias and confounding
Tarek Tawfik Amin
 
Bias, confounding and causality in p'coepidemiological research
Bias, confounding and causality in p'coepidemiological researchBias, confounding and causality in p'coepidemiological research
Bias, confounding and causality in p'coepidemiological research
samthamby79
 
Introduction to meta-analysis (1612_MA_workshop)
Introduction to meta-analysis (1612_MA_workshop)Introduction to meta-analysis (1612_MA_workshop)
Introduction to meta-analysis (1612_MA_workshop)
Ahmed Negida
 
Critical Appraisal Overview
Critical Appraisal OverviewCritical Appraisal Overview
Critical Appraisal Overview
Fastbleep
 
Observational Research designs: detailed description
Observational Research designs: detailed description Observational Research designs: detailed description
Observational Research designs: detailed description
Tarek Tawfik Amin
 
Bias in epidemiological studies.pdf
Bias in  epidemiological studies.pdfBias in  epidemiological studies.pdf
Bias in epidemiological studies.pdf
cynthiamusumba
 
Survey design workshop
Survey design workshopSurvey design workshop
Survey design workshop
James Neill
 
Umbrella, Basket and Platform trials
Umbrella, Basket and Platform trialsUmbrella, Basket and Platform trials
Umbrella, Basket and Platform trials
GovindMishra61
 
Week 9 writing discussion
Week 9 writing discussionWeek 9 writing discussion
Week 9 writing discussion
Hafizul Mukhlis
 
Epidemological studies
Epidemological studies Epidemological studies
Epidemological studies
bhuvanesh4668
 
Bias and confounding
Bias and confoundingBias and confounding
Bias and confounding
Dr. Ashish singh parihar
 
Critical Appraisal
Critical Appraisal Critical Appraisal
Critical Appraisal
Argitya Righo
 
Types of bias
Types of biasTypes of bias
Types of bias
DrDiplinaBarman
 
Causal Inference PowerPoint
Causal Inference PowerPointCausal Inference PowerPoint
Causal Inference PowerPoint
emphemory
 
Introduction to scoping reviews
Introduction to scoping reviewsIntroduction to scoping reviews
Introduction to scoping reviews
Rizwan S A
 

What's hot (20)

5.2.3 dags for selection bias
5.2.3 dags for selection bias5.2.3 dags for selection bias
5.2.3 dags for selection bias
 
Nested case control,
Nested case control,Nested case control,
Nested case control,
 
Association and Causation
Association and CausationAssociation and Causation
Association and Causation
 
Question study design
Question study designQuestion study design
Question study design
 
Bias and confounding
Bias and confoundingBias and confounding
Bias and confounding
 
Variables for bn 1
Variables for bn 1Variables for bn 1
Variables for bn 1
 
Bias, confounding and causality in p'coepidemiological research
Bias, confounding and causality in p'coepidemiological researchBias, confounding and causality in p'coepidemiological research
Bias, confounding and causality in p'coepidemiological research
 
Introduction to meta-analysis (1612_MA_workshop)
Introduction to meta-analysis (1612_MA_workshop)Introduction to meta-analysis (1612_MA_workshop)
Introduction to meta-analysis (1612_MA_workshop)
 
Critical Appraisal Overview
Critical Appraisal OverviewCritical Appraisal Overview
Critical Appraisal Overview
 
Observational Research designs: detailed description
Observational Research designs: detailed description Observational Research designs: detailed description
Observational Research designs: detailed description
 
Bias in epidemiological studies.pdf
Bias in  epidemiological studies.pdfBias in  epidemiological studies.pdf
Bias in epidemiological studies.pdf
 
Survey design workshop
Survey design workshopSurvey design workshop
Survey design workshop
 
Umbrella, Basket and Platform trials
Umbrella, Basket and Platform trialsUmbrella, Basket and Platform trials
Umbrella, Basket and Platform trials
 
Week 9 writing discussion
Week 9 writing discussionWeek 9 writing discussion
Week 9 writing discussion
 
Epidemological studies
Epidemological studies Epidemological studies
Epidemological studies
 
Bias and confounding
Bias and confoundingBias and confounding
Bias and confounding
 
Critical Appraisal
Critical Appraisal Critical Appraisal
Critical Appraisal
 
Types of bias
Types of biasTypes of bias
Types of bias
 
Causal Inference PowerPoint
Causal Inference PowerPointCausal Inference PowerPoint
Causal Inference PowerPoint
 
Introduction to scoping reviews
Introduction to scoping reviewsIntroduction to scoping reviews
Introduction to scoping reviews
 

Viewers also liked

5.3.2 sufficient cause em
5.3.2 sufficient cause em5.3.2 sufficient cause em
5.3.2 sufficient cause em
A M
 
5.3.4 reporting em
5.3.4 reporting em5.3.4 reporting em
5.3.4 reporting em
A M
 
5.3.1 causal em
5.3.1 causal em5.3.1 causal em
5.3.1 causal em
A M
 
5.2.1 dags
5.2.1 dags5.2.1 dags
5.2.1 dags
A M
 
5.3.3 potential outcomes em
5.3.3 potential outcomes em5.3.3 potential outcomes em
5.3.3 potential outcomes em
A M
 
5.1.2 counterfactual framework
5.1.2 counterfactual framework5.1.2 counterfactual framework
5.1.2 counterfactual framework
A M
 
Nicholas Jewell MedicReS World Congress 2014
Nicholas Jewell MedicReS World Congress 2014Nicholas Jewell MedicReS World Congress 2014
Nicholas Jewell MedicReS World Congress 2014
MedicReS
 
5.1.3 hills criteria
5.1.3 hills criteria5.1.3 hills criteria
5.1.3 hills criteria
A M
 
5.1.1 sufficient component cause model
5.1.1 sufficient component cause model5.1.1 sufficient component cause model
5.1.1 sufficient component cause model
A M
 
4 Threats to validity from confounding bias and effect modification
4 Threats to validity from confounding bias and effect modification4 Threats to validity from confounding bias and effect modification
4 Threats to validity from confounding bias and effect modification
A M
 
5.3.5 causal inference in research
5.3.5 causal inference in research5.3.5 causal inference in research
5.3.5 causal inference in research
A M
 
Confounding and Directed Acyclic Graphs
Confounding and Directed Acyclic GraphsConfounding and Directed Acyclic Graphs
Confounding and Directed Acyclic Graphs
Darren L Dahly PhD
 
Errors and Error Measurements
Errors and Error MeasurementsErrors and Error Measurements
Errors and Error Measurements
Milind Pelagade
 
Error, confounding and bias
Error, confounding and biasError, confounding and bias
Error, confounding and bias
Amandeep Kaur
 
4.3.1. controlling confounding matching
4.3.1. controlling confounding matching4.3.1. controlling confounding matching
4.3.1. controlling confounding matching
A M
 
Bias, confounding and fallacies in epidemiology
Bias, confounding and fallacies in epidemiologyBias, confounding and fallacies in epidemiology
Bias, confounding and fallacies in epidemiologyTauseef Jawaid
 
Presentation on bias and confouinding
Presentation on bias and confouindingPresentation on bias and confouinding
Presentation on bias and confouinding
Aashish Deoju
 

Viewers also liked (19)

5.3.2 sufficient cause em
5.3.2 sufficient cause em5.3.2 sufficient cause em
5.3.2 sufficient cause em
 
5.3.4 reporting em
5.3.4 reporting em5.3.4 reporting em
5.3.4 reporting em
 
5.3.1 causal em
5.3.1 causal em5.3.1 causal em
5.3.1 causal em
 
5.2.1 dags
5.2.1 dags5.2.1 dags
5.2.1 dags
 
5.3.3 potential outcomes em
5.3.3 potential outcomes em5.3.3 potential outcomes em
5.3.3 potential outcomes em
 
5.1.2 counterfactual framework
5.1.2 counterfactual framework5.1.2 counterfactual framework
5.1.2 counterfactual framework
 
Nicholas Jewell MedicReS World Congress 2014
Nicholas Jewell MedicReS World Congress 2014Nicholas Jewell MedicReS World Congress 2014
Nicholas Jewell MedicReS World Congress 2014
 
5.1.3 hills criteria
5.1.3 hills criteria5.1.3 hills criteria
5.1.3 hills criteria
 
5.1.1 sufficient component cause model
5.1.1 sufficient component cause model5.1.1 sufficient component cause model
5.1.1 sufficient component cause model
 
4 Threats to validity from confounding bias and effect modification
4 Threats to validity from confounding bias and effect modification4 Threats to validity from confounding bias and effect modification
4 Threats to validity from confounding bias and effect modification
 
5.3.5 causal inference in research
5.3.5 causal inference in research5.3.5 causal inference in research
5.3.5 causal inference in research
 
Confounding and Directed Acyclic Graphs
Confounding and Directed Acyclic GraphsConfounding and Directed Acyclic Graphs
Confounding and Directed Acyclic Graphs
 
Bias and errors
Bias and errorsBias and errors
Bias and errors
 
Errors and Error Measurements
Errors and Error MeasurementsErrors and Error Measurements
Errors and Error Measurements
 
Error, confounding and bias
Error, confounding and biasError, confounding and bias
Error, confounding and bias
 
Errors in research
Errors in researchErrors in research
Errors in research
 
4.3.1. controlling confounding matching
4.3.1. controlling confounding matching4.3.1. controlling confounding matching
4.3.1. controlling confounding matching
 
Bias, confounding and fallacies in epidemiology
Bias, confounding and fallacies in epidemiologyBias, confounding and fallacies in epidemiology
Bias, confounding and fallacies in epidemiology
 
Presentation on bias and confouinding
Presentation on bias and confouindingPresentation on bias and confouinding
Presentation on bias and confouinding
 

More from A M

Transparency7
Transparency7Transparency7
Transparency7
A M
 
Transparency6
Transparency6Transparency6
Transparency6
A M
 
Transparency5
Transparency5Transparency5
Transparency5
A M
 
Transparency4
Transparency4Transparency4
Transparency4
A M
 
Transparency3
Transparency3Transparency3
Transparency3
A M
 
Transparency2
Transparency2Transparency2
Transparency2
A M
 
Transparency1
Transparency1Transparency1
Transparency1
A M
 
4.4. effect modification
4.4. effect modification4.4. effect modification
4.4. effect modification
A M
 
4.5. logistic regression
4.5. logistic regression4.5. logistic regression
4.5. logistic regression
A M
 
4.3.2. controlling confounding stratification
4.3.2. controlling confounding stratification4.3.2. controlling confounding stratification
4.3.2. controlling confounding stratification
A M
 
4.2.4. confounding counterfactual
4.2.4. confounding counterfactual4.2.4. confounding counterfactual
4.2.4. confounding counterfactual
A M
 
4.2.3. confounding collapsability
4.2.3. confounding collapsability4.2.3. confounding collapsability
4.2.3. confounding collapsability
A M
 
4.2.2. confounding classical approach
4.2.2. confounding classical approach4.2.2. confounding classical approach
4.2.2. confounding classical approach
A M
 
4.2.1. confounding mixing of effects
4.2.1. confounding mixing of effects4.2.1. confounding mixing of effects
4.2.1. confounding mixing of effects
A M
 
4.1. introduction
4.1. introduction4.1. introduction
4.1. introduction
A M
 
6.5 strengths and challenges
6.5 strengths and challenges6.5 strengths and challenges
6.5 strengths and challenges
A M
 
6.7 summaries
6.7 summaries6.7 summaries
6.7 summaries
A M
 
6.6 examples
6.6 examples6.6 examples
6.6 examples
A M
 

More from A M (18)

Transparency7
Transparency7Transparency7
Transparency7
 
Transparency6
Transparency6Transparency6
Transparency6
 
Transparency5
Transparency5Transparency5
Transparency5
 
Transparency4
Transparency4Transparency4
Transparency4
 
Transparency3
Transparency3Transparency3
Transparency3
 
Transparency2
Transparency2Transparency2
Transparency2
 
Transparency1
Transparency1Transparency1
Transparency1
 
4.4. effect modification
4.4. effect modification4.4. effect modification
4.4. effect modification
 
4.5. logistic regression
4.5. logistic regression4.5. logistic regression
4.5. logistic regression
 
4.3.2. controlling confounding stratification
4.3.2. controlling confounding stratification4.3.2. controlling confounding stratification
4.3.2. controlling confounding stratification
 
4.2.4. confounding counterfactual
4.2.4. confounding counterfactual4.2.4. confounding counterfactual
4.2.4. confounding counterfactual
 
4.2.3. confounding collapsability
4.2.3. confounding collapsability4.2.3. confounding collapsability
4.2.3. confounding collapsability
 
4.2.2. confounding classical approach
4.2.2. confounding classical approach4.2.2. confounding classical approach
4.2.2. confounding classical approach
 
4.2.1. confounding mixing of effects
4.2.1. confounding mixing of effects4.2.1. confounding mixing of effects
4.2.1. confounding mixing of effects
 
4.1. introduction
4.1. introduction4.1. introduction
4.1. introduction
 
6.5 strengths and challenges
6.5 strengths and challenges6.5 strengths and challenges
6.5 strengths and challenges
 
6.7 summaries
6.7 summaries6.7 summaries
6.7 summaries
 
6.6 examples
6.6 examples6.6 examples
6.6 examples
 

5.2.2 dags for confounding

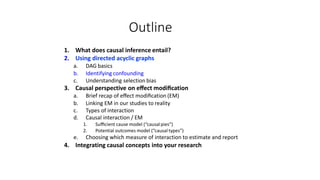
  • 1. Outline 1. What does causal inference entail? 2. Using directed acyclic graphs a. DAG basics b. Identifying confounding c. Understanding selection bias 3. Causal perspective on effect modification a. Brief recap of effect modification (EM) b. Linking EM in our studies to reality c. Types of interaction d. Causal interaction / EM 1. Sufficient cause model (“causalpies”) 2. Potential outcomes model (“causal types”) e. Choosing which measure of interaction to estimate and report 4. Integrating causal concepts into your research
  • 2. Identifying confounding using DAGs Outline 1. Review 3 traditional criteria for identifying confounding 2. DAG criteria to identify confounding 3. Stratification decisions using DAGs 4. Traditional criteria vs. DAGs
  • 3. Review: 3 criteria for confounding 1. The factor causes the outcome in the source population SES Smoking Cancer
  • 4. Review: 3 criteria for confounding 1. The factor causes the outcome in the source population 2. Factor must be associated with the exposure in the source population SES Smoking Cancer
  • 5. Review: 3 criteria for confounding 1. The factor causes the outcome in the source population 2. Factor must be associated with the exposure in the source population 3. Factor must not be caused by exposure or disease SES Cancer Smoking X X
  • 6. Smoking Smoking Cancer T ar Mutations Cancer • Absence of a directed path from X to Y implies X has no effect on Y – Directed paths not in the graph as important as those in the graph • Note: Not all intermediate steps between two variables need to be represented – Depends on level of detail of the model 6 Quick DAG assumptions reminder
  • 7. • All common causes of exposure and disease are included – Common causes that are not observed should still be included U (religious beliefs, culture, lifestyle, etc.) Alcohol Use Smoking Heart Disease Quick DAG assumptions reminder 7
  • 8. Identifying confounding with DAGs Approach 1 1) Remove all direct effects of the exposure – These are the effects of interest – In their absence, is an association still present? – This can be assessed with the next step Health behaviors Vitamins Cancer 8
  • 9. Identifying confounding with DAGs Approach 1 2) Check whether disease and exposure share a common cause (ancestor) – Does any variable connect to E and to D by following only forward pointing arrows? – If E and D have a common cause then confounding is present – A common cause will lead to an association between E and D that is not due to the effect of E on D Health behaviors Vitamins Cancer 9
  • 10. Prenatal care Difficulty conceiving SES Maternal genetics Identifying confounding with DAGs Vitamins Birth defects 1 0 Approach 1 - ‐Example – If we just adjust for prenatal care, is it sufficient to control for confounding between vitamins and birth defects?
  • 11. Prenatal care Maternal genetics Identifying confounding with DAGs Vitamins Birth defects 1 1 Approach 1 - ‐Example – Step 1: Is prenatal care caused by vitamin use or birth defects? If yes, we should not adjust for it – Do not adjust for an effect of the exposure or outcome of interest SES Difficulty conceiving
  • 12. – Step 2: Delete all non-‐ancestorsof vitamin use, birth defects, or prenatal care – If not an ancestor of vitamin use or birth defects, then cannot be a common cause – If not an ancestor of prenatal care, then new associations between exposure and disease cannot be created by adjusting for prenatal care SES Difficulty conceiving Prenatal care Maternal genetics Identifying confounding with DAGs Vitamins Birth defects 1 2 Approach 1 - ‐Example
  • 13. Prenatal care Difficulty conceiving SES Maternal genetics – Step 3: Delete all direct effects of vitamins – These are the effects of interest – In their absence, is an association still present? – If so, we still have confounding Vitamins Birth defects 1 3 Identifying confounding with DAGs Approach 1 - ‐Example
  • 14. – Step 4: Connect any two causes sharing a common effect – Adjustment for the effect will result in association of its common causes Prenatal care Difficulty conceiving SES Maternal genetics Identifying confounding with DAGs Vitamins Birth defects 1 4 Approach 1 - ‐Example
  • 15. – Step 5 : Strip arrow heads from all edges – Moving from a graph that represents causal effects to a graph that represents the associations we expect to observe under null hypothesis (as a result of both confounding and adjustment) Prenatal care Difficulty conceiving SES Maternal genetics Identifying confounding with DAGs Vitamins Birth defects 50 Approach 1 - ‐Example
  • 16. – Step 6 : Delete prenatal care – Equivalent to adjusting for prenatal care, now that we have added to the graph the new associations that will be created by adjusting Prenatal care Difficulty conceiving SES Maternal genetics Identifying confounding with DAGs Vitamins Birth defects 1 6 Approach 1 - ‐Example
  • 17. – Test: are vitamins and birth defects still connected? – Yes – adjusting for prenatal care is not sufficient to control confounding Difficulty conceiving SES Maternal genetics Identifying confounding with DAGs Vitamins Birth defects 1 7 Approach 1 - ‐Example
  • 18. Difficulty conceiving SES Maternal genetics Identifying confounding with DAGs Vitamins Birth defects 1 8 Approach 1 - ‐Example – After adjusting for prenatal care, vitamins and birth defects will still be associated even if vitamins have no causal effect on birth defects
  • 19. – What set would be sufficient to control confounding? – Prenatal care and one of SES, difficulty conceiving or maternal genetics Difficulty conceiving SES Maternal genetics Identifying confounding with DAGs Vitamins Birth defects 1 9 Approach 1 - ‐Example
  • 20. 2 0 1) No variables in C should be descendants of E or D 2) Delete all non-ancestors of {E, D, C} 3) Delete all arrows emanating from E 4) Connect any two parents with a common child 5) Strip arrowheads from all edges 6) Delete C • Test: If E is disconnected from D in the remaining graph, then adjustment for C is sufficient to remove confounding Identifying confounding with DAGs Approach 1 – Summary of Steps • Summary of steps to assess whether adjustment for a set of confounders “C” sufficient to control for confounding of the relationship between E and D
  • 21. Identifying confounding with DAGs Approach 2 X Y • Goal: block all back-door paths from X to Y • Back-door path: an undirected path from X to Y that has an arrow pointing into X Z X Y Z A back-‐doorpath is present (blue arrows) 2 1 This is a directed path, and there are no back-‐ door pathways in this DAG
  • 22. 57 1. The potential confounders are not descendants of X 2. There is no open back-door path from X to Y after controlling for them • When the back-door criterion is met, we can identify the effect of X on Y Identifying confounding with DAGs Approach 2 • Back-door criterion: X: Low education Y: Diabetes W: Mother had diabetes Z1: Family income during childhood Z2 :Mother’s genetic diabetes risk
  • 23. Prenatal care Difficulty conceiving SES Maternal genetics • Controlling for prenatal care opens a path from SES to difficulty conceiving Identifying confounding with DAGs Vitamins Birth defects 2 3 Approach 2 - ‐Example
  • 24. Prenatal care Maternal genetics • Controlling for prenatal care opens a path from SES to difficulty conceiving • Controlling for maternal genetics or difficulty conceiving closes the remaining backdoor pathway • To identify the effect of vitamins on birth defects, control for prenatal care & maternal genetics or prenatal care & difficulty conceiving SES Difficulty conceiving Identifying confounding with DAGs Vitamins Birth defects 2 4 Approach 2 - ‐Example
  • 25. • Criterion 2 states the confounder is “associated with the exposure in the source population” • For association to exist when one variable does not cause the other, they have to share a common cause – the common cause may be unmeasured U (religious beliefs, culture, lifestyle, etc.) Alcohol Use Smoking Heart Disease Note on a connection between DAG and 3 criteria approaches 60
  • 26. 2 6 • Lessons learned • It may not be immediately intuitive what variables we need to control for in our analysis • Adjustment/stratification can introduce new sources of association in our data • These must be accounted for in our attempt to control confounding • Step by step analysis of a DAG provides a rigorous check whether we have adequately controlled for confounding Identifying confounding with DAGs
  • 27. 2 7 • Lessons learned • Adjustment for several different sets of confounders may each be sufficient to control confounding of the same exposure disease relation • Can inform study design • Example: may be easier to measure SES than difficulty conceiving or genetics Identifying confounding with DAGs
  • 28. 2 8 Identifying confounding with DAGs • Objection to identifying confounding using causal relations: – Knowledge of my problem is too limited to specify a DAG • Response: – Problem is inherent in your analysis – not fault of the DAG! • Treating a variable as a confounder makes assumptions about causal relations, whether you have depicted them or not • DAGs can help you recognize the assumptions you are making
  • 29. 2 9 3 Traditional criteria vs. DAGs – What does this provide that the “three rules” approach does not? – Clear identification of colliders – Sufficiency of confounder adjustment – Usually the “three rules” approach and the DAG approach agree, but when they do not it is the “three rules” that fail
  • 30. Example of disagreement between 3 criteria and DAGs X: Low education Y: Diabetes W: Mother had diabetes Z1: Family income during childhood Z2 :Mother’s genetic diabetes risk • Is mother’s diabetes history a confounder of the relationship between low education and diabetes? Rothman ME3, Pg 188, 195
  • 31. Example of disagreement between 3 criteria and DAGs X: Low education Y: Diabetes W: Mother had diabetes Z1: Family income during childhood Z2 :Mother’s genetic diabetes risk 3 traditional criteria ! We should control for W 1. W causes Y 2. W causes X 3. W is not affected by X or Y Rothman ME3, Pg 188, 195
  • 32. Example of disagreement between 3 criteria and DAGs X: Low education Y: Diabetes W: Mother had diabetes Z1: Family income during childhood Z2 :Mother’s genetic diabetes risk DAG criteria ! We should not control for W X ! W ! Y 1. There is one directed path from X to Y: 2. W is a collider on that path Rothman ME3, Pg 188, 195
  • 33. Example of disagreement between 3 criteria and DAGs X: Low education Y: Diabetes W: Mother had diabetes Z1: Family income during childhood Z2 :Mother’s genetic diabetes risk Conditioning on W could lead to unintentional collider bias! Rothman ME3, Pg 188, 195
  • 34. Example of disagreement between 3 criteria and DAGs X: Low education Y: Diabetes W: Mother had diabetes Z1: Family income during childhood Z2 :Mother’s genetic diabetes risk What are alternative sets of variables we could control for using DAG criteria? Rothman ME3, Pg 188, 195
  • 35. Example of disagreement between 3 criteria and DAGs X: Low education Y: Diabetes W: Mother had diabetes Z1: Family income during childhood Z2 :Mother’s genetic diabetes risk Same variables different DAG ! W is a confounder under both criteria Rothman ME3, Pg 188, 195