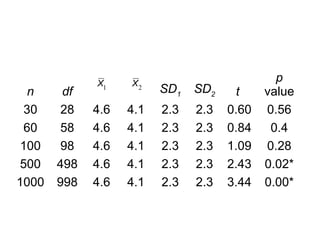
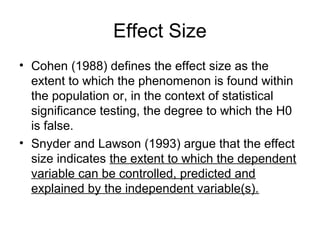
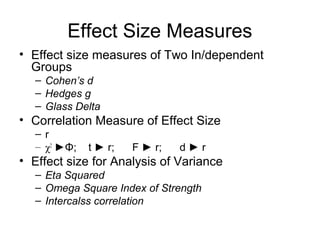
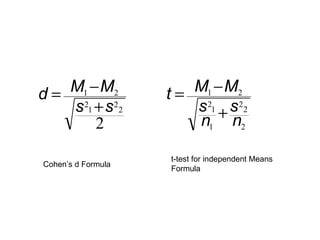
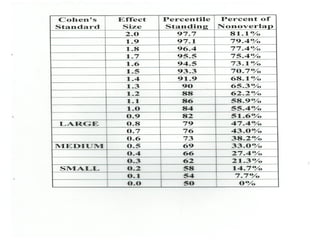
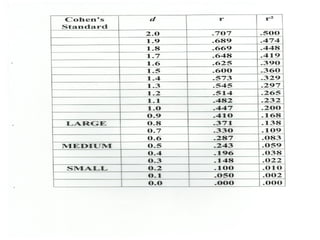
Calculating Effect Size
Comparison of Two Means
1
X 2
X
n df SD1
SD2 t
p
value
30 28 4.6 4.1 2.3 2.3 0.60 0.56
60 58 4.6 4.1 2.3 2.3 0.84 0.4
100 98 4.6 4.1 2.3 2.3 1.09 0.28
500 498 4.6 4.1 2.3 2.3 2.43 0.02*
1000 998 4.6 4.1 2.3 2.3 3.44 0.00*
Criticism on NHST
• 1. NHST does not provide the information which the
researcher wants to obtain
• 2. Logical problems derived from the probabilistic
nature of NHST.
• 3. NHST does not enable psychological theories to
be tested.
• 4. The fallacy of replication.
• 5. NHST fails to provide useful information because
H0 is always false.
• 6. Problems associated with the dichotomous
decision to reject/not reject the H0.
• 7. NHST impedes the advance of knowledge.
Effect Size
• Cohen (1988) defines the effect size as the
extent to which the phenomenon is found within
the population or, in the context of statistical
significance testing, the degree to which the H0
is false.
• Snyder and Lawson (1993) argue that the effect
size indicates the extent to which the dependent
variable can be controlled, predicted and
explained by the independent variable(s).
Effect Size Measures
• Effect size measures of Two In/dependent
Groups
– Cohen’s d
– Hedges g
– Glass Delta
• Correlation Measure of Effect Size
– r
– χ2
►Φ; t ► r; F ► r; d ► r
• Effect size for Analysis of Variance
– Eta Squared
– Omega Square Index of Strength
– Intercalss correlation
2
2
2
1
2
21
ss
MMd
+
−=
2
2
2
1
1
2
21
n
s
n
s
MMt
+
−=
Cohen’s d Formula
t-test for independent Means
Formula
Computation
A research compared first year public and
private school students in their study
habits. Study habits was measured using
the Survey of Study Habits. The t-test for
two independent samples was used to
determine the significant difference
between the students in the public and
private school in the four factors of study
habits. The following statistical output
was obtained:
Effect size presentation revised

Effect size presentation revised

  • 1.
  • 2.
    1 X 2 X n dfSD1 SD2 t p value 30 28 4.6 4.1 2.3 2.3 0.60 0.56 60 58 4.6 4.1 2.3 2.3 0.84 0.4 100 98 4.6 4.1 2.3 2.3 1.09 0.28 500 498 4.6 4.1 2.3 2.3 2.43 0.02* 1000 998 4.6 4.1 2.3 2.3 3.44 0.00*
  • 3.
    Criticism on NHST •1. NHST does not provide the information which the researcher wants to obtain • 2. Logical problems derived from the probabilistic nature of NHST. • 3. NHST does not enable psychological theories to be tested. • 4. The fallacy of replication. • 5. NHST fails to provide useful information because H0 is always false. • 6. Problems associated with the dichotomous decision to reject/not reject the H0. • 7. NHST impedes the advance of knowledge.
  • 4.
    Effect Size • Cohen(1988) defines the effect size as the extent to which the phenomenon is found within the population or, in the context of statistical significance testing, the degree to which the H0 is false. • Snyder and Lawson (1993) argue that the effect size indicates the extent to which the dependent variable can be controlled, predicted and explained by the independent variable(s).
  • 5.
    Effect Size Measures •Effect size measures of Two In/dependent Groups – Cohen’s d – Hedges g – Glass Delta • Correlation Measure of Effect Size – r – χ2 ►Φ; t ► r; F ► r; d ► r • Effect size for Analysis of Variance – Eta Squared – Omega Square Index of Strength – Intercalss correlation
  • 6.
  • 7.
    Computation A research comparedfirst year public and private school students in their study habits. Study habits was measured using the Survey of Study Habits. The t-test for two independent samples was used to determine the significant difference between the students in the public and private school in the four factors of study habits. The following statistical output was obtained: