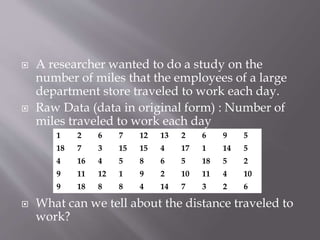
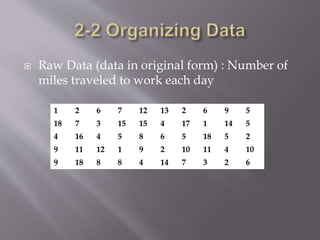
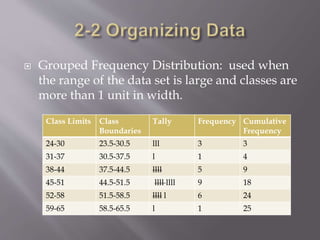
2-1 Introduction
2-2 Organizing Data
 A researcher wanted to do a study on the
number of miles that the employees of a large
department store traveled to work each day.
 Raw Data (data in original form) : Number of
miles traveled to work each day
 What can we tell about the distance traveled to
work?
1 2 6 7 12 13 2 6 9 5
18 7 3 15 15 4 17 1 14 5
4 16 4 5 8 6 5 18 5 2
9 11 12 1 9 2 10 11 4 10
9 18 8 8 4 14 7 3 2 6
 To describe situations, draw conclusions, or
make inferences about events, researchers must
ORGANIZE their data in some meaningful
way.
 Objective: To organize data using frequency
distributions.
 Suppose a researcher wanted to do a study on
the number of miles that the employees of a
large store traveled to work each day.
 Raw Data (data in original form) : Number of
miles traveled to work each day
1 2 6 7 12 13 2 6 9 5
18 7 3 15 15 4 17 1 14 5
4 16 4 5 8 6 5 18 5 2
9 11 12 1 9 2 10 11 4 10
9 18 8 8 4 14 7 3 2 6
 Little information can be drawn from the raw
data, so we organize using a frequency
distribution chart.
 Frequency Distribution Chart: The
organization of raw data in table form, using
classes and frequencies.
 Class: Category of numbers
 Frequency: Number of data values contained in
a specific class.
 Categorical Frequency Distribution: Used for
data that can be placed in specific categories
(nominal or ordinal level)
 Grouped Frequency Distribution: used when
the range of the data set is large and classes are
more than 1 unit in width.
 Ungrouped Frequency Distribution: Used
when the range of data is small. Each class
consists of a single data point.
 Grouped Frequency Distribution: used when
the range of the data set is large and classes are
more than 1 unit in width.
Class Limits Class
Boundaries
Tally Frequency Cumulative
Frequency
24-30 23.5-30.5 lll 3 3
31-37 30.5-37.5 l 1 4
38-44 37.5-44.5 llll 5 9
45-51 44.5-51.5 llll llll 9 18
52-58 51.5-58.5 llll l 6 24
59-65 58.5-65.5 l 1 25
 Lower Class Limit: smallest data value that
can be included in a class.
 Upper Class Limit: largest data value that can
be included in a class.
 Class Boundaries: Numbers that are used to
separate the classes so that there are no gaps in
the frequency distribution.
 Class Width: Upper Class Limit minus Lower
Class Limit
 Class Limits: same decimal place value as data
 Class Boundaries: One additional place value
than data and should end in 5
1. Use 5-20 classes.
2. Use odd-numbered class widths (ensures mid-
point of data has same place value as data)
• Class Midpoint: xm = (lower boundary/limit + upper
boundary/limit)/2
• This is only a suggestion, not rigorously followed.
3. Classes must be mutually exclusive (so that data
can’t be in two groups at one time.
4. Classes must be continuous (no gaps)
5. Classes must be exhaustive (enough to include all
data)
6. Classes must be equal in width (avoids distorted
view of data).
1. Determine the classes
1. Find the highest and lowest value.
2. Find the range.
3. Select the number of classes desired.
4. Find the width by dividing the range by the number
of classes and rounding up.
5. Select a starting point (usually the lowest value or
any convenient number less than the lowest value);
add the width to get to the lower limits.
6. Find the upper class limits.
7. Find the boundaries.
2. Tally the data.
3. Find the numerical frequencies from the
tallies.
4. Find the cumulative frequencies.
1. Organize data in meaningful, intelligible way
2. Enable reader to determine nature or shape of
distribution
3. Facilitate computational procedures for
measures of average and spread
4. Enable researcher to draw charts and graphs
for presentation of data
5. Enable reader to make comparisons among
different sets of data.
 pp 43-45 # 2-7, 9, 15, 19

2.1-2.2 Organizing Data

  • 1.
  • 2.
     A researcherwanted to do a study on the number of miles that the employees of a large department store traveled to work each day.  Raw Data (data in original form) : Number of miles traveled to work each day  What can we tell about the distance traveled to work? 1 2 6 7 12 13 2 6 9 5 18 7 3 15 15 4 17 1 14 5 4 16 4 5 8 6 5 18 5 2 9 11 12 1 9 2 10 11 4 10 9 18 8 8 4 14 7 3 2 6
  • 3.
     To describesituations, draw conclusions, or make inferences about events, researchers must ORGANIZE their data in some meaningful way.
  • 4.
     Objective: Toorganize data using frequency distributions.
  • 5.
     Suppose aresearcher wanted to do a study on the number of miles that the employees of a large store traveled to work each day.
  • 6.
     Raw Data(data in original form) : Number of miles traveled to work each day 1 2 6 7 12 13 2 6 9 5 18 7 3 15 15 4 17 1 14 5 4 16 4 5 8 6 5 18 5 2 9 11 12 1 9 2 10 11 4 10 9 18 8 8 4 14 7 3 2 6
  • 7.
     Little informationcan be drawn from the raw data, so we organize using a frequency distribution chart.  Frequency Distribution Chart: The organization of raw data in table form, using classes and frequencies.  Class: Category of numbers  Frequency: Number of data values contained in a specific class.
  • 8.
     Categorical FrequencyDistribution: Used for data that can be placed in specific categories (nominal or ordinal level)  Grouped Frequency Distribution: used when the range of the data set is large and classes are more than 1 unit in width.  Ungrouped Frequency Distribution: Used when the range of data is small. Each class consists of a single data point.
  • 9.
     Grouped FrequencyDistribution: used when the range of the data set is large and classes are more than 1 unit in width. Class Limits Class Boundaries Tally Frequency Cumulative Frequency 24-30 23.5-30.5 lll 3 3 31-37 30.5-37.5 l 1 4 38-44 37.5-44.5 llll 5 9 45-51 44.5-51.5 llll llll 9 18 52-58 51.5-58.5 llll l 6 24 59-65 58.5-65.5 l 1 25
  • 10.
     Lower ClassLimit: smallest data value that can be included in a class.  Upper Class Limit: largest data value that can be included in a class.  Class Boundaries: Numbers that are used to separate the classes so that there are no gaps in the frequency distribution.  Class Width: Upper Class Limit minus Lower Class Limit
  • 11.
     Class Limits:same decimal place value as data  Class Boundaries: One additional place value than data and should end in 5
  • 12.
    1. Use 5-20classes. 2. Use odd-numbered class widths (ensures mid- point of data has same place value as data) • Class Midpoint: xm = (lower boundary/limit + upper boundary/limit)/2 • This is only a suggestion, not rigorously followed. 3. Classes must be mutually exclusive (so that data can’t be in two groups at one time. 4. Classes must be continuous (no gaps) 5. Classes must be exhaustive (enough to include all data) 6. Classes must be equal in width (avoids distorted view of data).
  • 13.
    1. Determine theclasses 1. Find the highest and lowest value. 2. Find the range. 3. Select the number of classes desired. 4. Find the width by dividing the range by the number of classes and rounding up. 5. Select a starting point (usually the lowest value or any convenient number less than the lowest value); add the width to get to the lower limits. 6. Find the upper class limits. 7. Find the boundaries.
  • 14.
    2. Tally thedata. 3. Find the numerical frequencies from the tallies. 4. Find the cumulative frequencies.
  • 15.
    1. Organize datain meaningful, intelligible way 2. Enable reader to determine nature or shape of distribution 3. Facilitate computational procedures for measures of average and spread 4. Enable researcher to draw charts and graphs for presentation of data 5. Enable reader to make comparisons among different sets of data.
  • 16.
     pp 43-45# 2-7, 9, 15, 19