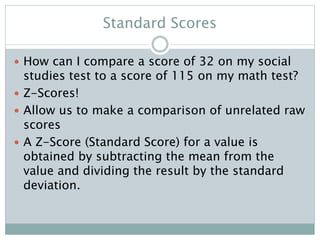
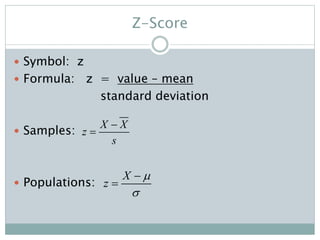
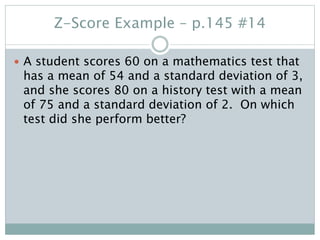
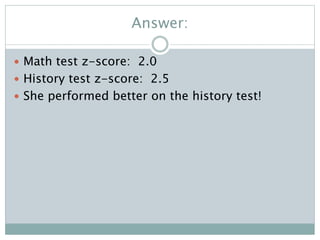
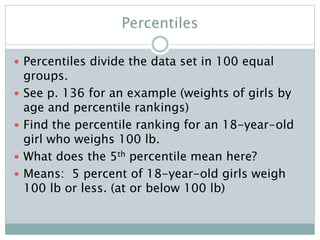
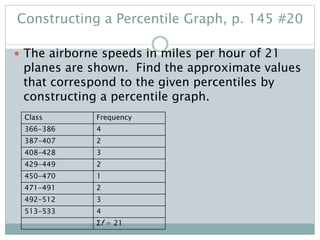
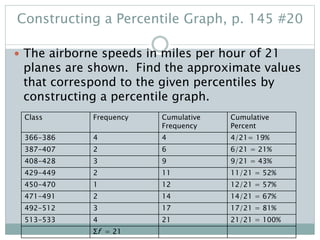
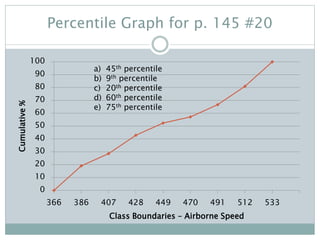
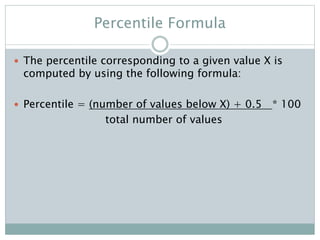
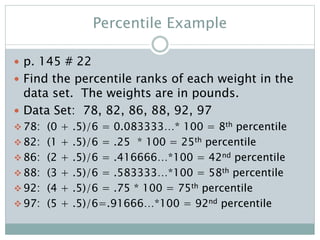
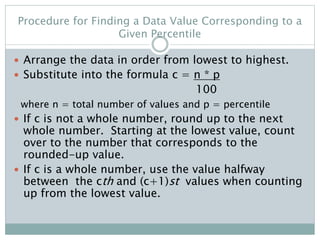
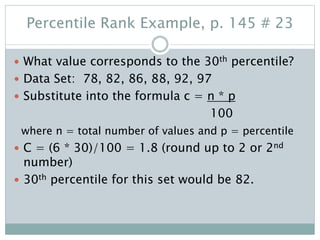
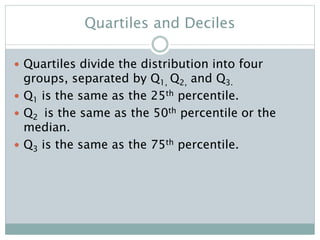
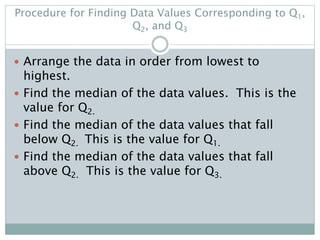
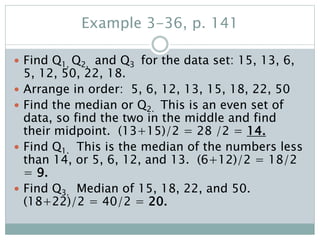
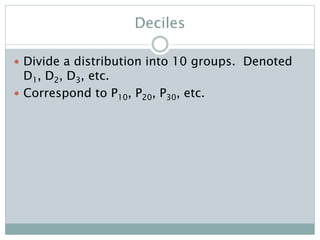
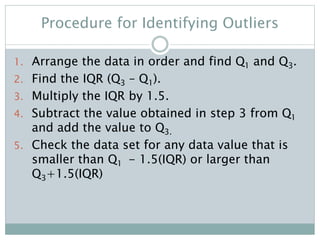
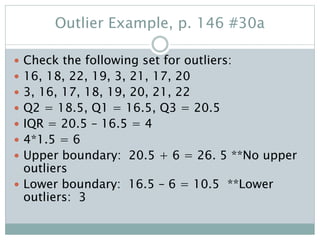
S E C T I O N 3 - 4
Measures of Position
Objective
 To identify the position of a data value in a
data set, using various measures of position,
such as percentiles, deciles, and quartiles.
Percentile Example
 If a data value is located at the 80th percentile,
it means that 80% of the values fall below it in
the distribution and 20% fall above it.
Standard Scores
 How can I compare a score of 32 on my social
studies test to a score of 115 on my math test?
 Z-Scores!
 Allow us to make a comparison of unrelated raw
scores
 A Z-Score (Standard Score) for a value is
obtained by subtracting the mean from the
value and dividing the result by the standard
deviation.
Z-Score
 Symbol: z
 Formula: z = value – mean
standard deviation
 Samples:
 Populations:
X X
z
s


X
z




Z-Score Example – p.145 #14
 A student scores 60 on a mathematics test that
has a mean of 54 and a standard deviation of 3,
and she scores 80 on a history test with a mean
of 75 and a standard deviation of 2. On which
test did she perform better?
Answer:
 Math test z-score: 2.0
 History test z-score: 2.5
 She performed better on the history test!
Important Point
 When all data for a variable are transformed
into z-scores, the resulting distribution will
have a mean of 0 and a standard deviation of 1.
 A z-score, then, is actually the number of
standard deviations each value is from the
mean for a specific distribution.
Percentiles
 Percentiles divide the data set in 100 equal
groups.
 See p. 136 for an example (weights of girls by
age and percentile rankings)
 Find the percentile ranking for an 18-year-old
girl who weighs 100 lb.
 What does the 5th percentile mean here?
 Means: 5 percent of 18-year-old girls weigh
100 lb or less. (at or below 100 lb)
Constructing a Percentile Graph, p. 145 #20
 The airborne speeds in miles per hour of 21
planes are shown. Find the approximate values
that correspond to the given percentiles by
constructing a percentile graph.
Class Frequency
366-386 4
387-407 2
408-428 3
429-449 2
450-470 1
471-491 2
492-512 3
513-533 4
Σf = 21
Constructing a Percentile Graph, p. 145 #20
 The airborne speeds in miles per hour of 21
planes are shown. Find the approximate values
that correspond to the given percentiles by
constructing a percentile graph.
Class Frequency Cumulative
Frequency
Cumulative
Percent
366-386 4 4 4/21= 19%
387-407 2 6 6/21 = 21%
408-428 3 9 9/21 = 43%
429-449 2 11 11/21 = 52%
450-470 1 12 12/21 = 57%
471-491 2 14 14/21 = 67%
492-512 3 17 17/21 = 81%
513-533 4 21 21/21 = 100%
Σf = 21
Percentile Graph for p. 145 #20
0
10
20
30
40
50
60
70
80
90
100
366 386 407 428 449 470 491 512 533
Cumulative%
Class Boundaries – Airborne Speed
a) 45th percentile
b) 9th percentile
c) 20th percentile
d) 60th percentile
e) 75th percentile
Percentile Formula
 The percentile corresponding to a given value X is
computed by using the following formula:
 Percentile = (number of values below X) + 0.5 * 100
total number of values
Percentile Example
 p. 145 # 22
 Find the percentile ranks of each weight in the
data set. The weights are in pounds.
 Data Set: 78, 82, 86, 88, 92, 97
 78: (0 + .5)/6 = 0.083333…* 100 = 8th percentile
 82: (1 + .5)/6 = .25 * 100 = 25th percentile
 86: (2 + .5)/6 = .416666…*100 = 42nd percentile
 88: (3 + .5)/6 = .583333…*100 = 58th percentile
 92: (4 + .5)/6 = .75 * 100 = 75th percentile
 97: (5 + .5)/6=.91666…*100 = 92nd percentile
Procedure for Finding a Data Value Corresponding to a
Given Percentile
 Arrange the data in order from lowest to highest.
 Substitute into the formula c = n * p
100
where n = total number of values and p = percentile
 If c is not a whole number, round up to the next
whole number. Starting at the lowest value, count
over to the number that corresponds to the
rounded-up value.
 If c is a whole number, use the value halfway
between the cth and (c+1)st values when counting
up from the lowest value.
Percentile Rank Example, p. 145 # 23
 What value corresponds to the 30th percentile?
 Data Set: 78, 82, 86, 88, 92, 97
 Substitute into the formula c = n * p
100
where n = total number of values and p = percentile
 C = (6 * 30)/100 = 1.8 (round up to 2 or 2nd
number)
 30th percentile for this set would be 82.
Quartiles and Deciles
 Quartiles divide the distribution into four
groups, separated by Q1, Q2, and Q3.
 Q1 is the same as the 25th percentile.
 Q2 is the same as the 50th percentile or the
median.
 Q3 is the same as the 75th percentile.
Procedure for Finding Data Values Corresponding to Q1,
Q2, and Q3
 Arrange the data in order from lowest to
highest.
 Find the median of the data values. This is the
value for Q2.
 Find the median of the data values that fall
below Q2. This is the value for Q1.
 Find the median of the data values that fall
above Q2. This is the value for Q3.
Example 3-36, p. 141
 Find Q1, Q2, and Q3 for the data set: 15, 13, 6,
5, 12, 50, 22, 18.
 Arrange in order: 5, 6, 12, 13, 15, 18, 22, 50
 Find the median or Q2. This is an even set of
data, so find the two in the middle and find
their midpoint. (13+15)/2 = 28 /2 = 14.
 Find Q1. This is the median of the numbers less
than 14, or 5, 6, 12, and 13. (6+12)/2 = 18/2
= 9.
 Find Q3. Median of 15, 18, 22, and 50.
(18+22)/2 = 40/2 = 20.
Interquartile Range (IQR)
 The difference between Q1 and Q3 (Q3 - Q1).
 Used to identify outliers.
 Used as a measure of variability in exploratory
analysis.
Deciles
 Divide a distribution into 10 groups. Denoted
D1, D2, D3, etc.
 Correspond to P10, P20, P30, etc.
Outliers
 Outliers are extremely high or low values.
 Can strongly affect the mean and standard
deviation of a variable.
Procedure for Identifying Outliers
1. Arrange the data in order and find Q1 and Q3.
2. Find the IQR (Q3 – Q1).
3. Multiply the IQR by 1.5.
4. Subtract the value obtained in step 3 from Q1
and add the value to Q3.
5. Check the data set for any data value that is
smaller than Q1 - 1.5(IQR) or larger than
Q3+1.5(IQR)
Outlier Example, p. 146 #30a
 Check the following set for outliers:
 16, 18, 22, 19, 3, 21, 17, 20
 3, 16, 17, 18, 19, 20, 21, 22
 Q2 = 18.5, Q1 = 16.5, Q3 = 20.5
 IQR = 20.5 – 16.5 = 4
 4*1.5 = 6
 Upper boundary: 20.5 + 6 = 26. 5 **No upper
outliers
 Lower boundary: 16.5 – 6 = 10.5 **Lower
outliers: 3
Assignment:
 p.144-146, #1-9, 11-15 odd, 24, 30 b,d,e, and
31

3.4 Measures of Position

  • 1.
    S E CT I O N 3 - 4 Measures of Position
  • 2.
    Objective  To identifythe position of a data value in a data set, using various measures of position, such as percentiles, deciles, and quartiles.
  • 3.
    Percentile Example  Ifa data value is located at the 80th percentile, it means that 80% of the values fall below it in the distribution and 20% fall above it.
  • 4.
    Standard Scores  Howcan I compare a score of 32 on my social studies test to a score of 115 on my math test?  Z-Scores!  Allow us to make a comparison of unrelated raw scores  A Z-Score (Standard Score) for a value is obtained by subtracting the mean from the value and dividing the result by the standard deviation.
  • 5.
    Z-Score  Symbol: z Formula: z = value – mean standard deviation  Samples:  Populations: X X z s   X z    
  • 6.
    Z-Score Example –p.145 #14  A student scores 60 on a mathematics test that has a mean of 54 and a standard deviation of 3, and she scores 80 on a history test with a mean of 75 and a standard deviation of 2. On which test did she perform better?
  • 7.
    Answer:  Math testz-score: 2.0  History test z-score: 2.5  She performed better on the history test!
  • 8.
    Important Point  Whenall data for a variable are transformed into z-scores, the resulting distribution will have a mean of 0 and a standard deviation of 1.  A z-score, then, is actually the number of standard deviations each value is from the mean for a specific distribution.
  • 9.
    Percentiles  Percentiles dividethe data set in 100 equal groups.  See p. 136 for an example (weights of girls by age and percentile rankings)  Find the percentile ranking for an 18-year-old girl who weighs 100 lb.  What does the 5th percentile mean here?  Means: 5 percent of 18-year-old girls weigh 100 lb or less. (at or below 100 lb)
  • 10.
    Constructing a PercentileGraph, p. 145 #20  The airborne speeds in miles per hour of 21 planes are shown. Find the approximate values that correspond to the given percentiles by constructing a percentile graph. Class Frequency 366-386 4 387-407 2 408-428 3 429-449 2 450-470 1 471-491 2 492-512 3 513-533 4 Σf = 21
  • 11.
    Constructing a PercentileGraph, p. 145 #20  The airborne speeds in miles per hour of 21 planes are shown. Find the approximate values that correspond to the given percentiles by constructing a percentile graph. Class Frequency Cumulative Frequency Cumulative Percent 366-386 4 4 4/21= 19% 387-407 2 6 6/21 = 21% 408-428 3 9 9/21 = 43% 429-449 2 11 11/21 = 52% 450-470 1 12 12/21 = 57% 471-491 2 14 14/21 = 67% 492-512 3 17 17/21 = 81% 513-533 4 21 21/21 = 100% Σf = 21
  • 12.
    Percentile Graph forp. 145 #20 0 10 20 30 40 50 60 70 80 90 100 366 386 407 428 449 470 491 512 533 Cumulative% Class Boundaries – Airborne Speed a) 45th percentile b) 9th percentile c) 20th percentile d) 60th percentile e) 75th percentile
  • 13.
    Percentile Formula  Thepercentile corresponding to a given value X is computed by using the following formula:  Percentile = (number of values below X) + 0.5 * 100 total number of values
  • 14.
    Percentile Example  p.145 # 22  Find the percentile ranks of each weight in the data set. The weights are in pounds.  Data Set: 78, 82, 86, 88, 92, 97  78: (0 + .5)/6 = 0.083333…* 100 = 8th percentile  82: (1 + .5)/6 = .25 * 100 = 25th percentile  86: (2 + .5)/6 = .416666…*100 = 42nd percentile  88: (3 + .5)/6 = .583333…*100 = 58th percentile  92: (4 + .5)/6 = .75 * 100 = 75th percentile  97: (5 + .5)/6=.91666…*100 = 92nd percentile
  • 15.
    Procedure for Findinga Data Value Corresponding to a Given Percentile  Arrange the data in order from lowest to highest.  Substitute into the formula c = n * p 100 where n = total number of values and p = percentile  If c is not a whole number, round up to the next whole number. Starting at the lowest value, count over to the number that corresponds to the rounded-up value.  If c is a whole number, use the value halfway between the cth and (c+1)st values when counting up from the lowest value.
  • 16.
    Percentile Rank Example,p. 145 # 23  What value corresponds to the 30th percentile?  Data Set: 78, 82, 86, 88, 92, 97  Substitute into the formula c = n * p 100 where n = total number of values and p = percentile  C = (6 * 30)/100 = 1.8 (round up to 2 or 2nd number)  30th percentile for this set would be 82.
  • 17.
    Quartiles and Deciles Quartiles divide the distribution into four groups, separated by Q1, Q2, and Q3.  Q1 is the same as the 25th percentile.  Q2 is the same as the 50th percentile or the median.  Q3 is the same as the 75th percentile.
  • 18.
    Procedure for FindingData Values Corresponding to Q1, Q2, and Q3  Arrange the data in order from lowest to highest.  Find the median of the data values. This is the value for Q2.  Find the median of the data values that fall below Q2. This is the value for Q1.  Find the median of the data values that fall above Q2. This is the value for Q3.
  • 19.
    Example 3-36, p.141  Find Q1, Q2, and Q3 for the data set: 15, 13, 6, 5, 12, 50, 22, 18.  Arrange in order: 5, 6, 12, 13, 15, 18, 22, 50  Find the median or Q2. This is an even set of data, so find the two in the middle and find their midpoint. (13+15)/2 = 28 /2 = 14.  Find Q1. This is the median of the numbers less than 14, or 5, 6, 12, and 13. (6+12)/2 = 18/2 = 9.  Find Q3. Median of 15, 18, 22, and 50. (18+22)/2 = 40/2 = 20.
  • 20.
    Interquartile Range (IQR) The difference between Q1 and Q3 (Q3 - Q1).  Used to identify outliers.  Used as a measure of variability in exploratory analysis.
  • 21.
    Deciles  Divide adistribution into 10 groups. Denoted D1, D2, D3, etc.  Correspond to P10, P20, P30, etc.
  • 22.
    Outliers  Outliers areextremely high or low values.  Can strongly affect the mean and standard deviation of a variable.
  • 23.
    Procedure for IdentifyingOutliers 1. Arrange the data in order and find Q1 and Q3. 2. Find the IQR (Q3 – Q1). 3. Multiply the IQR by 1.5. 4. Subtract the value obtained in step 3 from Q1 and add the value to Q3. 5. Check the data set for any data value that is smaller than Q1 - 1.5(IQR) or larger than Q3+1.5(IQR)
  • 24.
    Outlier Example, p.146 #30a  Check the following set for outliers:  16, 18, 22, 19, 3, 21, 17, 20  3, 16, 17, 18, 19, 20, 21, 22  Q2 = 18.5, Q1 = 16.5, Q3 = 20.5  IQR = 20.5 – 16.5 = 4  4*1.5 = 6  Upper boundary: 20.5 + 6 = 26. 5 **No upper outliers  Lower boundary: 16.5 – 6 = 10.5 **Lower outliers: 3
  • 25.
    Assignment:  p.144-146, #1-9,11-15 odd, 24, 30 b,d,e, and 31