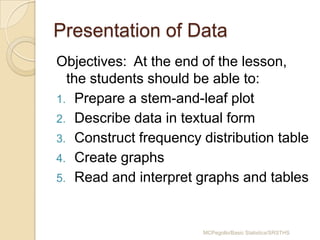
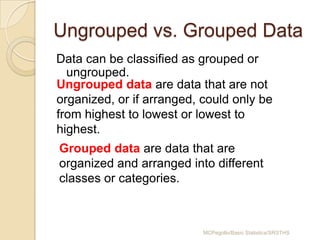
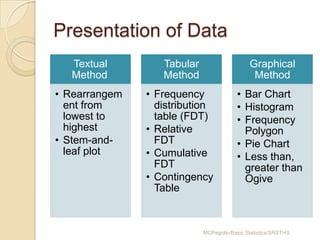
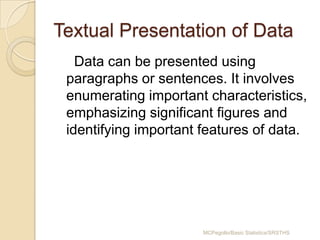
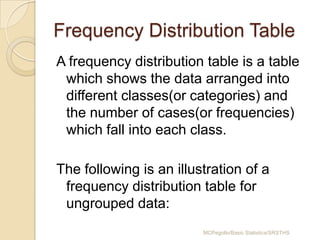
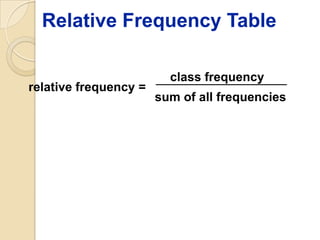
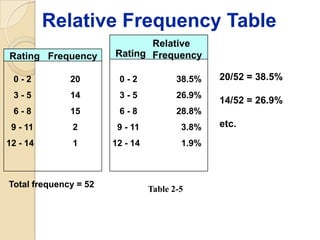
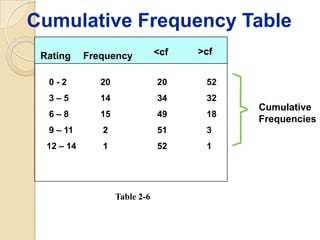
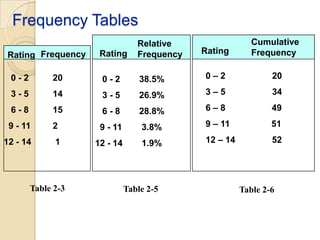
Presentation of Data
Module 6
Basic Statistics
SRSTHS
Ms. Pegollo
Presentation of Data
Objectives: At the end of the lesson,
the students should be able to:
1. Prepare a stem-and-leaf plot
2. Describe data in textual form
3. Construct frequency distribution table
4. Create graphs
5. Read and interpret graphs and tables

MCPegollo/Basic Statistics/SRSTHS
Ungrouped vs. Grouped Data
Data can be classified as grouped or
ungrouped.
Ungrouped data are data that are not
organized, or if arranged, could only be
from highest to lowest or lowest to
highest.
Grouped data are data that are
organized and arranged into different
classes or categories.

MCPegollo/Basic Statistics/SRSTHS
Presentation of Data
Textual
Method

Tabular
Method

Graphical
Method

• Rearrangem
ent from
lowest to
highest
• Stem-andleaf plot

• Frequency
distribution
table (FDT)
• Relative
FDT
• Cumulative
FDT
• Contingency
Table

• Bar Chart
• Histogram
• Frequency
Polygon
• Pie Chart
• Less than,
greater than
Ogive

MCPegollo/Basic Statistics/SRSTHS
Textual Presentation of Data
Data can be presented using
paragraphs or sentences. It involves
enumerating important characteristics,
emphasizing significant figures and
identifying important features of data.

MCPegollo/Basic Statistics/SRSTHS
Textual Presentation of Data
Example. You are asked to present the
performance of your section in the
Statistics test. The following are the
test scores of your class:
34

42

20

50

17

9

34

43

50

18

35

43

50

23

23

35

37

38

38

39

39

38

38

39

24

29

25

26

28

27

44

44

49

48

46

45

45

46

45

46

MCPegollo/Basic Statistics/SRSTHS
Solution
First, arrange the data in order for you to
identify the important characteristics. This
can be done in two ways: rearranging from
lowest to highest or using the stem-and-leaf
plot.
Below is the rearrangement of data from lowest
to highest:
9

23

28

35

38

43

45

48

17

24

29

37

39

43

45

49

18

25

34

38

39

44

46

50

20

26

34

38

39

44

46

50

23

27

35

38

42

45

46

50

MCPegollo/Basic Statistics/SRSTHS
With the rearranged data, pertinent data
worth mentioning can be easily
recognized. The following is one way
of presenting data in textual form.
In the Statistics class of 40
students, 3 obtained the perfect score
of 50. Sixteen students got a score of
40 and above, while only 3 got 19 and
below. Generally, the students
performed well in the test with 23 or
70% getting a passing score of 38 and
MCPegollo/Basic Statistics/SRSTHS
Another way of rearranging data is by
making use of the stem-and-leaf plot.
What is a stem-and-leaf plot?
Stem-and-leaf Plot is a table which
sorts data according to a certain pattern. It
involves separating a number into two parts.
In a two-digit number, the stem consists of
the first digit, and the leaf consists of the
second digit. While in a three-digit number,
the stem consists of the first two digits, and
the leaf consists of the last digit. In a onedigit number, the stem is zero.
MCPegollo/Basic Statistics/SRSTHS
Below is the stem-and-leaf plot of the
ungrouped data given in the example.
Stem

Leaves

0

9

1

7,8

2

0,3,3,4,5,6,7,8,9

3

4,4,5,5,7,8,8,8,8,9,9,9

4

2,3,3,4,4,5,5,5,6,6,6,8,9

5

0,0,0

Utilizing the stem-and-leaf plot, we can readily see the
order of the data. Thus, we can say that the top ten
got scores 50, 50, 50, 49, 48, 46, 46, 46,45, and 45
and the ten lowest scores are 9, 17, 18, 20,
MCPegollo/Basic Statistics/SRSTHS
23,23,24,25,26, and 27.
Exercise:
Prepare a stem-and-leaf plot and
present in textual form.
Stem
The ages Leaf teachers in a public
of 40
school
23

2 3,6,7,8,8,9
27
28
36

32

42 0,1,2,4,4,5,5,5,6,6,6,6,8,8,8,8,9,9
3 44
54
56
48
55
48

30

31
35
36
47
48
4 0,0,0,2,3,4,4,5,5,7,8,8,8
26
28
29
45
34
5 4,5,6
38
39
38
36
35

34
36

35

38

39

40

43

38

45

44

40

40

MCPegollo/Basic Statistics/SRSTHS
Tabular Presentation of Data
Below is a sample of a table with all of its parts
indicated:
Table Number
Table Title
Column Header

Row Classifier
Body

Source Note
http://www.sws.org.ph/youth.htm
MCPegollo/Basic Statistics/SRSTHS
Frequency Distribution Table
A frequency distribution table is a table
which shows the data arranged into
different classes(or categories) and
the number of cases(or frequencies)
which fall into each class.
The following is an illustration of a
frequency distribution table for
ungrouped data:
MCPegollo/Basic Statistics/SRSTHS
Sample of a Frequency Distribution
Table for Ungrouped Data
Table 1.1
Frequency Distribution for the Ages of 50
Students Enrolled in Statistics
Age

Frequency

12

2

13

13

14

27

15

4

16

3

17

1
N = 50
MCPegollo/Basic Statistics/SRSTHS
Sample of a Frequency
Distribution Table for Grouped
Data
Table 1.2
Frequency Distribution Table for the Quiz Scores of
50 Students in Geometry
Scores

Frequency

0-2

1

3-5

2

6-8

13

9 - 11

15

12 - 14

19

MCPegollo/Basic Statistics/SRSTHS
Lower Class Limits

are the smallest numbers that can actually belong
to different classes
Rating

Frequency

0-2

1

3-5

2

6-8

13

9 - 11

15

12 - 14

19
Lower Class Limits
are the smallest numbers that can
actually belong to different classes
Rating

0-2

Lower Class
Limits

Frequency

1

3-5

2

6-8

13

9 - 11

15

12 - 14

19
Upper Class Limits
are the largest numbers that can actually
belong to different classes
Rating

Frequency

0-2

1

3-5

2

6-8

13

9 - 11

15

12 - 14

19
Upper Class Limits
are the largest numbers that can actually
belong to different classes
Rating

Upper Class
Limits

Frequency

0-2

1

3-5

2

6-8

13

9 - 11

15

12 - 14

19
Class Boundaries
are the numbers used to separate classes,
but without the gaps created by class limits
Class Boundaries
number separating classes

Rating
- 0.5

0-2

20

3-5

14

6-8

15

9 - 11

2

2.5

5.5
8.5

Frequency

11.5

12 - 14

14.5

1
Class Boundaries
number separating classes

Rating
- 0.5

0-2

20

3-5

14

6-8

15

9 - 11

2

2.5

Class
Boundaries

5.5
8.5

Frequency

11.5

12 - 14

14.5

1
Class Midpoints
The Class Mark or Class Midpoint is the
respective average of each class limits
Class Midpoints
midpoints of the classes
Rating

Class
Midpoints

Frequency

0- 1 2

20

3- 4 5

14

6- 7 8

15

9 - 10 11

2

12 - 13 14

1
Class Width
is the difference between two consecutive lower class
limits or two consecutive class boundaries
Rating

Frequency

0-2

20

3-5

14

6-8

15

9 - 11

2

12 - 14

1
Class Width
is the difference between two consecutive lower class
limits or two consecutive class boundaries
Rating

Frequency

3

Class Width

0-2

20

3

3-5

14

3

6-8

15

3 9 - 11

2

3 12 - 14

1
Guidelines For Frequency Tables
1. Be sure that the classes are mutually exclusive.
2. Include all classes, even if the frequency is zero.
3. Try to use the same width for all classes.

4. Select convenient numbers for class limits.
5. Use between 5 and 20 classes.

6. The sum of the class frequencies must equal the
number of original data values.
Constructing A Frequency Table
1.

Decide on the number of classes .

2. Determine the class width by dividing the range by the number of
classes
(range = highest score - lowest score) and round
up.
range
class width



round up of

number of classes

3.

Select for the first lower limit either the lowest score or a
convenient value slightly less than the lowest score.

4.

Add the class width to the starting point to get the second lower
class limit, add the width to the second lower limit to get the
third, and so on.

5.

List the lower class limits in a vertical column and enter the
upper class limits.

6.

Represent each score by a tally mark in the appropriate class.
Total tally marks to find the total frequency for each class.
Homework
Gather data on the ages of your
classmates’ fathers, include your own.
Construct a frequency distribution table for
the data gathered using grouped and
ungrouped data.
What are the advantages and
disadvantages of using ungrouped
frequency distribution table?
What are the advantages and
disadvantages of using grouped
frequency distribution table?
MCPegollo/Basic Statistics/SRSTHS
Relative Frequency Table

relative frequency =

class frequency

sum of all frequencies
Relative Frequency Table
Rating Frequency

Relative
Rating Frequency

0-2

20

0-2

38.5%

3-5

14

3-5

26.9%

6-8

15

6-8

28.8%

9 - 11

2

9 - 11

3.8%

12 - 14

1

12 - 14

1.9%

20/52 = 38.5%

Total frequency = 52

Table 2-5

14/52 = 26.9%
etc.
Cumulative Frequency Table
>cf

Rating

Frequency

<cf

0-2

20

20

52

3–5

14

34

32

6–8

15

49

18

9 – 11

2

51

3

12 – 14

1

52

1

Table 2-6

Cumulative
Frequencies
Frequency Tables
Rating Frequency

Rating

Relative
Frequency

Rating

Cumulative
Frequency

0-2

20

0-2

38.5%

0–2

20

3-5

14

3-5

26.9%

3–5

34

6-8

15

6-8

28.8%

6–8

49

9 - 11

2

9 - 11

3.8%

9 – 11

51

12 - 14

1

12 - 14

1.9%

12 – 14

52

Table 2-3

Table 2-5

Table 2-6
Complete FDT
A complete FDT has class mark or
midpoint (x), class boundaries (c.b),
relative frequency or percentage
frequency, and the less than
cumulative frequency (<cf) and the
greater than cumulative frequency
(>cf).

MCPegollo/Basic Statistics/SRSTHS
Complete Frequency Table
Table 2-6

Grouped Frequency Distribution for the Test
Scores of 52 Students in Statistics
Class
Frequency Class
Intervals
(f)
Mark (x)
(ci)

Class
Relative
Boundary Frequency <cf
(cb)
(rf)

>cf

0-2

20

1

-0.5 – 2.5

38.5%

20

52

3–5

14

4

2.5 – 5.5

26.9%

34

32

6–8

15

7

5.5 – 8.5

28.8%

49

18

9 – 11

2

10

8.5 – 11.5

3.8%

51

3

12 – 14

1

13

11.5 – 14.5

1.9%

52

1
Exercise:
For each of the following class intervals, give
the class width(i), class mark (x), and class
boundary (cb)
Class interval (ci) Class Width

Class Mark

Class
Boundary

a. 4 – 8
b. 35 – 44
c. 17 – 21
d. 53 – 57
e. 8 – 11
f. 108 – 119
g. 10 – 19
h. 2.5 – 2. 9
i. 1. 75 – 2. 25
MCPegollo/Basic Statistics/SRSTHS
Construct a complete FDT with 7
classes
The following are the IQ scores of 60
student applicants in a certain high
school 106
128
96
94
85
75
113

103

96

91

94

70

109

113

109

100

81

81

103

113

91

88

78

75

106

103

100

88

81

81

113

106

100

96

88

78

96

109

94

96

88

70

103

102

88

78

95

90

99

89

87

96

95

104

89

99

101

105

103

125

MCPegollo/Basic Statistics/SRSTHS
Contingency Table
This is a table which shows the data
enumerated by cell. One type of such
table is the “r by c” (r x c) where the
columns refer to “c” samples and the
rows refer to “r” choices or
alternatives.

MCPegollo/Basic Statistics/SRSTHS
Example
Table 1
The Contingency Table for the Opinion of Viewers on
the TV program “Budoy”
Choice/Sample

Men

Women

Children

Total

Like the Program

50

56

45

151

Indifferent

23

16

12

51

Do not like the
program

43

55

40

138

Total

116

127

97

340

Give as many findings as you can, and draw as many conclusions
from your findings. The next table can help you identify significant
findings.
MCPegollo/Basic Statistics/SRSTHS
Example
Table 1
The Contingency Table for the Opinion of Viewers on
the TV program “Budoy”
Choice/Sampl
e

Men

Women

Children

Total

Like the
Program

50 (33%) 56(37%)
(43%)
(44%)

45(30%)
(46%)

151
(44%)

Indifferent

23(45%)
(20%)

16(31%)
(13%)

12(24%)
(12%)

51
(15%)

Do not like the
program

43(53%)
(37%)

55(40%)
(43%)

40(29%)
(41%)

138(41%)

Total

116
(34%)

127
(37%)

97
(28%)

340

Do not use this table for presentation because the percentages might
confuse the readers. Can you explain the percentages in each cell?
MCPegollo/Basic Statistics/SRSTHS

Presentationofdata 120111034007-phpapp02

  • 1.
    Presentation of Data Module6 Basic Statistics SRSTHS Ms. Pegollo
  • 2.
    Presentation of Data Objectives:At the end of the lesson, the students should be able to: 1. Prepare a stem-and-leaf plot 2. Describe data in textual form 3. Construct frequency distribution table 4. Create graphs 5. Read and interpret graphs and tables MCPegollo/Basic Statistics/SRSTHS
  • 3.
    Ungrouped vs. GroupedData Data can be classified as grouped or ungrouped. Ungrouped data are data that are not organized, or if arranged, could only be from highest to lowest or lowest to highest. Grouped data are data that are organized and arranged into different classes or categories. MCPegollo/Basic Statistics/SRSTHS
  • 4.
    Presentation of Data Textual Method Tabular Method Graphical Method •Rearrangem ent from lowest to highest • Stem-andleaf plot • Frequency distribution table (FDT) • Relative FDT • Cumulative FDT • Contingency Table • Bar Chart • Histogram • Frequency Polygon • Pie Chart • Less than, greater than Ogive MCPegollo/Basic Statistics/SRSTHS
  • 5.
    Textual Presentation ofData Data can be presented using paragraphs or sentences. It involves enumerating important characteristics, emphasizing significant figures and identifying important features of data. MCPegollo/Basic Statistics/SRSTHS
  • 6.
    Textual Presentation ofData Example. You are asked to present the performance of your section in the Statistics test. The following are the test scores of your class: 34 42 20 50 17 9 34 43 50 18 35 43 50 23 23 35 37 38 38 39 39 38 38 39 24 29 25 26 28 27 44 44 49 48 46 45 45 46 45 46 MCPegollo/Basic Statistics/SRSTHS
  • 7.
    Solution First, arrange thedata in order for you to identify the important characteristics. This can be done in two ways: rearranging from lowest to highest or using the stem-and-leaf plot. Below is the rearrangement of data from lowest to highest: 9 23 28 35 38 43 45 48 17 24 29 37 39 43 45 49 18 25 34 38 39 44 46 50 20 26 34 38 39 44 46 50 23 27 35 38 42 45 46 50 MCPegollo/Basic Statistics/SRSTHS
  • 8.
    With the rearrangeddata, pertinent data worth mentioning can be easily recognized. The following is one way of presenting data in textual form. In the Statistics class of 40 students, 3 obtained the perfect score of 50. Sixteen students got a score of 40 and above, while only 3 got 19 and below. Generally, the students performed well in the test with 23 or 70% getting a passing score of 38 and MCPegollo/Basic Statistics/SRSTHS
  • 9.
    Another way ofrearranging data is by making use of the stem-and-leaf plot. What is a stem-and-leaf plot? Stem-and-leaf Plot is a table which sorts data according to a certain pattern. It involves separating a number into two parts. In a two-digit number, the stem consists of the first digit, and the leaf consists of the second digit. While in a three-digit number, the stem consists of the first two digits, and the leaf consists of the last digit. In a onedigit number, the stem is zero. MCPegollo/Basic Statistics/SRSTHS
  • 10.
    Below is thestem-and-leaf plot of the ungrouped data given in the example. Stem Leaves 0 9 1 7,8 2 0,3,3,4,5,6,7,8,9 3 4,4,5,5,7,8,8,8,8,9,9,9 4 2,3,3,4,4,5,5,5,6,6,6,8,9 5 0,0,0 Utilizing the stem-and-leaf plot, we can readily see the order of the data. Thus, we can say that the top ten got scores 50, 50, 50, 49, 48, 46, 46, 46,45, and 45 and the ten lowest scores are 9, 17, 18, 20, MCPegollo/Basic Statistics/SRSTHS 23,23,24,25,26, and 27.
  • 11.
    Exercise: Prepare a stem-and-leafplot and present in textual form. Stem The ages Leaf teachers in a public of 40 school 23 2 3,6,7,8,8,9 27 28 36 32 42 0,1,2,4,4,5,5,5,6,6,6,6,8,8,8,8,9,9 3 44 54 56 48 55 48 30 31 35 36 47 48 4 0,0,0,2,3,4,4,5,5,7,8,8,8 26 28 29 45 34 5 4,5,6 38 39 38 36 35 34 36 35 38 39 40 43 38 45 44 40 40 MCPegollo/Basic Statistics/SRSTHS
  • 12.
    Tabular Presentation ofData Below is a sample of a table with all of its parts indicated: Table Number Table Title Column Header Row Classifier Body Source Note http://www.sws.org.ph/youth.htm MCPegollo/Basic Statistics/SRSTHS
  • 13.
    Frequency Distribution Table Afrequency distribution table is a table which shows the data arranged into different classes(or categories) and the number of cases(or frequencies) which fall into each class. The following is an illustration of a frequency distribution table for ungrouped data: MCPegollo/Basic Statistics/SRSTHS
  • 14.
    Sample of aFrequency Distribution Table for Ungrouped Data Table 1.1 Frequency Distribution for the Ages of 50 Students Enrolled in Statistics Age Frequency 12 2 13 13 14 27 15 4 16 3 17 1 N = 50 MCPegollo/Basic Statistics/SRSTHS
  • 15.
    Sample of aFrequency Distribution Table for Grouped Data Table 1.2 Frequency Distribution Table for the Quiz Scores of 50 Students in Geometry Scores Frequency 0-2 1 3-5 2 6-8 13 9 - 11 15 12 - 14 19 MCPegollo/Basic Statistics/SRSTHS
  • 16.
    Lower Class Limits arethe smallest numbers that can actually belong to different classes Rating Frequency 0-2 1 3-5 2 6-8 13 9 - 11 15 12 - 14 19
  • 17.
    Lower Class Limits arethe smallest numbers that can actually belong to different classes Rating 0-2 Lower Class Limits Frequency 1 3-5 2 6-8 13 9 - 11 15 12 - 14 19
  • 18.
    Upper Class Limits arethe largest numbers that can actually belong to different classes Rating Frequency 0-2 1 3-5 2 6-8 13 9 - 11 15 12 - 14 19
  • 19.
    Upper Class Limits arethe largest numbers that can actually belong to different classes Rating Upper Class Limits Frequency 0-2 1 3-5 2 6-8 13 9 - 11 15 12 - 14 19
  • 20.
    Class Boundaries are thenumbers used to separate classes, but without the gaps created by class limits
  • 21.
    Class Boundaries number separatingclasses Rating - 0.5 0-2 20 3-5 14 6-8 15 9 - 11 2 2.5 5.5 8.5 Frequency 11.5 12 - 14 14.5 1
  • 22.
    Class Boundaries number separatingclasses Rating - 0.5 0-2 20 3-5 14 6-8 15 9 - 11 2 2.5 Class Boundaries 5.5 8.5 Frequency 11.5 12 - 14 14.5 1
  • 23.
    Class Midpoints The ClassMark or Class Midpoint is the respective average of each class limits
  • 24.
    Class Midpoints midpoints ofthe classes Rating Class Midpoints Frequency 0- 1 2 20 3- 4 5 14 6- 7 8 15 9 - 10 11 2 12 - 13 14 1
  • 25.
    Class Width is thedifference between two consecutive lower class limits or two consecutive class boundaries Rating Frequency 0-2 20 3-5 14 6-8 15 9 - 11 2 12 - 14 1
  • 26.
    Class Width is thedifference between two consecutive lower class limits or two consecutive class boundaries Rating Frequency 3 Class Width 0-2 20 3 3-5 14 3 6-8 15 3 9 - 11 2 3 12 - 14 1
  • 27.
    Guidelines For FrequencyTables 1. Be sure that the classes are mutually exclusive. 2. Include all classes, even if the frequency is zero. 3. Try to use the same width for all classes. 4. Select convenient numbers for class limits. 5. Use between 5 and 20 classes. 6. The sum of the class frequencies must equal the number of original data values.
  • 28.
    Constructing A FrequencyTable 1. Decide on the number of classes . 2. Determine the class width by dividing the range by the number of classes (range = highest score - lowest score) and round up. range class width  round up of number of classes 3. Select for the first lower limit either the lowest score or a convenient value slightly less than the lowest score. 4. Add the class width to the starting point to get the second lower class limit, add the width to the second lower limit to get the third, and so on. 5. List the lower class limits in a vertical column and enter the upper class limits. 6. Represent each score by a tally mark in the appropriate class. Total tally marks to find the total frequency for each class.
  • 29.
    Homework Gather data onthe ages of your classmates’ fathers, include your own. Construct a frequency distribution table for the data gathered using grouped and ungrouped data. What are the advantages and disadvantages of using ungrouped frequency distribution table? What are the advantages and disadvantages of using grouped frequency distribution table? MCPegollo/Basic Statistics/SRSTHS
  • 30.
    Relative Frequency Table relativefrequency = class frequency sum of all frequencies
  • 31.
    Relative Frequency Table RatingFrequency Relative Rating Frequency 0-2 20 0-2 38.5% 3-5 14 3-5 26.9% 6-8 15 6-8 28.8% 9 - 11 2 9 - 11 3.8% 12 - 14 1 12 - 14 1.9% 20/52 = 38.5% Total frequency = 52 Table 2-5 14/52 = 26.9% etc.
  • 32.
    Cumulative Frequency Table >cf Rating Frequency <cf 0-2 20 20 52 3–5 14 34 32 6–8 15 49 18 9– 11 2 51 3 12 – 14 1 52 1 Table 2-6 Cumulative Frequencies
  • 33.
  • 34.
    Complete FDT A completeFDT has class mark or midpoint (x), class boundaries (c.b), relative frequency or percentage frequency, and the less than cumulative frequency (<cf) and the greater than cumulative frequency (>cf). MCPegollo/Basic Statistics/SRSTHS
  • 35.
    Complete Frequency Table Table2-6 Grouped Frequency Distribution for the Test Scores of 52 Students in Statistics Class Frequency Class Intervals (f) Mark (x) (ci) Class Relative Boundary Frequency <cf (cb) (rf) >cf 0-2 20 1 -0.5 – 2.5 38.5% 20 52 3–5 14 4 2.5 – 5.5 26.9% 34 32 6–8 15 7 5.5 – 8.5 28.8% 49 18 9 – 11 2 10 8.5 – 11.5 3.8% 51 3 12 – 14 1 13 11.5 – 14.5 1.9% 52 1
  • 36.
    Exercise: For each ofthe following class intervals, give the class width(i), class mark (x), and class boundary (cb) Class interval (ci) Class Width Class Mark Class Boundary a. 4 – 8 b. 35 – 44 c. 17 – 21 d. 53 – 57 e. 8 – 11 f. 108 – 119 g. 10 – 19 h. 2.5 – 2. 9 i. 1. 75 – 2. 25 MCPegollo/Basic Statistics/SRSTHS
  • 37.
    Construct a completeFDT with 7 classes The following are the IQ scores of 60 student applicants in a certain high school 106 128 96 94 85 75 113 103 96 91 94 70 109 113 109 100 81 81 103 113 91 88 78 75 106 103 100 88 81 81 113 106 100 96 88 78 96 109 94 96 88 70 103 102 88 78 95 90 99 89 87 96 95 104 89 99 101 105 103 125 MCPegollo/Basic Statistics/SRSTHS
  • 38.
    Contingency Table This isa table which shows the data enumerated by cell. One type of such table is the “r by c” (r x c) where the columns refer to “c” samples and the rows refer to “r” choices or alternatives. MCPegollo/Basic Statistics/SRSTHS
  • 39.
    Example Table 1 The ContingencyTable for the Opinion of Viewers on the TV program “Budoy” Choice/Sample Men Women Children Total Like the Program 50 56 45 151 Indifferent 23 16 12 51 Do not like the program 43 55 40 138 Total 116 127 97 340 Give as many findings as you can, and draw as many conclusions from your findings. The next table can help you identify significant findings. MCPegollo/Basic Statistics/SRSTHS
  • 40.
    Example Table 1 The ContingencyTable for the Opinion of Viewers on the TV program “Budoy” Choice/Sampl e Men Women Children Total Like the Program 50 (33%) 56(37%) (43%) (44%) 45(30%) (46%) 151 (44%) Indifferent 23(45%) (20%) 16(31%) (13%) 12(24%) (12%) 51 (15%) Do not like the program 43(53%) (37%) 55(40%) (43%) 40(29%) (41%) 138(41%) Total 116 (34%) 127 (37%) 97 (28%) 340 Do not use this table for presentation because the percentages might confuse the readers. Can you explain the percentages in each cell? MCPegollo/Basic Statistics/SRSTHS

Editor's Notes

  • #16 Data presented in a grouped frequency distribution are easier to analyze and to describe. However, the identity of individual score is lost due to grouping.