Downloaded 703 times

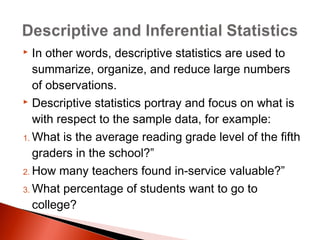
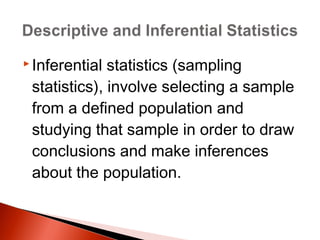
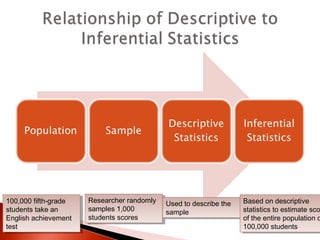
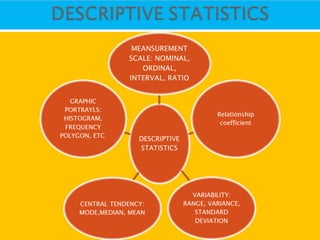
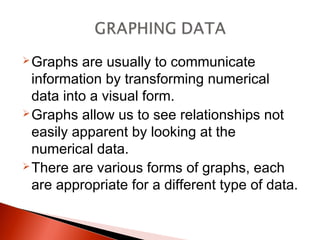
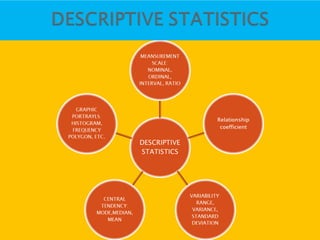
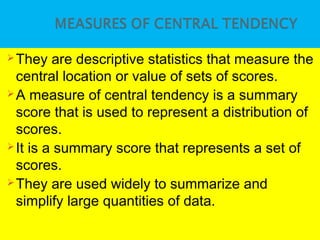
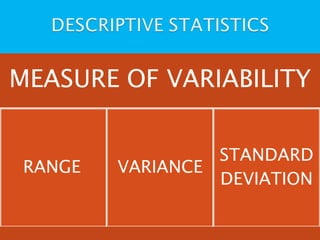

The document provides an overview of statistical methods, including descriptive and inferential statistics. Descriptive statistics summarize and organize data from specific samples, while inferential statistics draw conclusions about a population based on sample data. It also discusses the use of graphs, measures of central tendency, variance, and standard deviation in analyzing numerical data.


![Lesson3 lpart one - Measures mean [Autosaved].pptx](https://cdn.slidesharecdn.com/ss_thumbnails/lesson2-measuresmeanautosaved-241011173812-613e1e66-thumbnail.jpg?width=640&height=640&fit=bounds)


