Downloaded 583 times

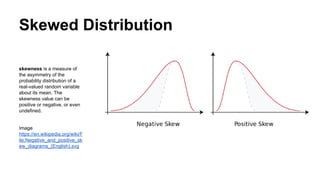
![Data
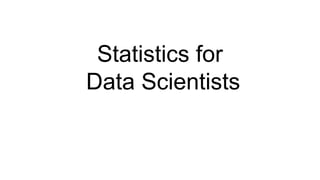
https://en.oxforddictionaries.com/definition/data Definition of data in English:
data
noun
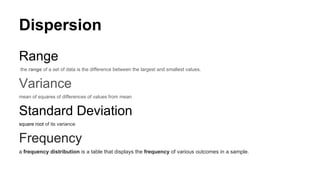
[mass noun] Facts and statistics collected together for reference or analysis:
‘there is very little data available’
The quantities, characters, or symbols on which operations are performed by a computer, which may be stored and transmitted
in the form of electrical signals and recorded on magnetic, optical, or mechanical recording media.
Philosophy Things known or assumed as facts, making the basis of reasoning or calculation.](https://image.slidesharecdn.com/statisticsfordatascientists-161221045426/85/Statistics-for-data-scientists-6-320.jpg)
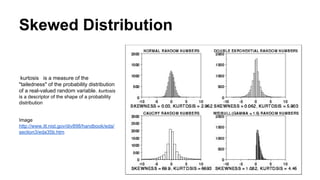

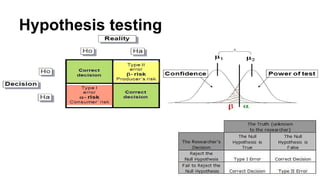

![Chi Square Distribution
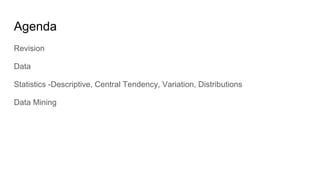
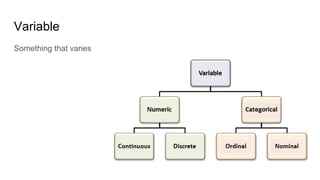
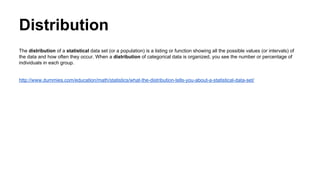
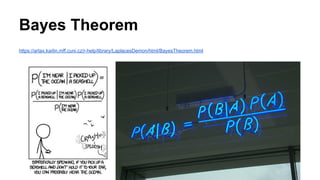
Problem
Find the 95th
percentile of the Chi-Squared distribution with 7 degrees of freedom.
Solution
We apply the quantile function qchisq of the Chi-Squared distribution against the decimal values 0.95.
> qchisq(.95, df=7) # 7 degrees of freedom
[1] 14.067
http://www.r-tutor.com/elementary-statistics/probability-distributions/chi-squared-distribution](https://image.slidesharecdn.com/statisticsfordatascientists-161221045426/85/Statistics-for-data-scientists-34-320.jpg)
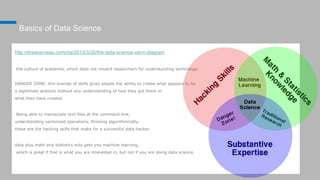
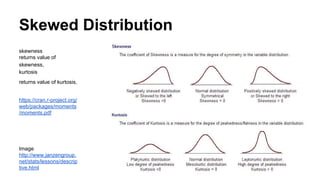
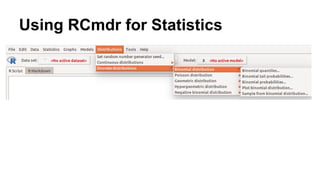
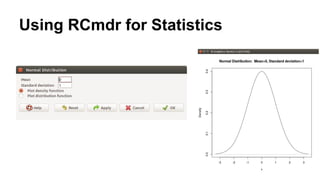
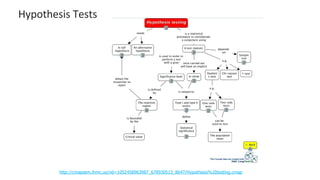
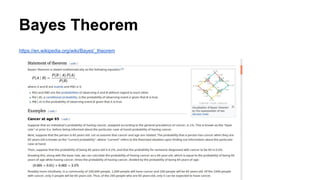
![Normal Distribution
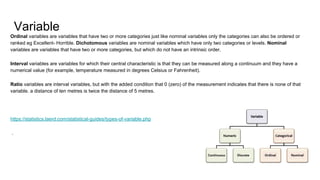
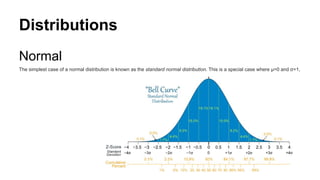
we are looking for the percentage of students scoring
higher than 84 , we apply the function pnorm of the normal
distribution with mean 72 and standard deviation 15.2. We
are interested in the upper tail of the normal distribution.
> pnorm(84, mean=72, sd=15.2, lower.tail=FALSE)
[1] 0.21492](https://image.slidesharecdn.com/statisticsfordatascientists-161221045426/85/Statistics-for-data-scientists-35-320.jpg)
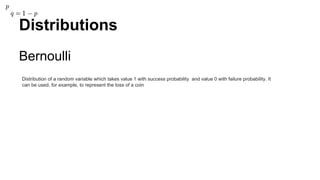
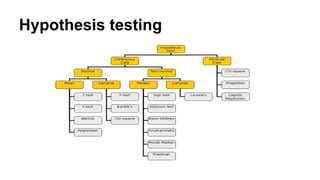
![Student T Distribution
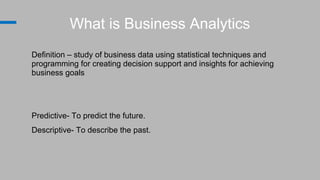
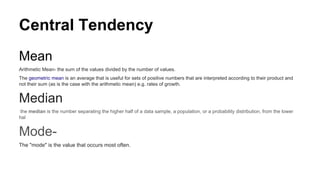
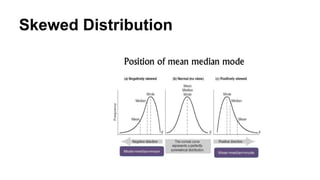
Problem
Find the 2.5th
and 97.5th
percentiles of the Student t distribution with 5 degrees of freedom.
Solution
We apply the quantile function qt of the Student t distribution against the decimal values 0.025 and 0.975.
> qt(c(.025, .975), df=5) # 5 degrees of freedom
[1] -2.5706 2.5706](https://image.slidesharecdn.com/statisticsfordatascientists-161221045426/85/Statistics-for-data-scientists-36-320.jpg)

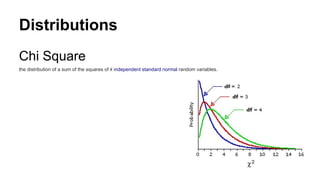
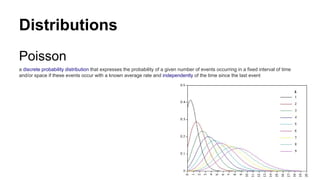
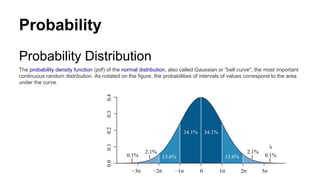
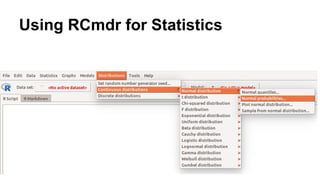
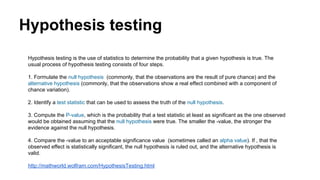
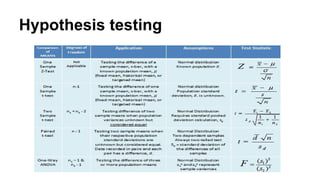
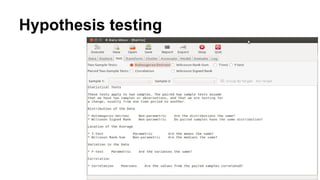
This document provides an overview of key concepts in statistics for data science, including: - Descriptive statistics like measures of central tendency (mean, median, mode) and variation (range, variance, standard deviation). - Common distributions like the normal, binomial, and Poisson distributions. - Statistical inference techniques like hypothesis testing, t-tests, and the chi-square test. - Bayesian concepts like Bayes' theorem and how to apply it in R. - How to use R and RCommander for exploring and visualizing data and performing statistical analyses.


![Hacking-Uncovered-How-People-Get-Hacked-and-How-to-Stay-Safe[1].pptx](https://cdn.slidesharecdn.com/ss_thumbnails/hacking-uncovered-how-people-get-hacked-and-how-to-stay-safe1-260130170011-4883a9c7-thumbnail.jpg?width=640&height=640&fit=bounds)