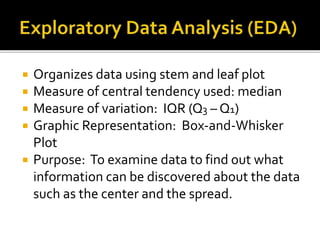
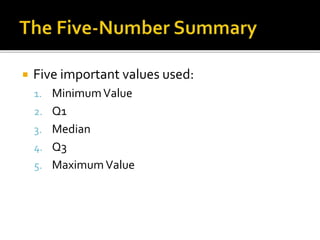
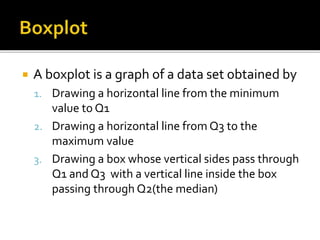
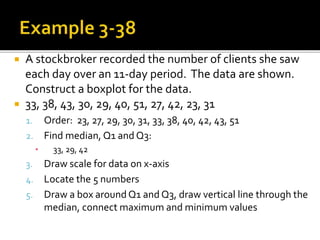
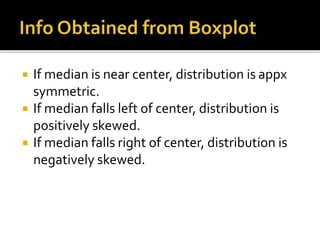
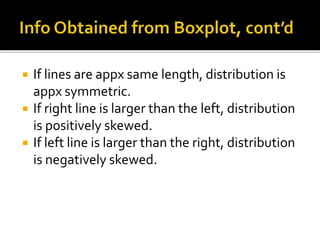
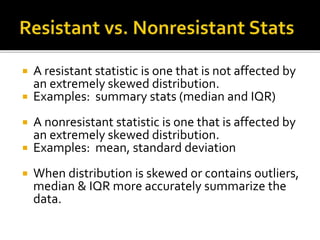
This document discusses exploratory data analysis techniques including boxplots and five-number summaries. It explains how to organize and graph data using histograms, frequency polygons, stem-and-leaf plots, and box-and-whisker plots. The five important values used in a boxplot are the minimum, first quartile, median, third quartile, and maximum. An example constructs a boxplot for a stockbroker's daily client numbers over 11 days.