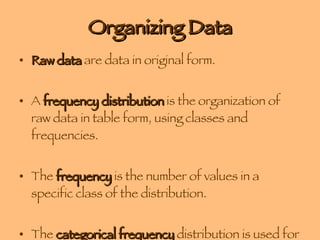
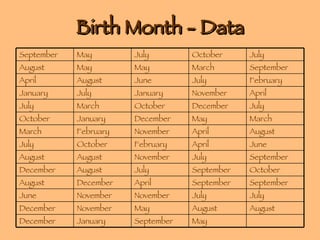
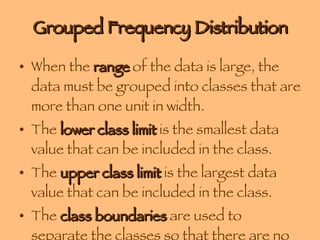
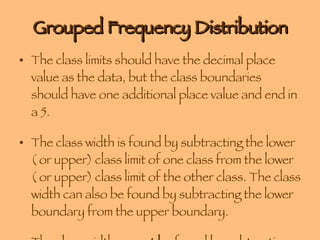
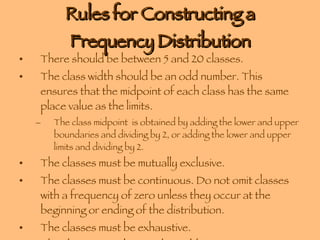
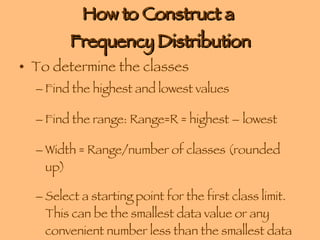
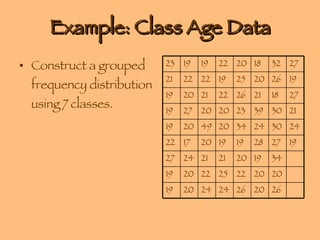
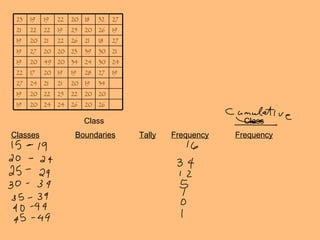
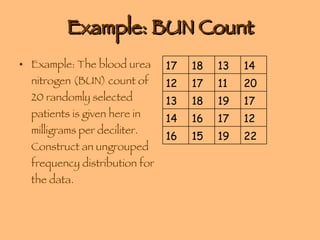
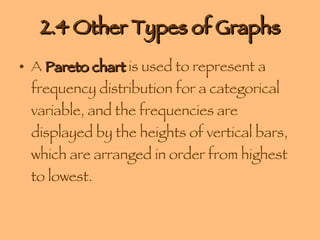
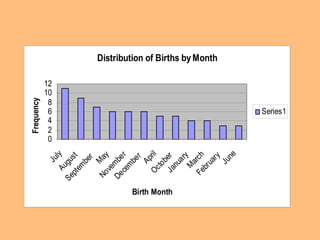
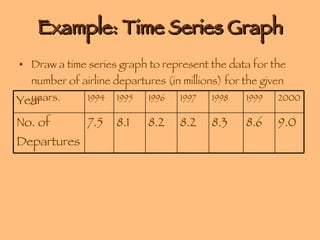
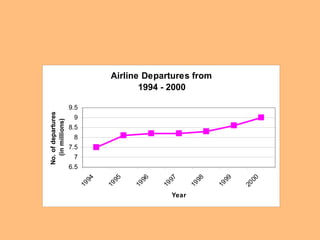
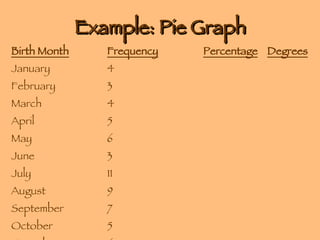
This document discusses different types of graphs and distributions that can be used to organize and represent data. It explains frequency distributions, histograms, frequency polygons, ogives, relative frequency graphs, Pareto charts, time series graphs, pie charts, and stem-and-leaf plots. Rules for constructing frequency distributions and examples of each type of graph are provided.