Download as PDF, PPTX


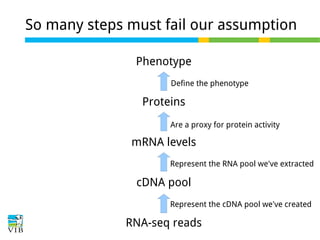
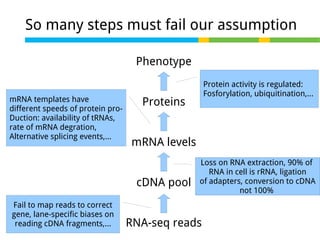

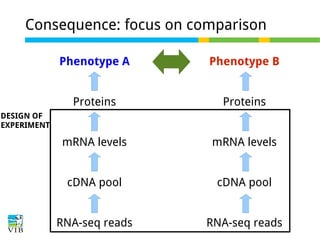


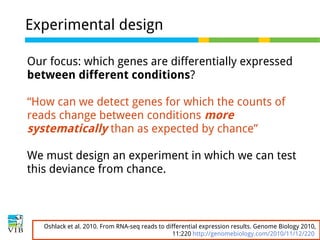


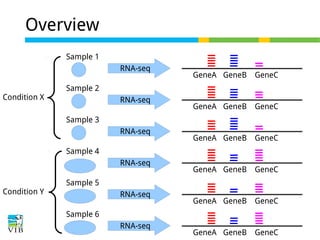
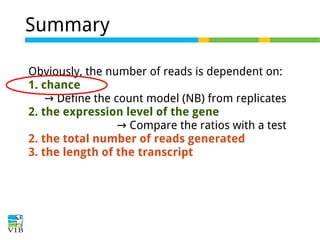


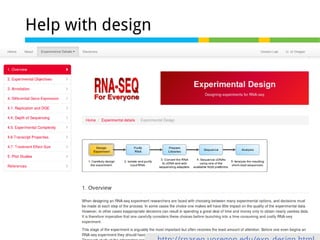


This document outlines the objectives and methodologies of RNA-seq analysis for differential gene expression, highlighting its capabilities to identify active genes and quantify their expression. It details various techniques including qPCR, microarray, and RNA-seq protocols, emphasizing the importance of experimental design and normalization in obtaining accurate results. The document also discusses challenges in data interpretation, the need for biological replicates, and advanced statistical models to analyze sequencing data.


![5G Explained! A High Level Overview [Introduction]](https://cdn.slidesharecdn.com/ss_thumbnails/5gexplainedahighleveloverview-260119165306-cc137a3e-thumbnail.jpg?width=640&height=640&fit=bounds)


