Downloaded 157 times
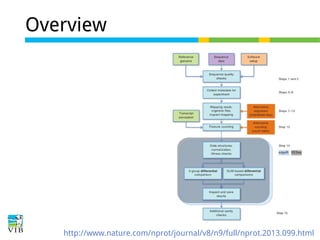
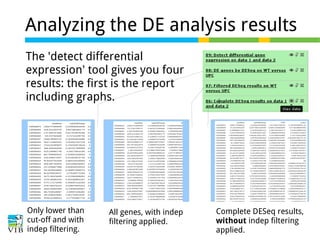
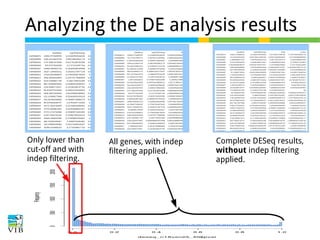
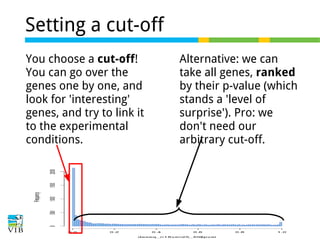
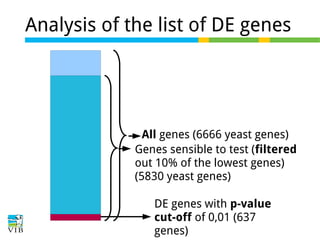
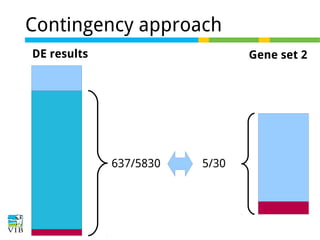
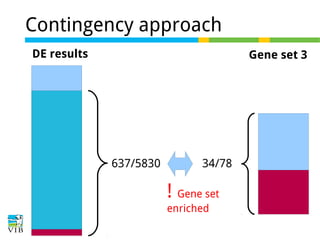
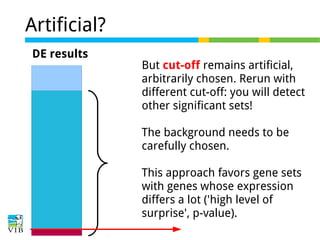
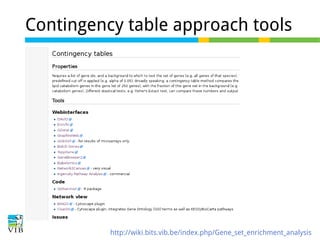
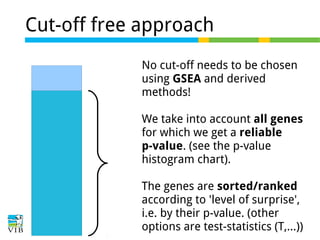
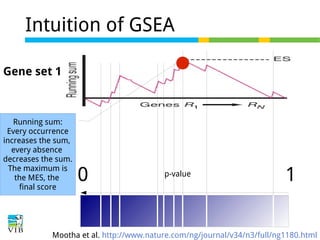
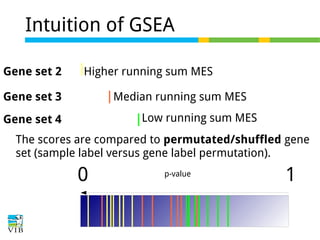
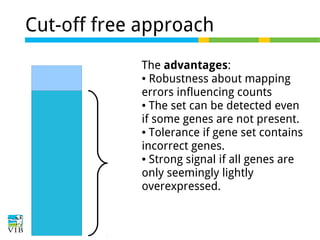
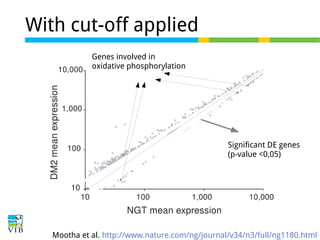
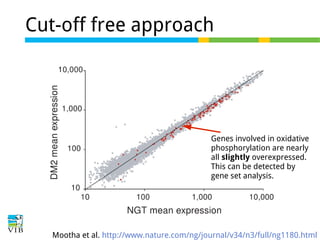
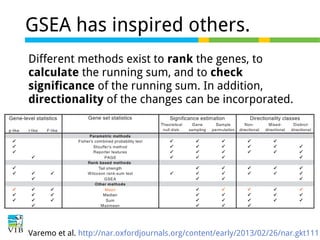
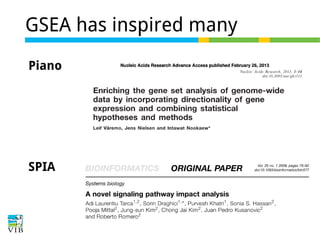


The document discusses differential expression analysis using RNA-Seq, focusing on the tools and methods available for interpreting results, including setting cut-offs and gene set enrichment analysis. It explains the advantages of a cut-off-free approach like Gene Set Enrichment Analysis (GSEA) that allows for robust detection of significant gene sets based on their p-values. The presentation also mentions various methods and tools for visualizing and analyzing gene expression data.


