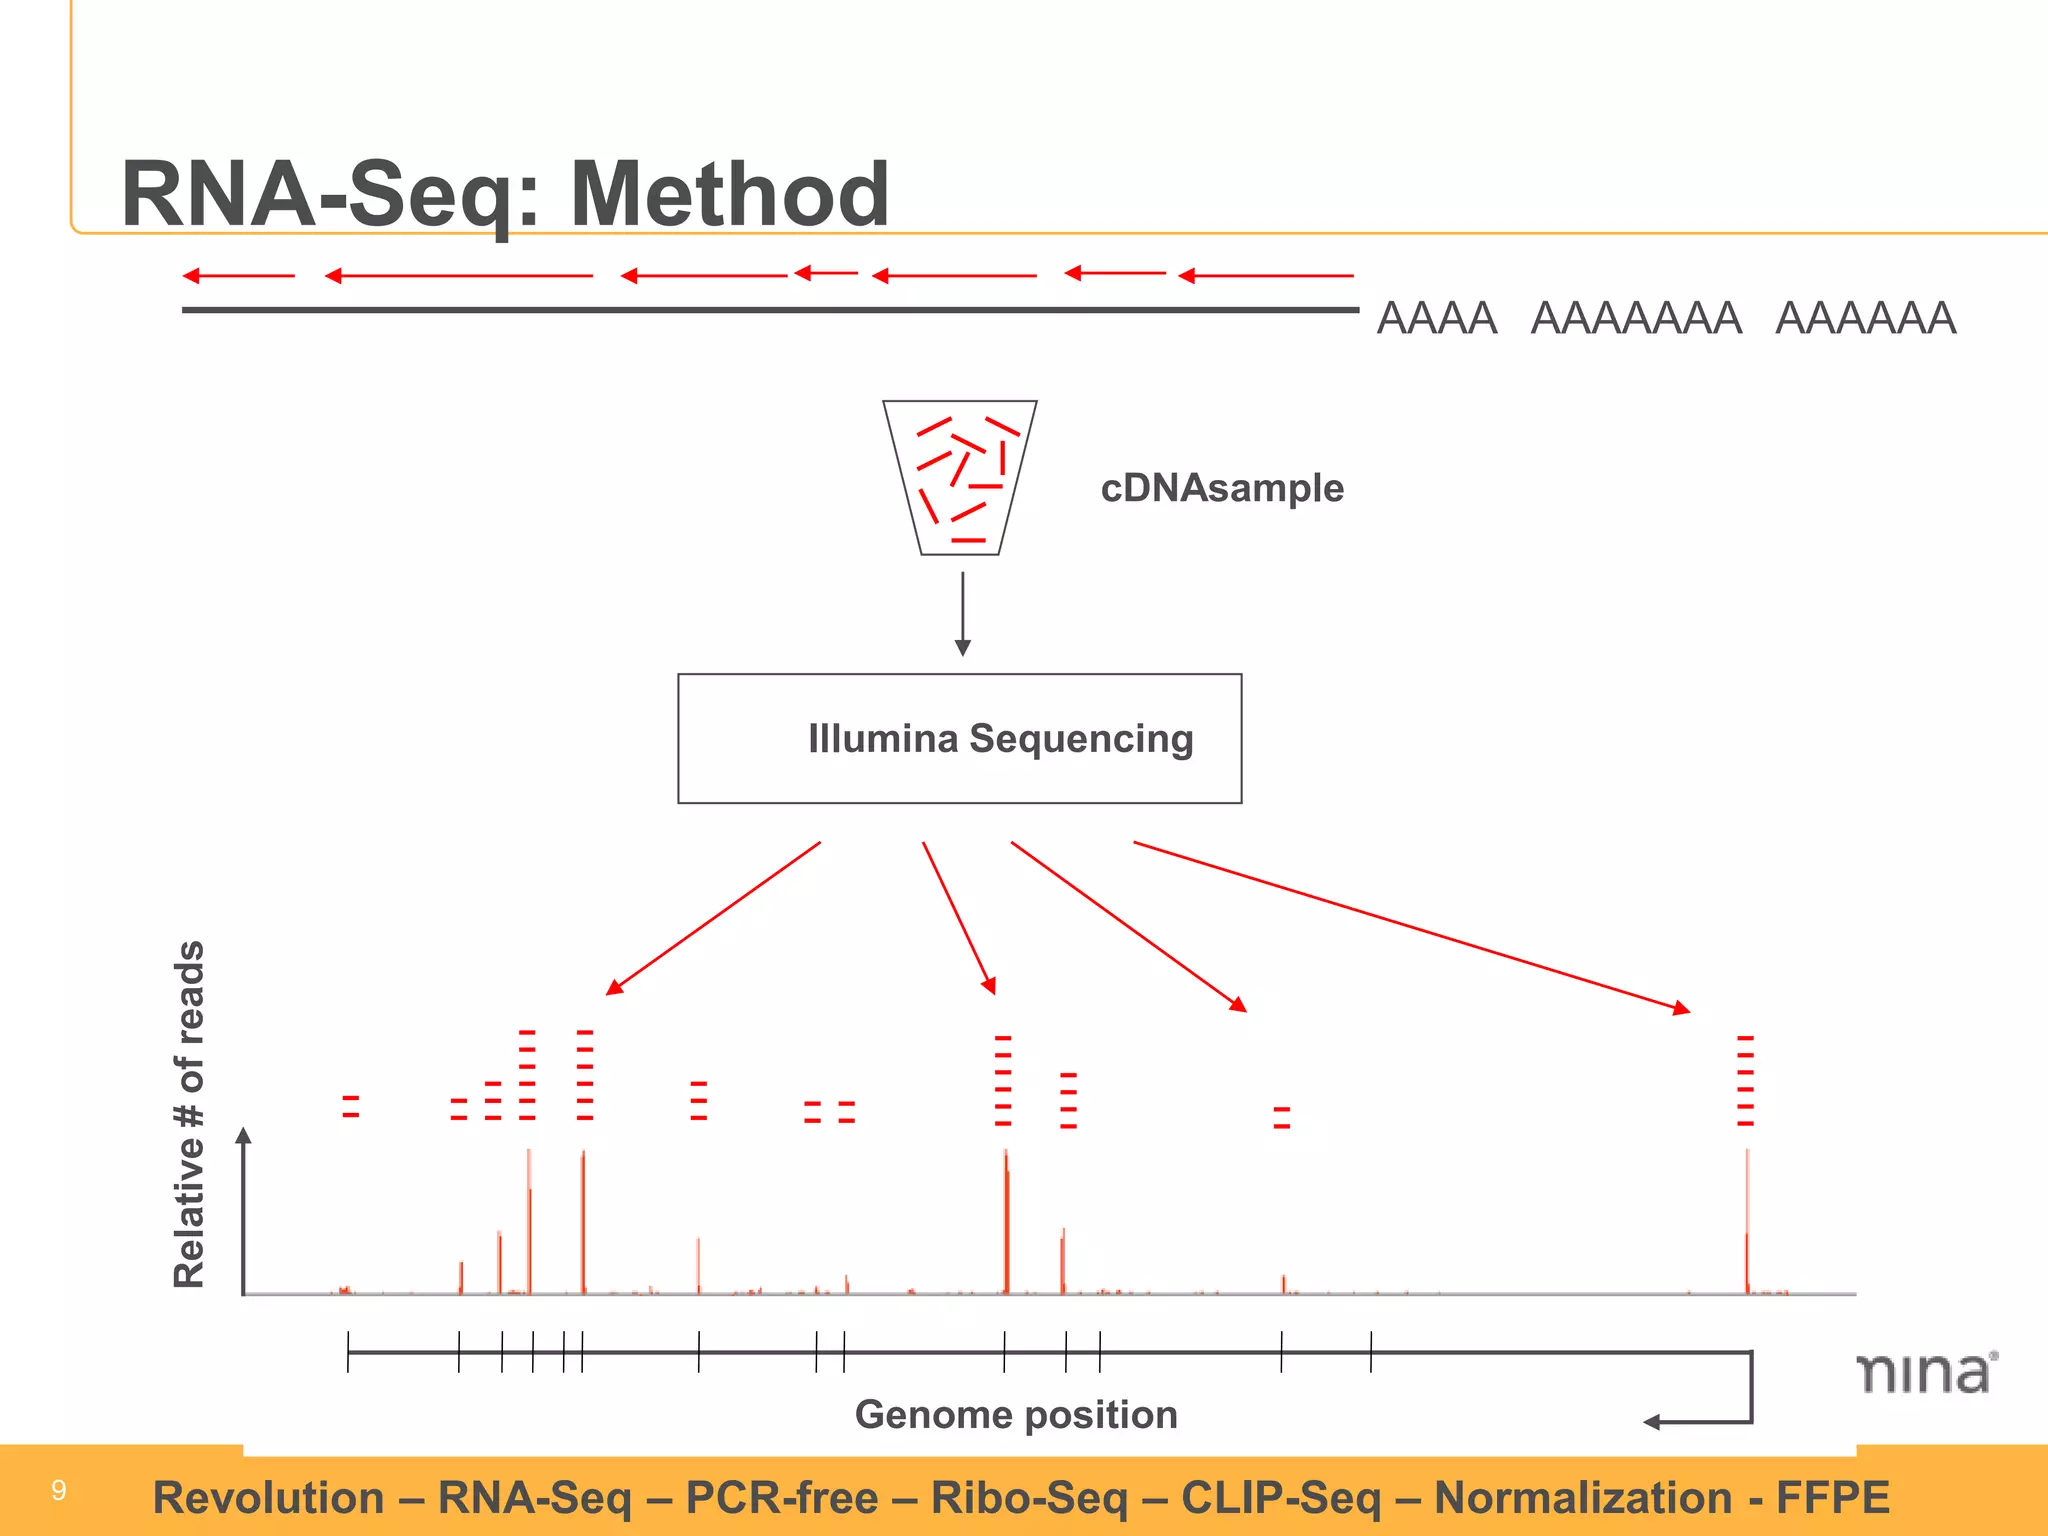
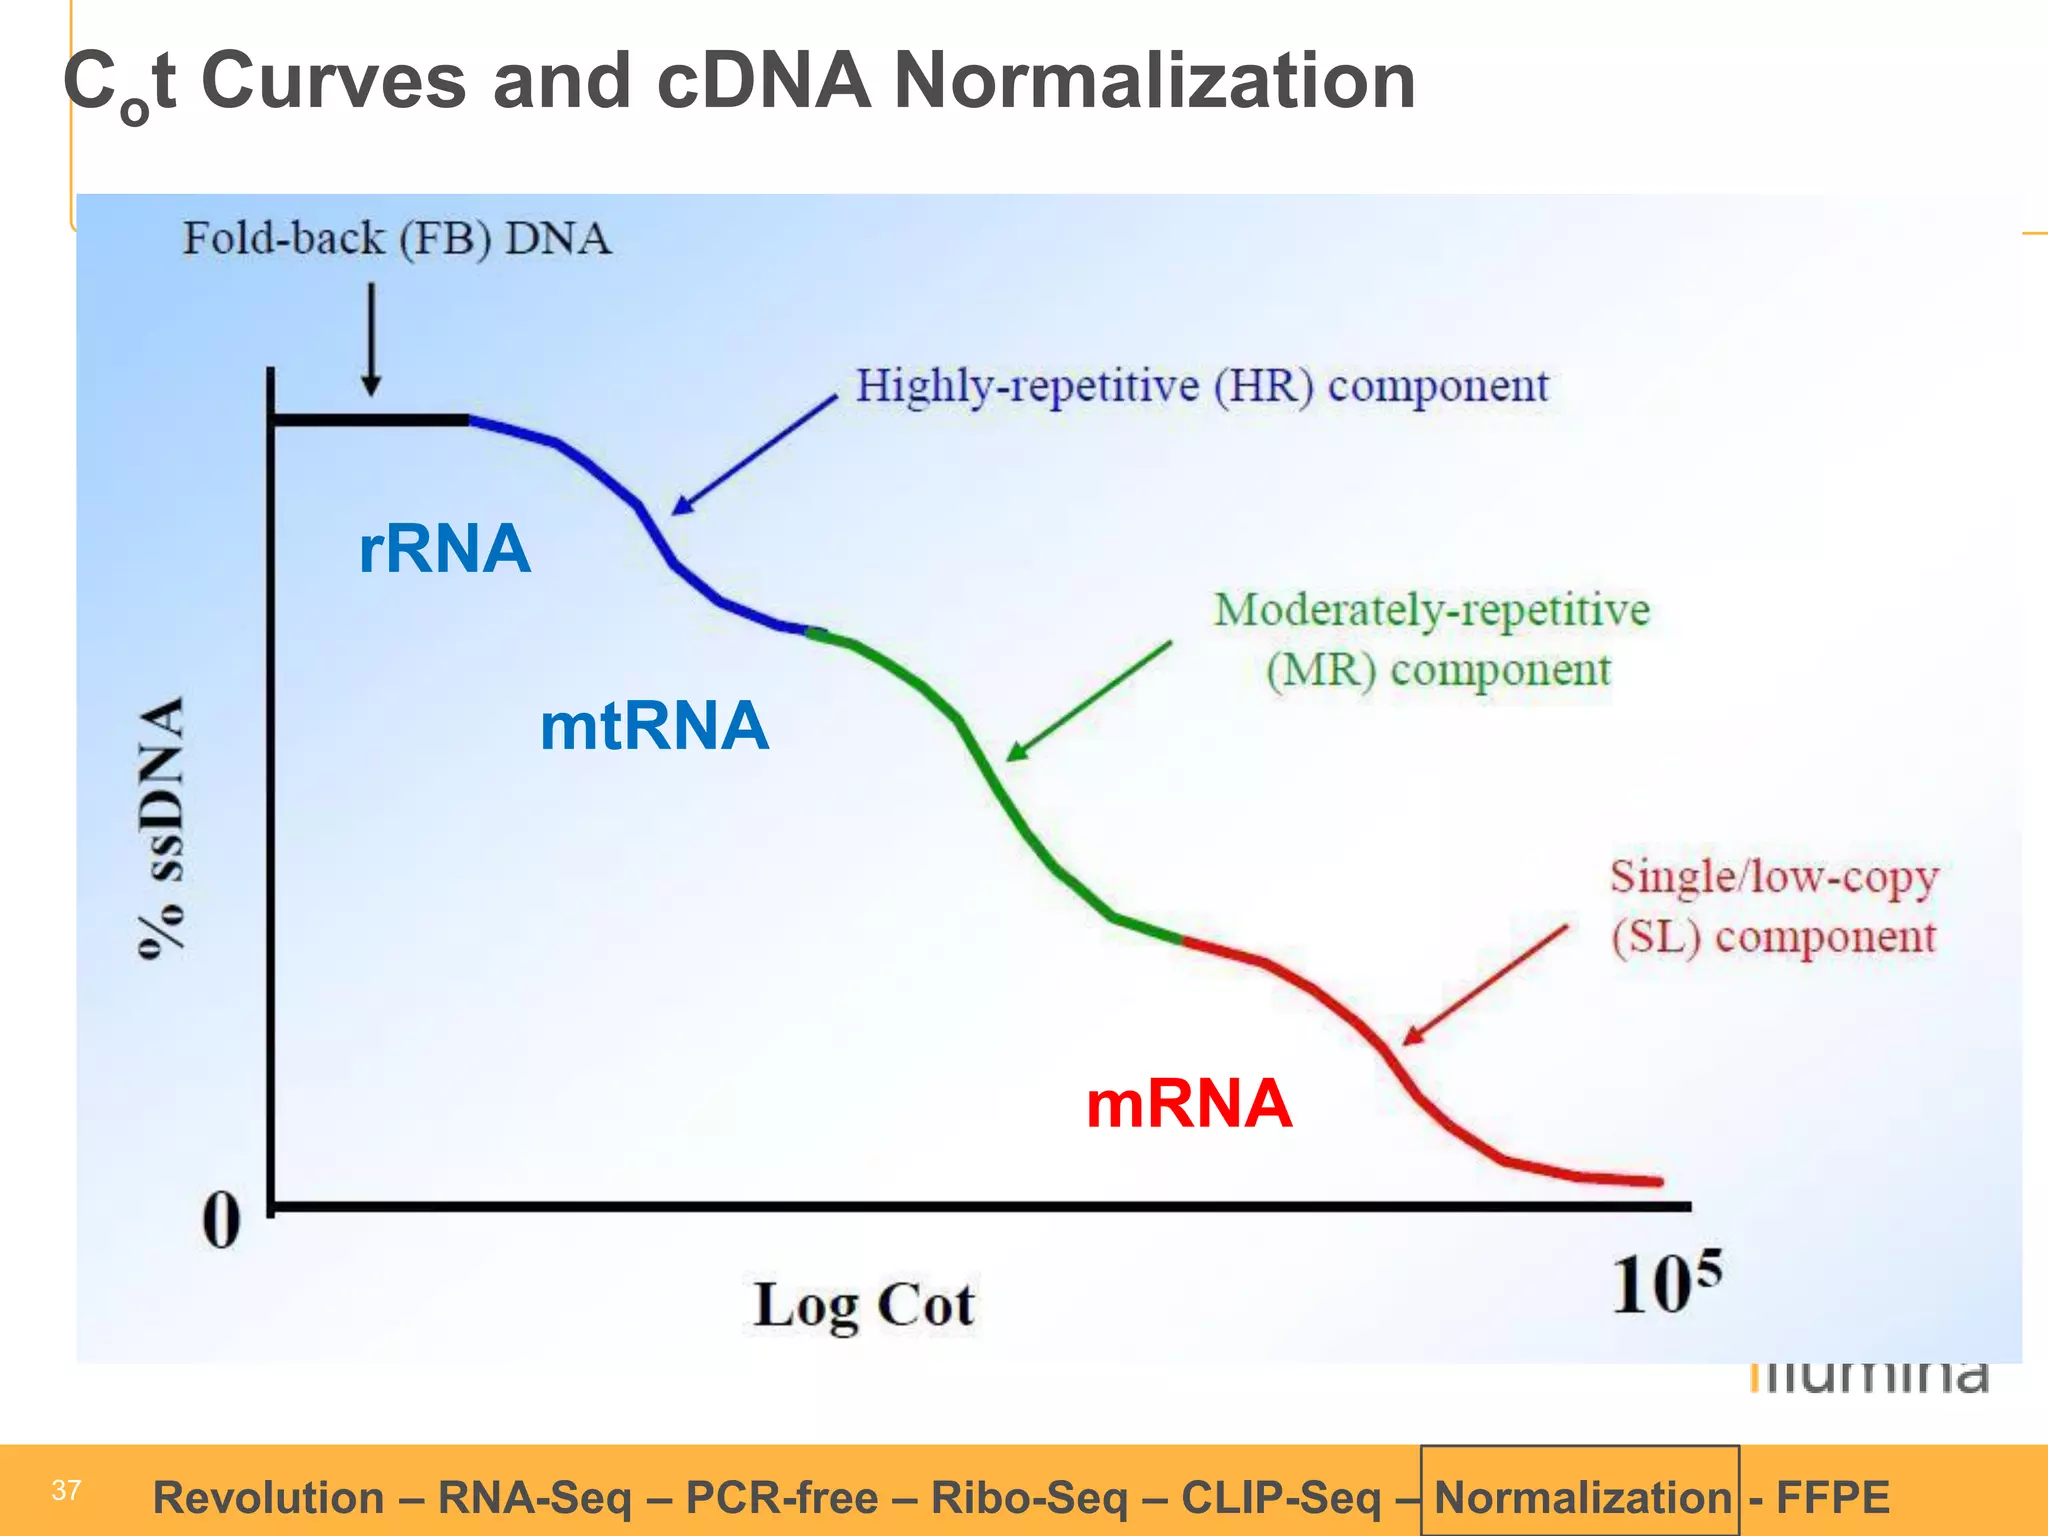
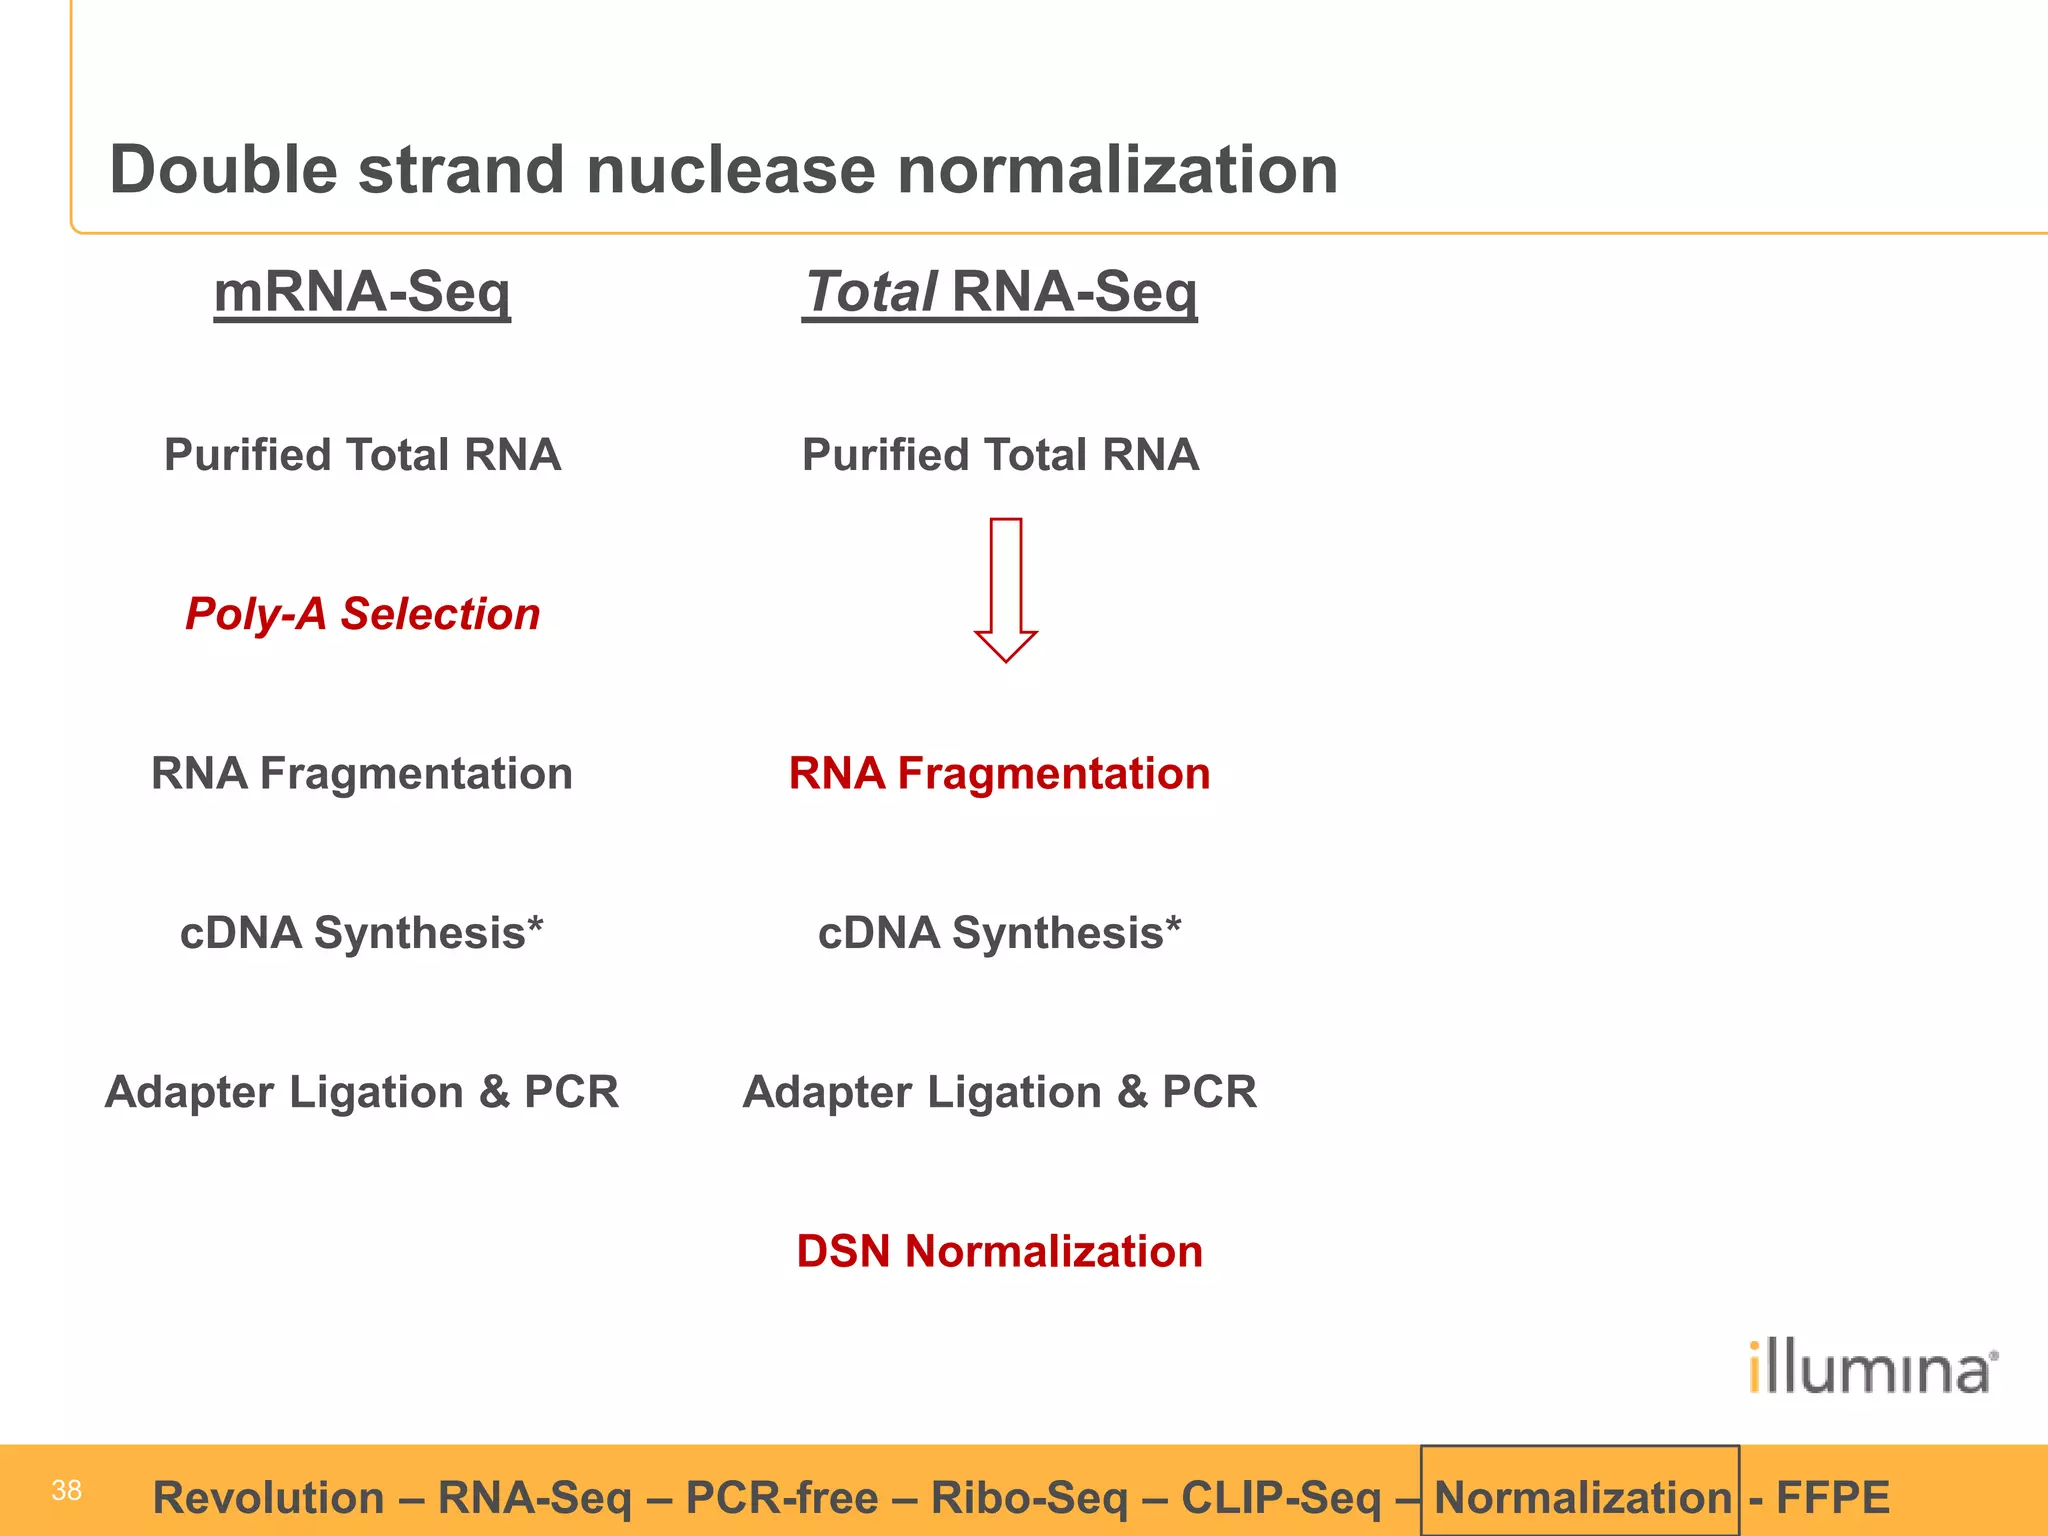
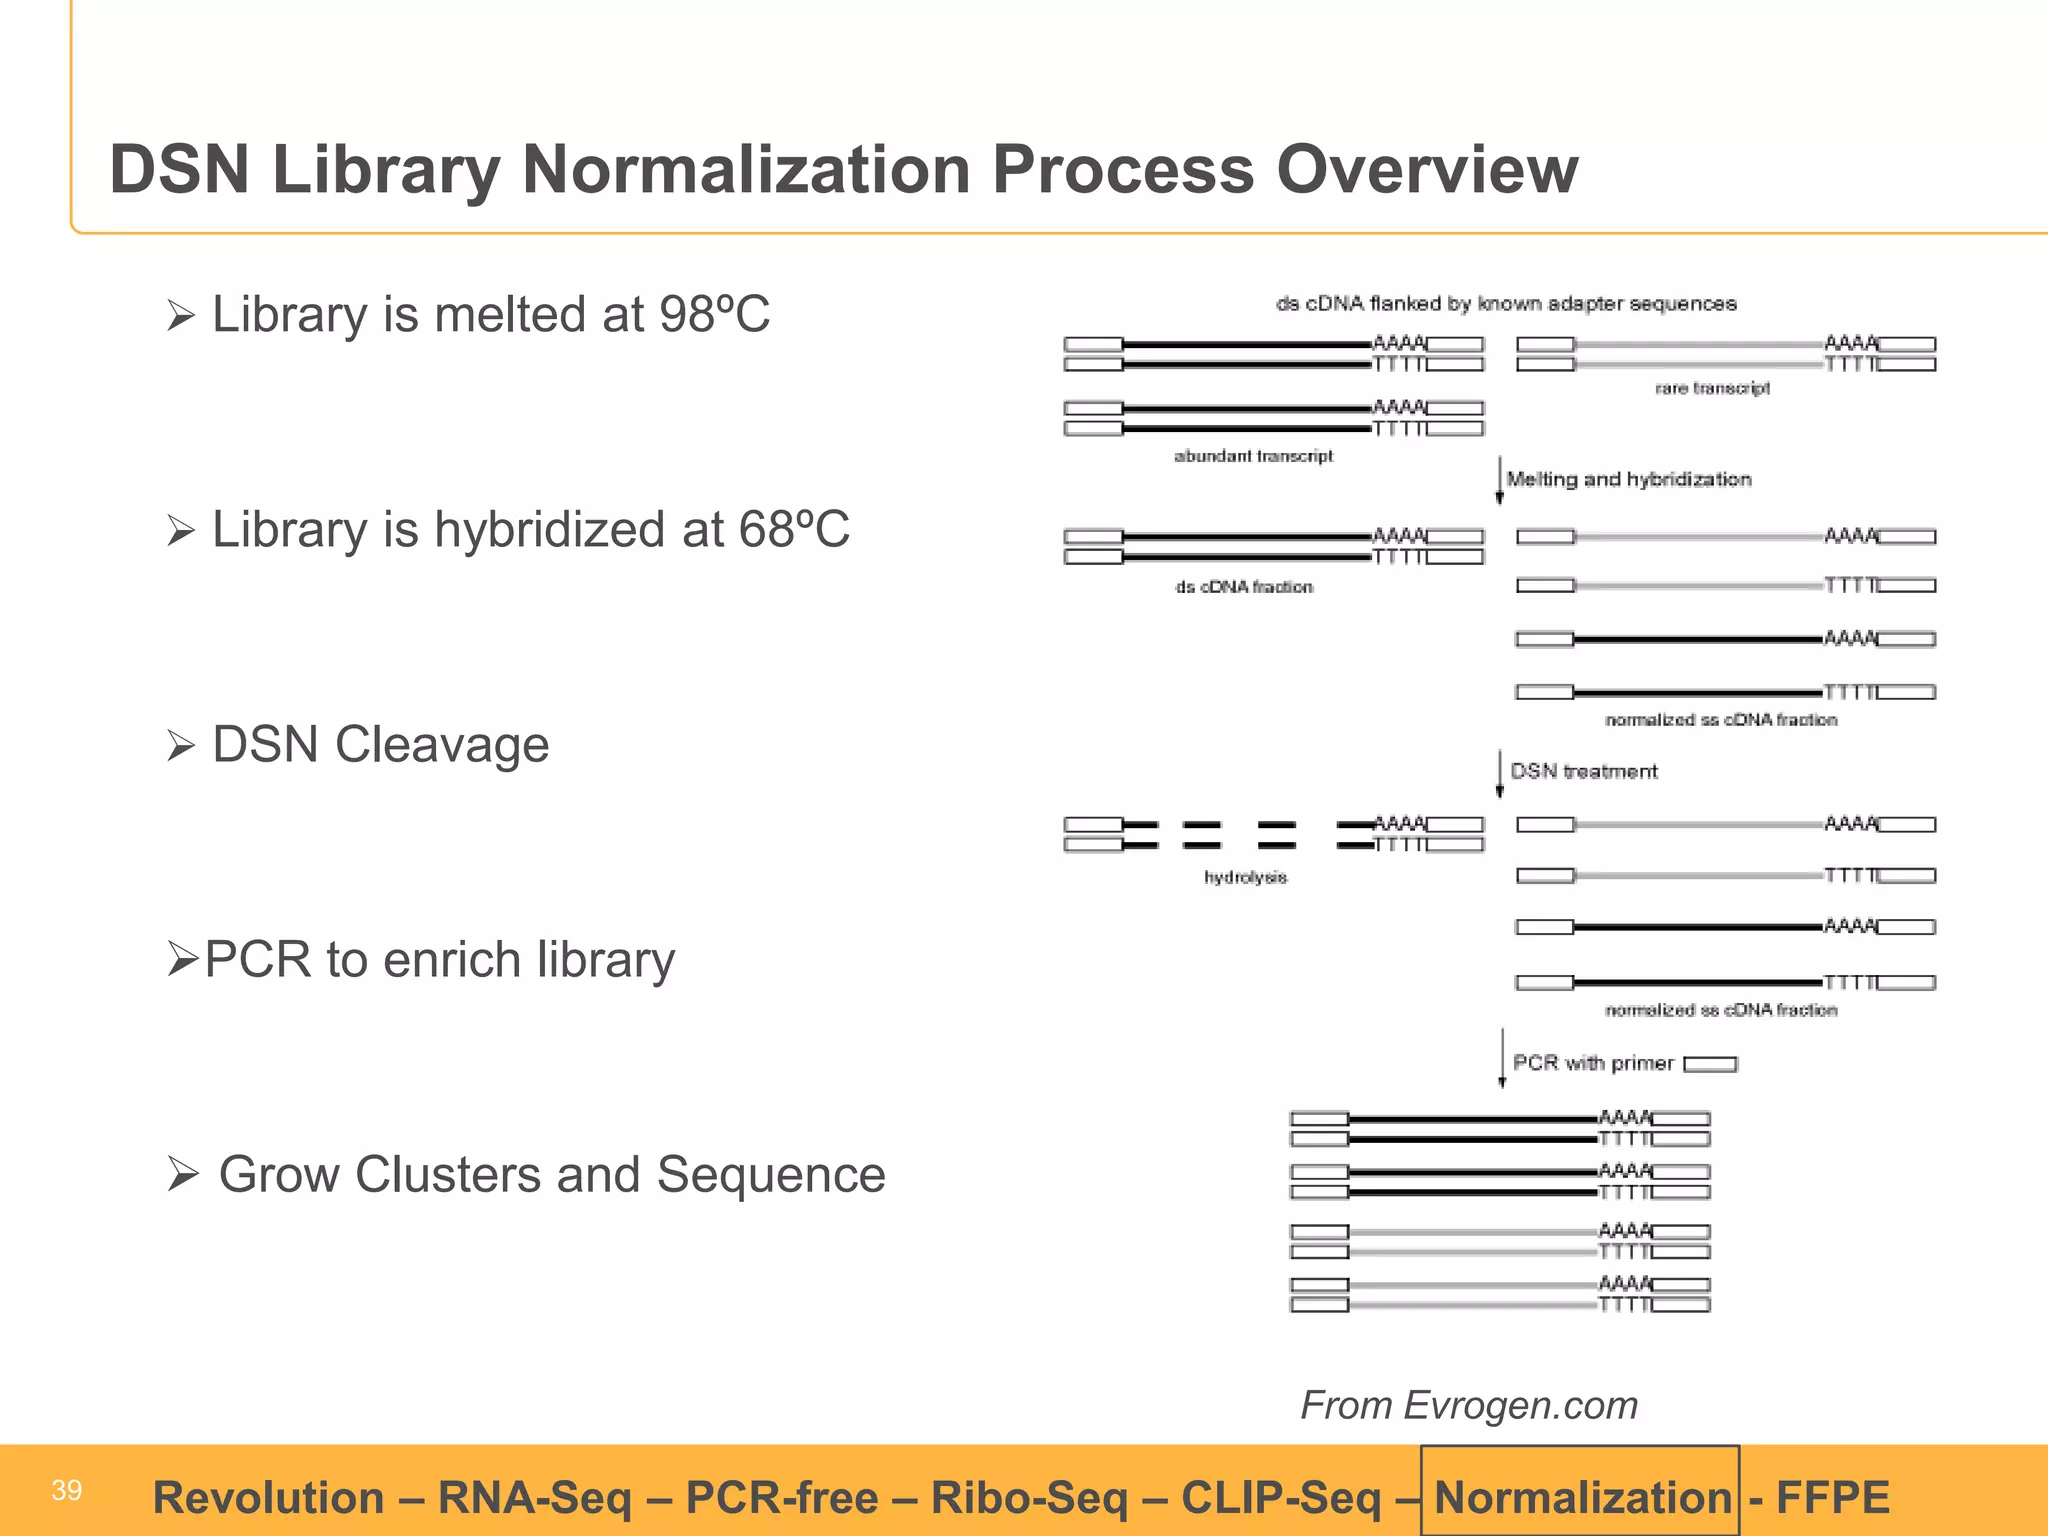
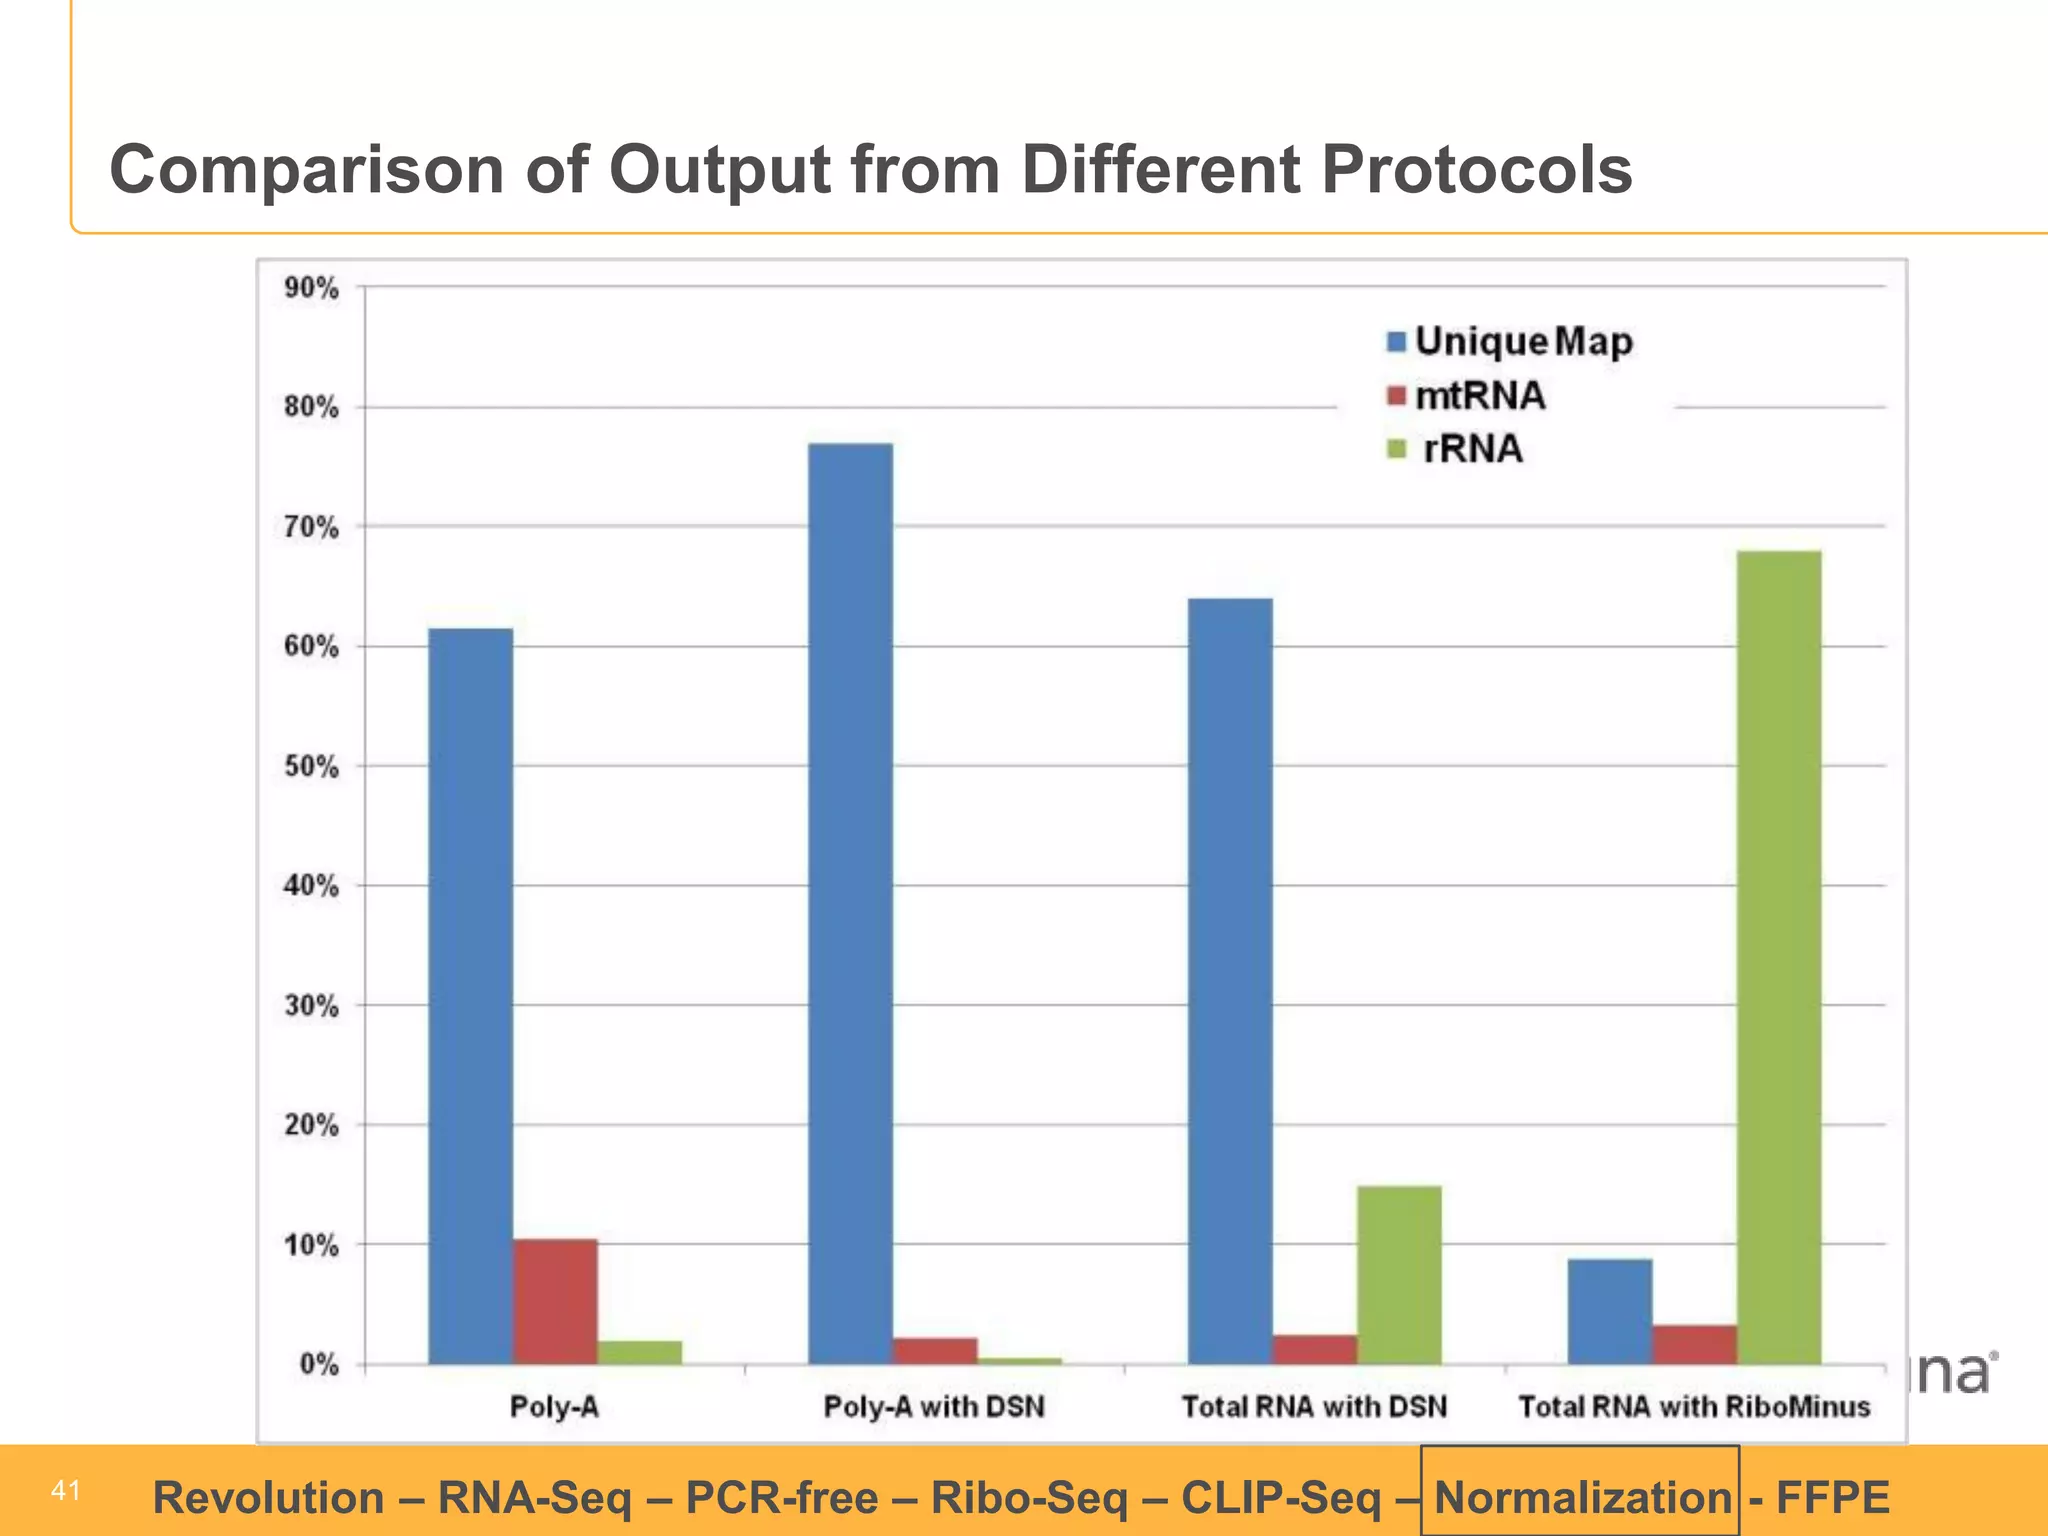
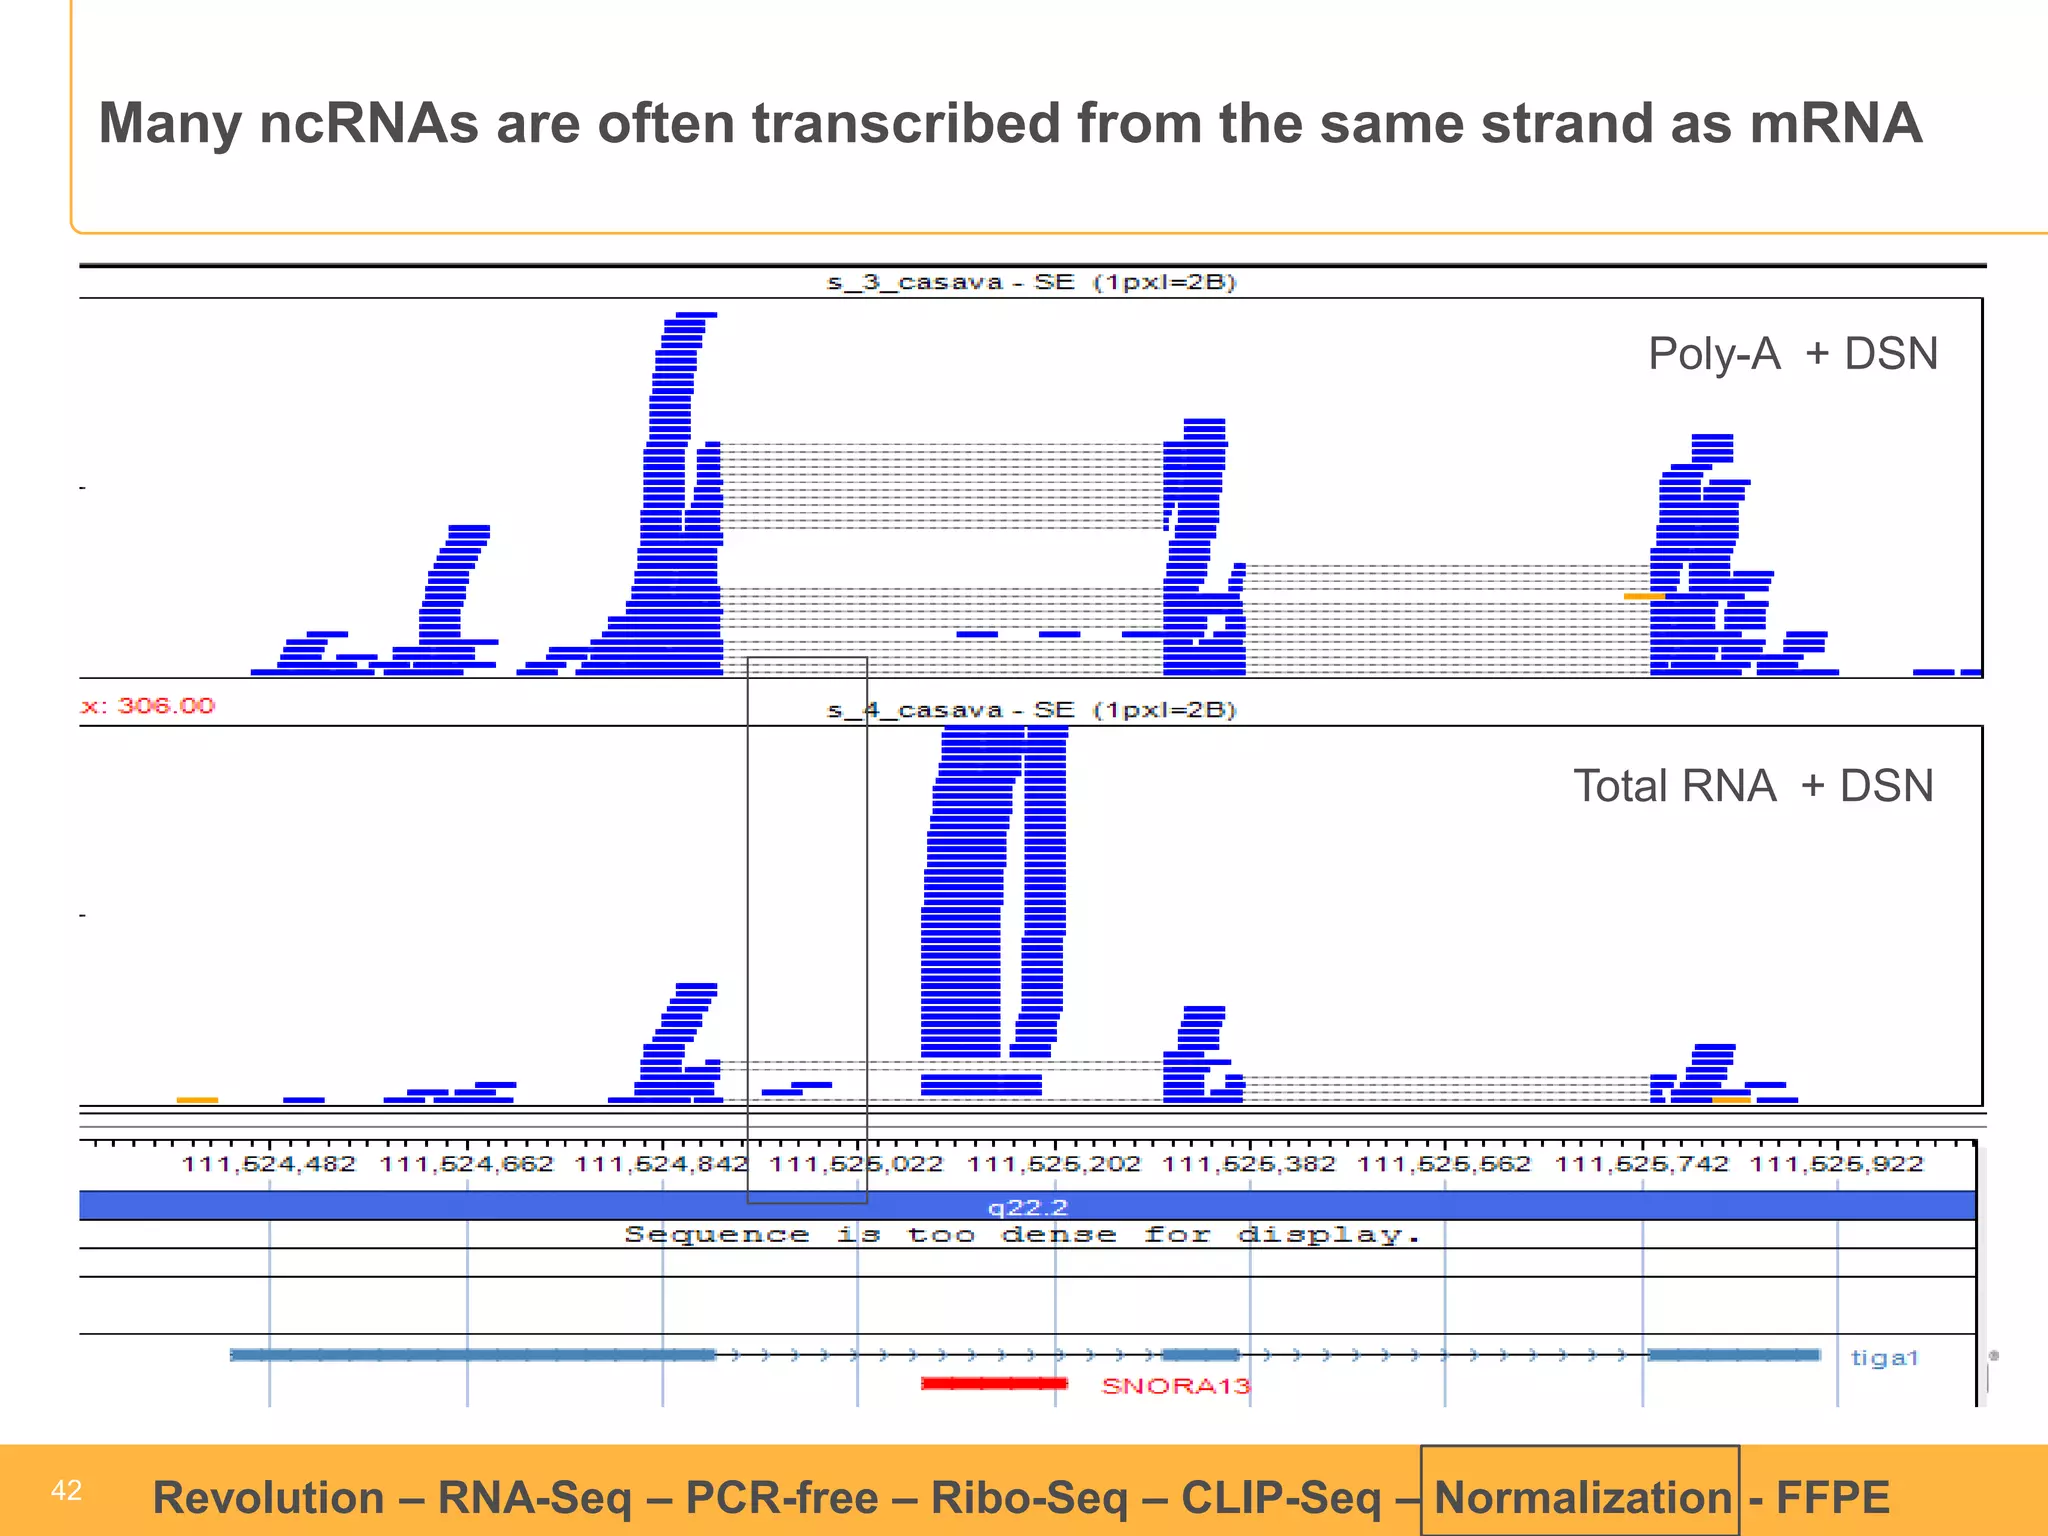
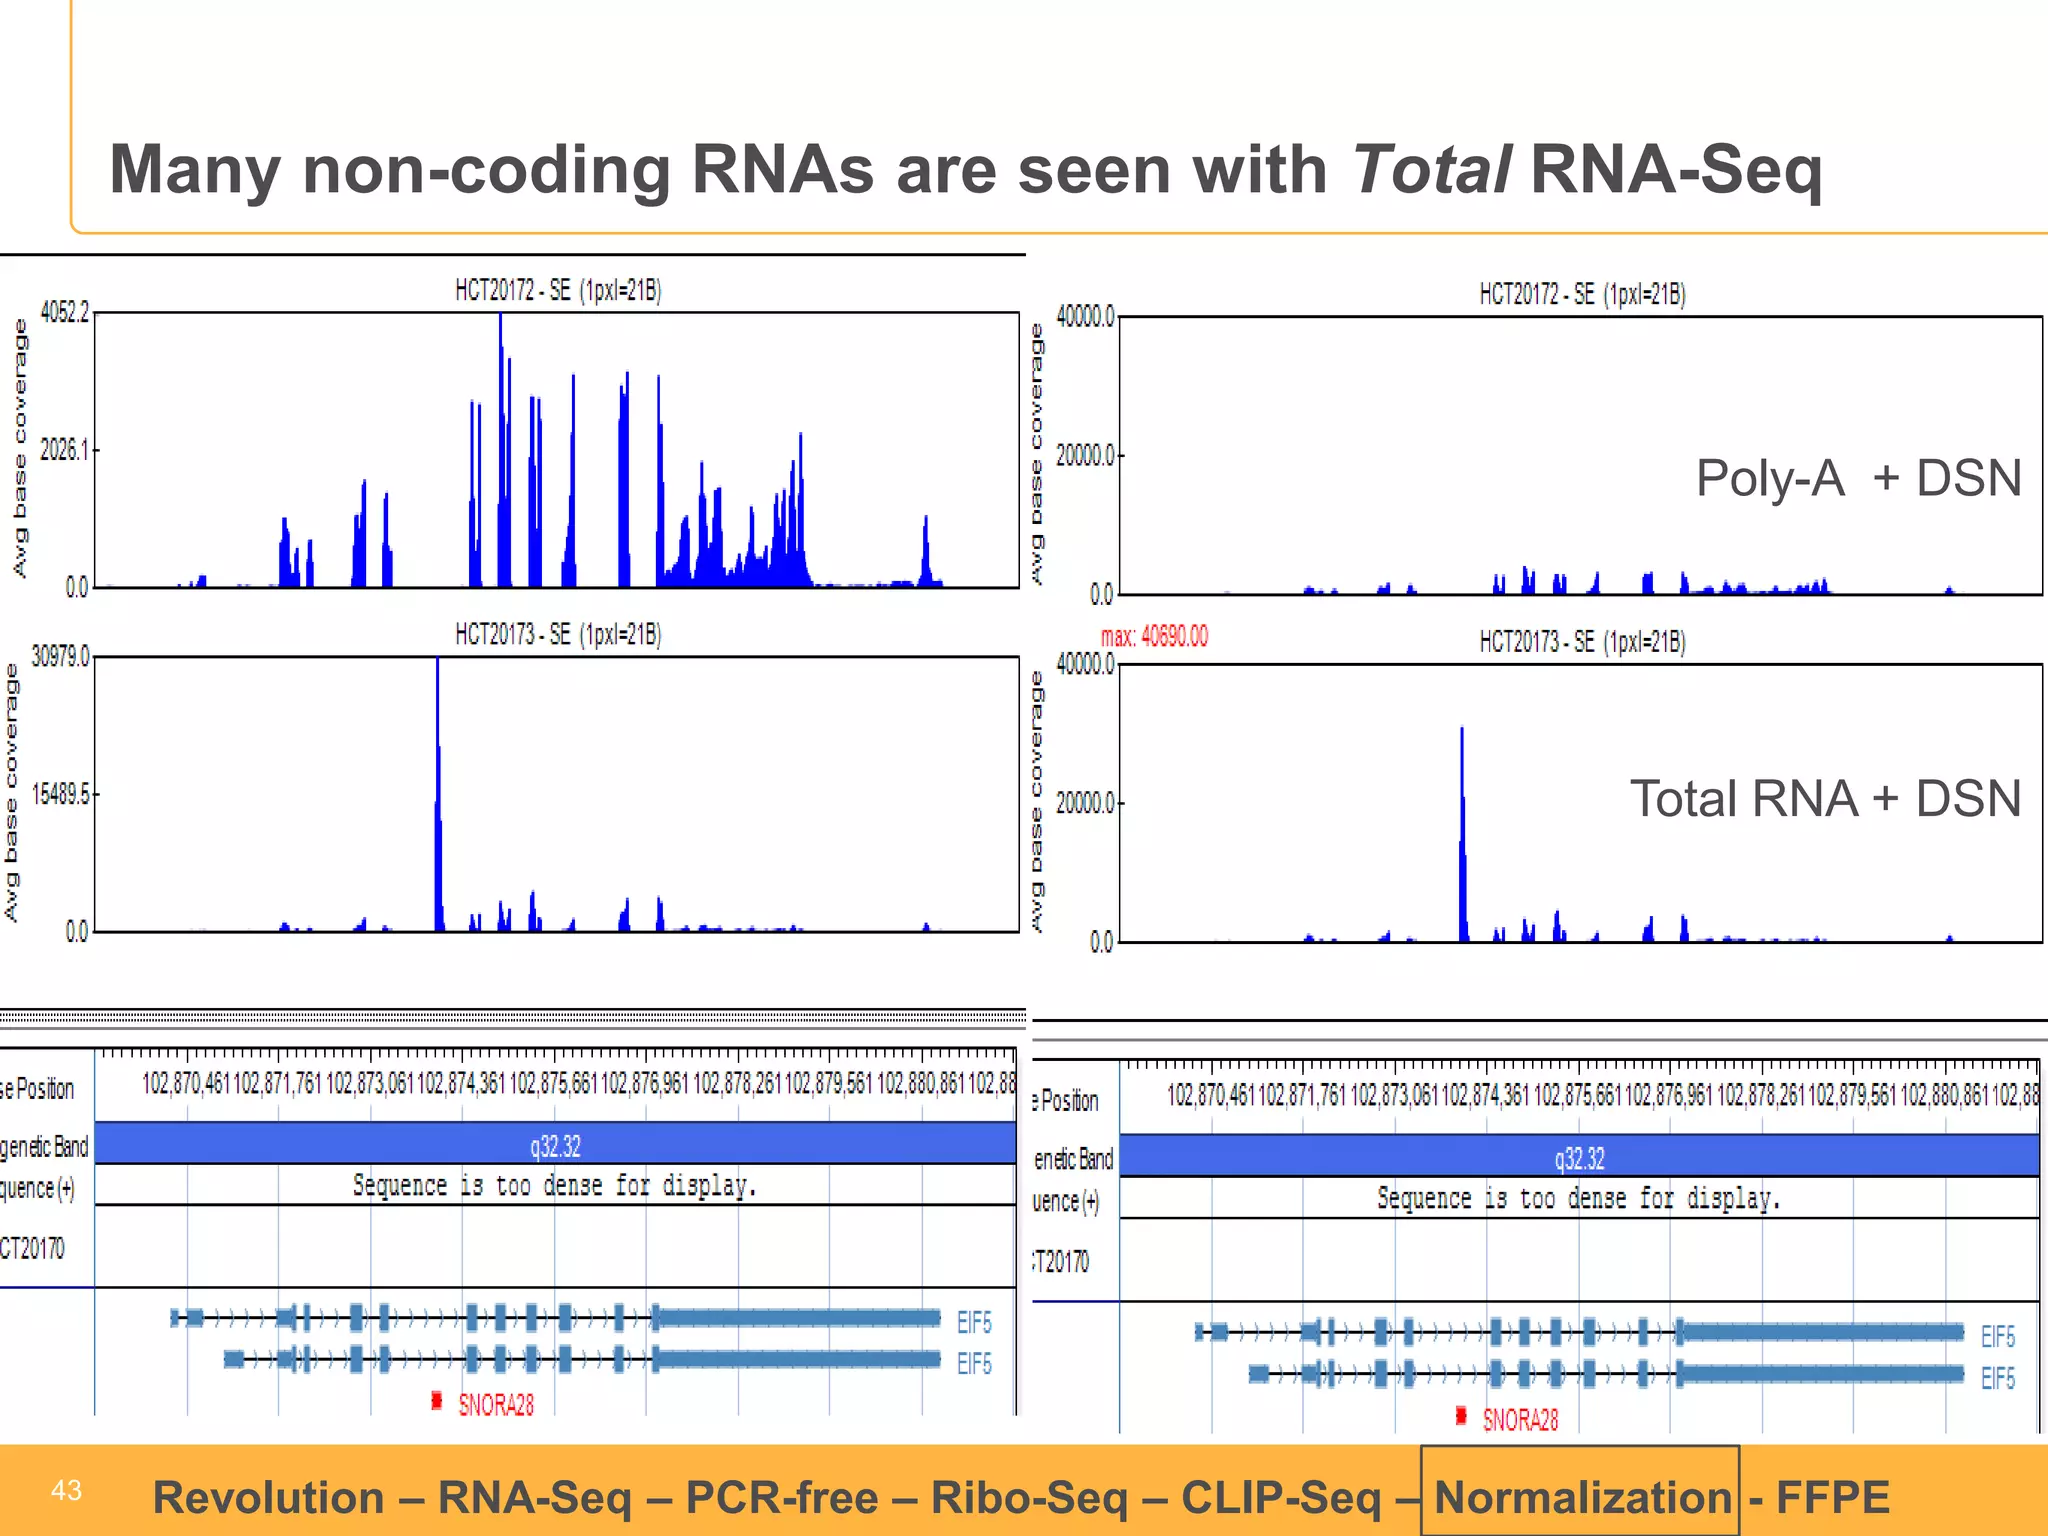
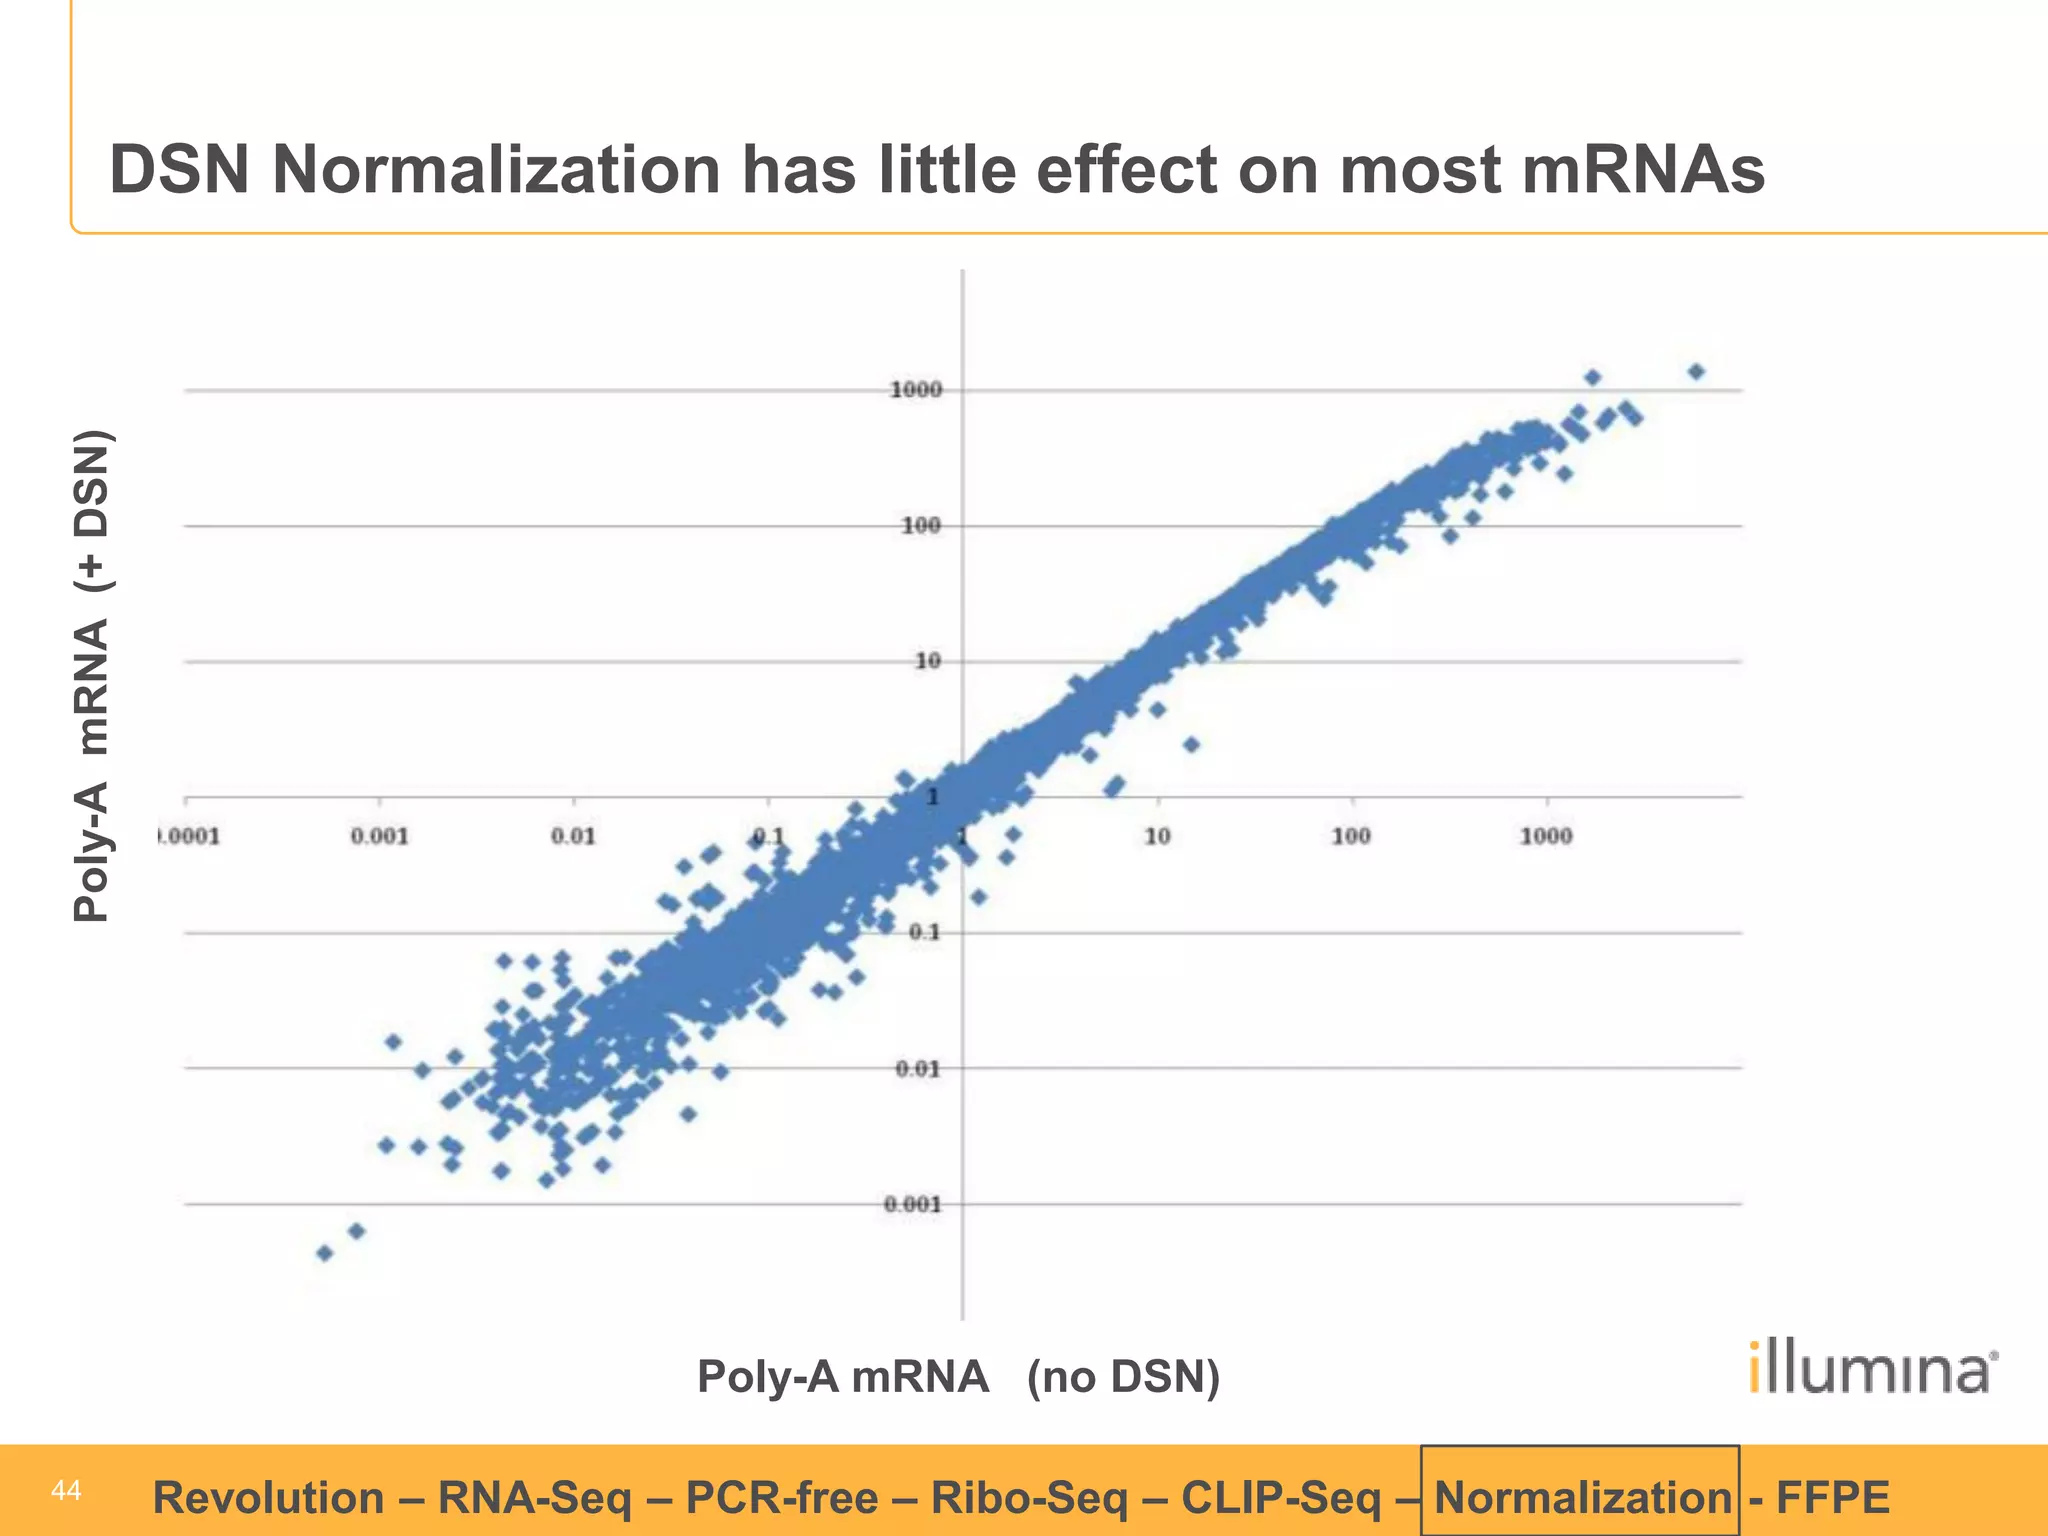
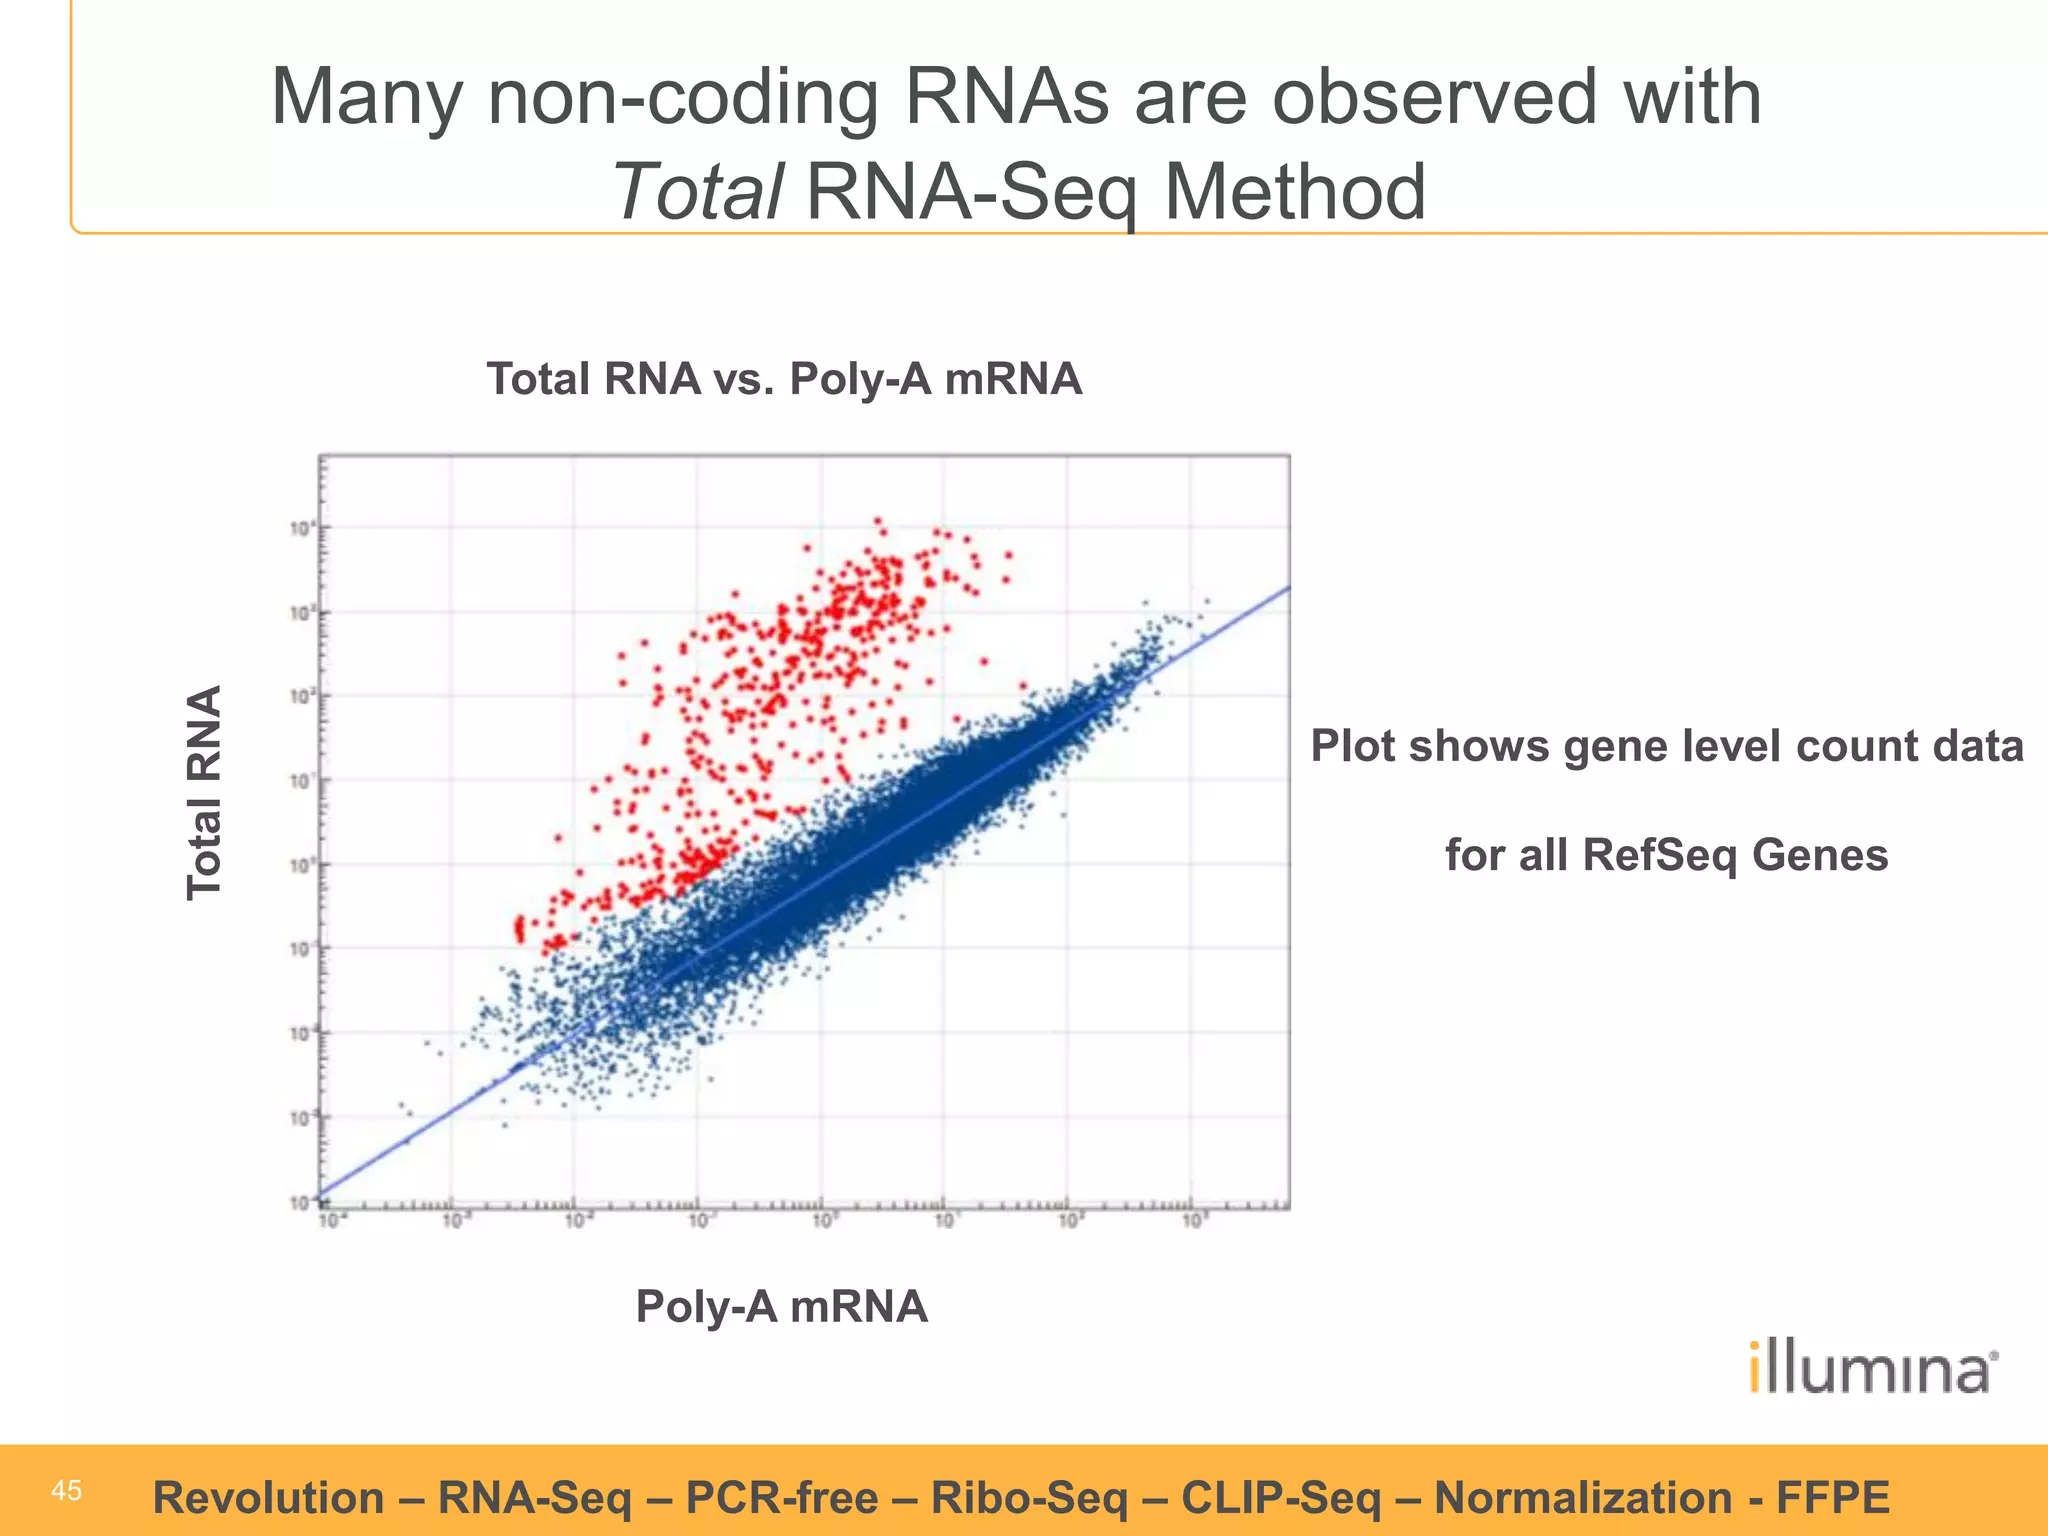
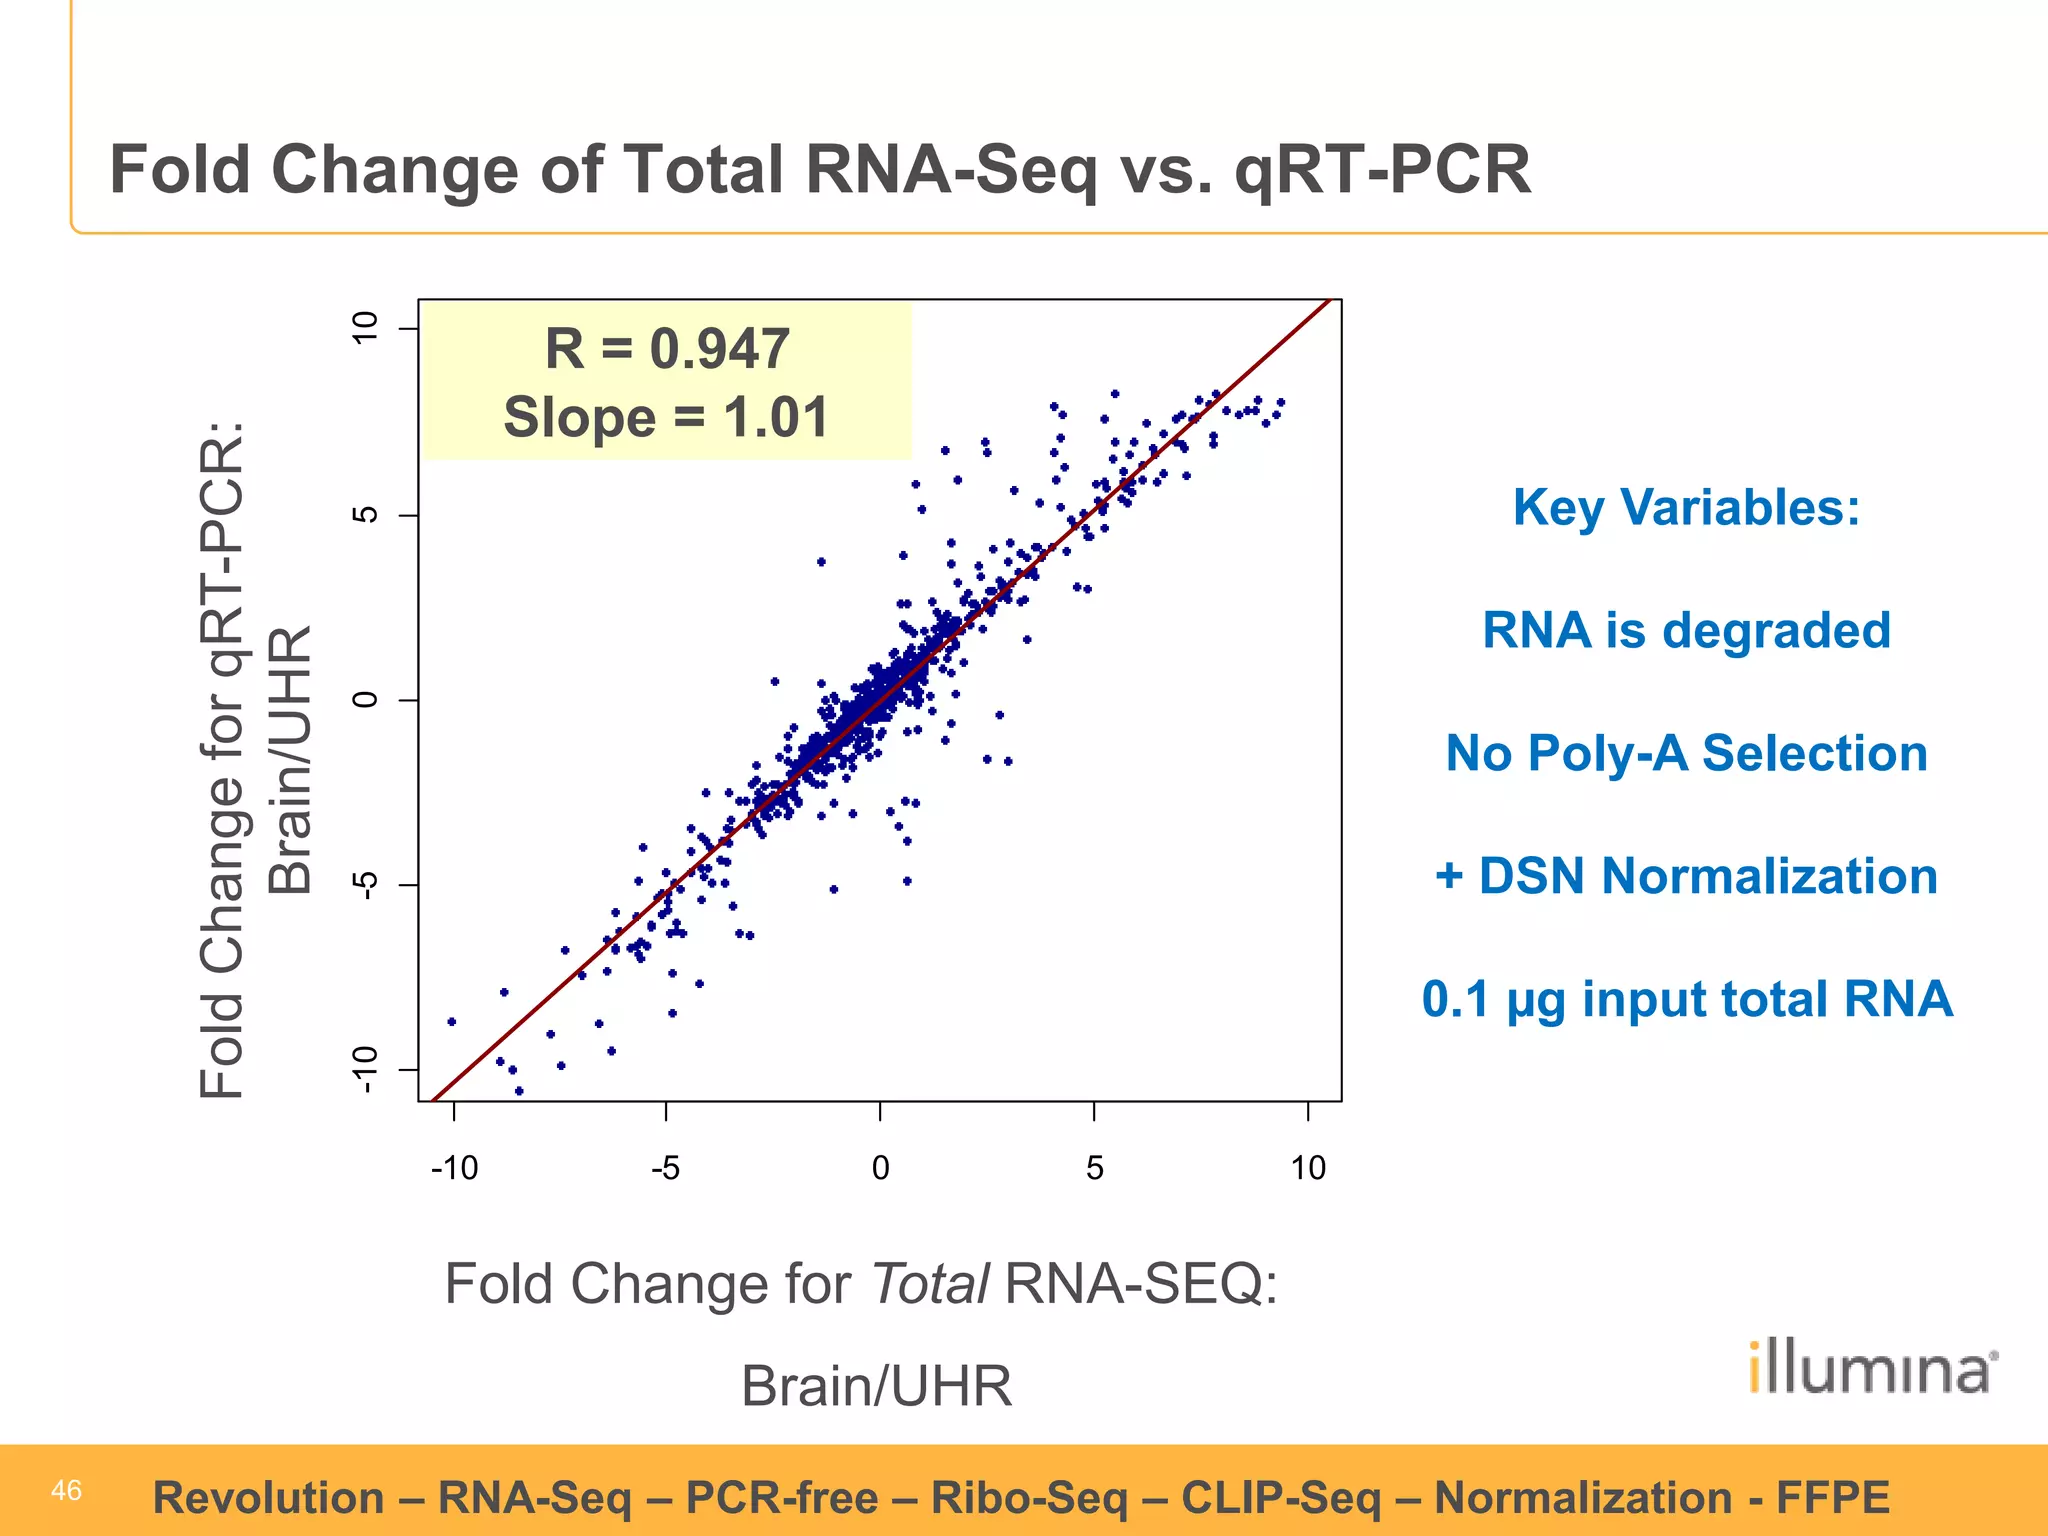
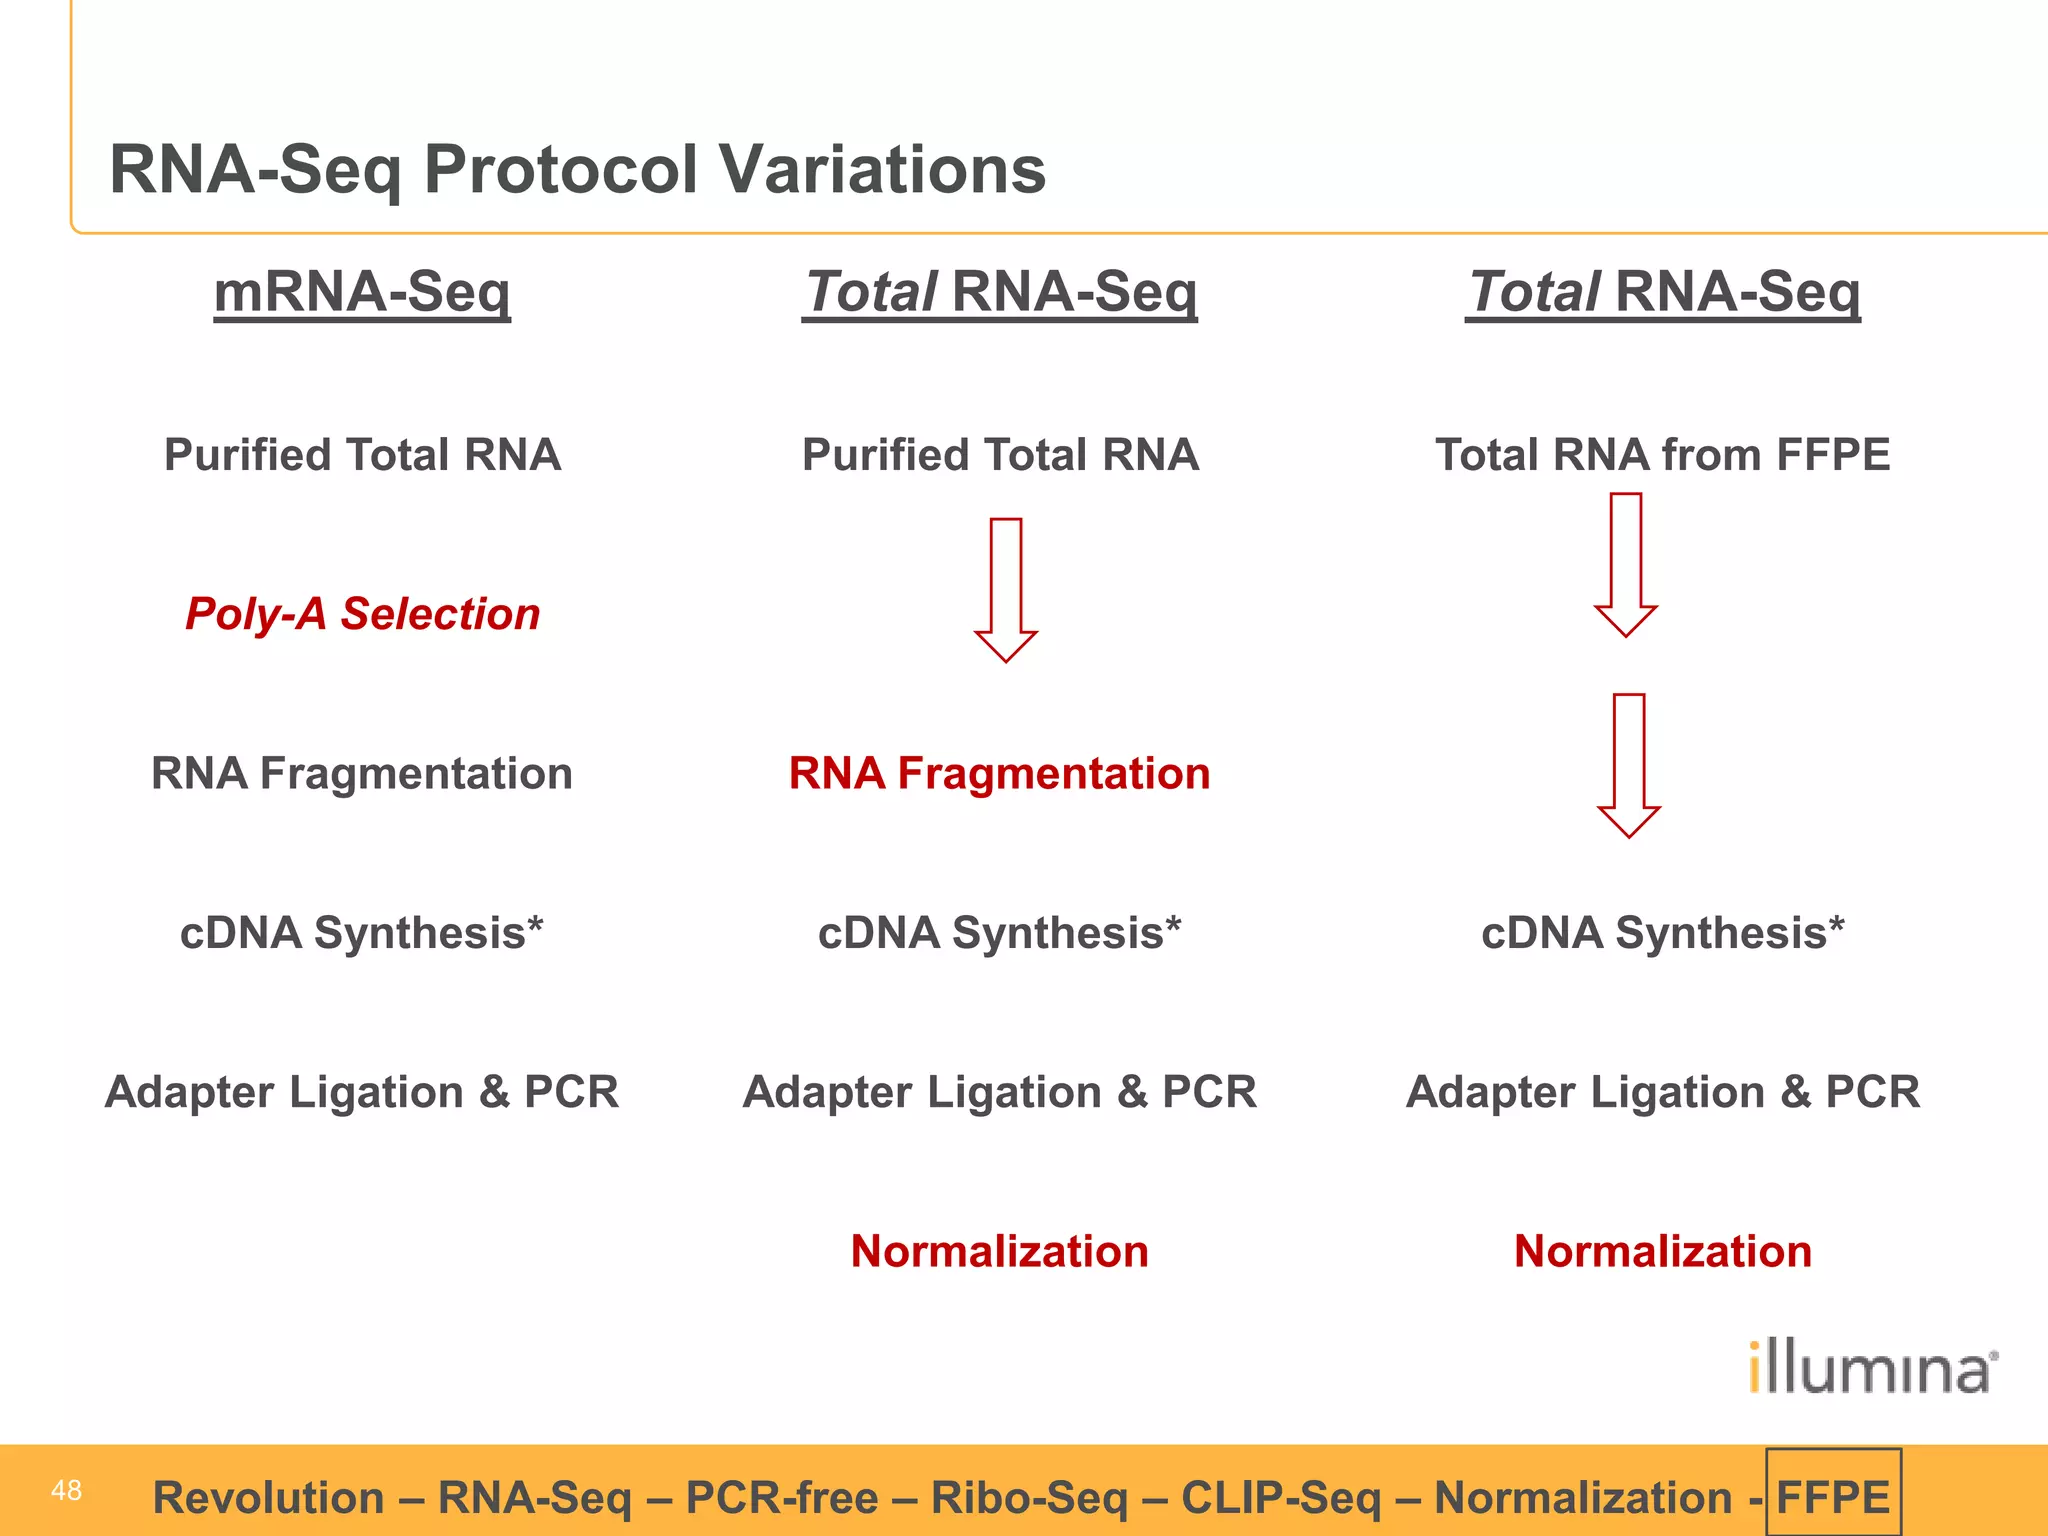
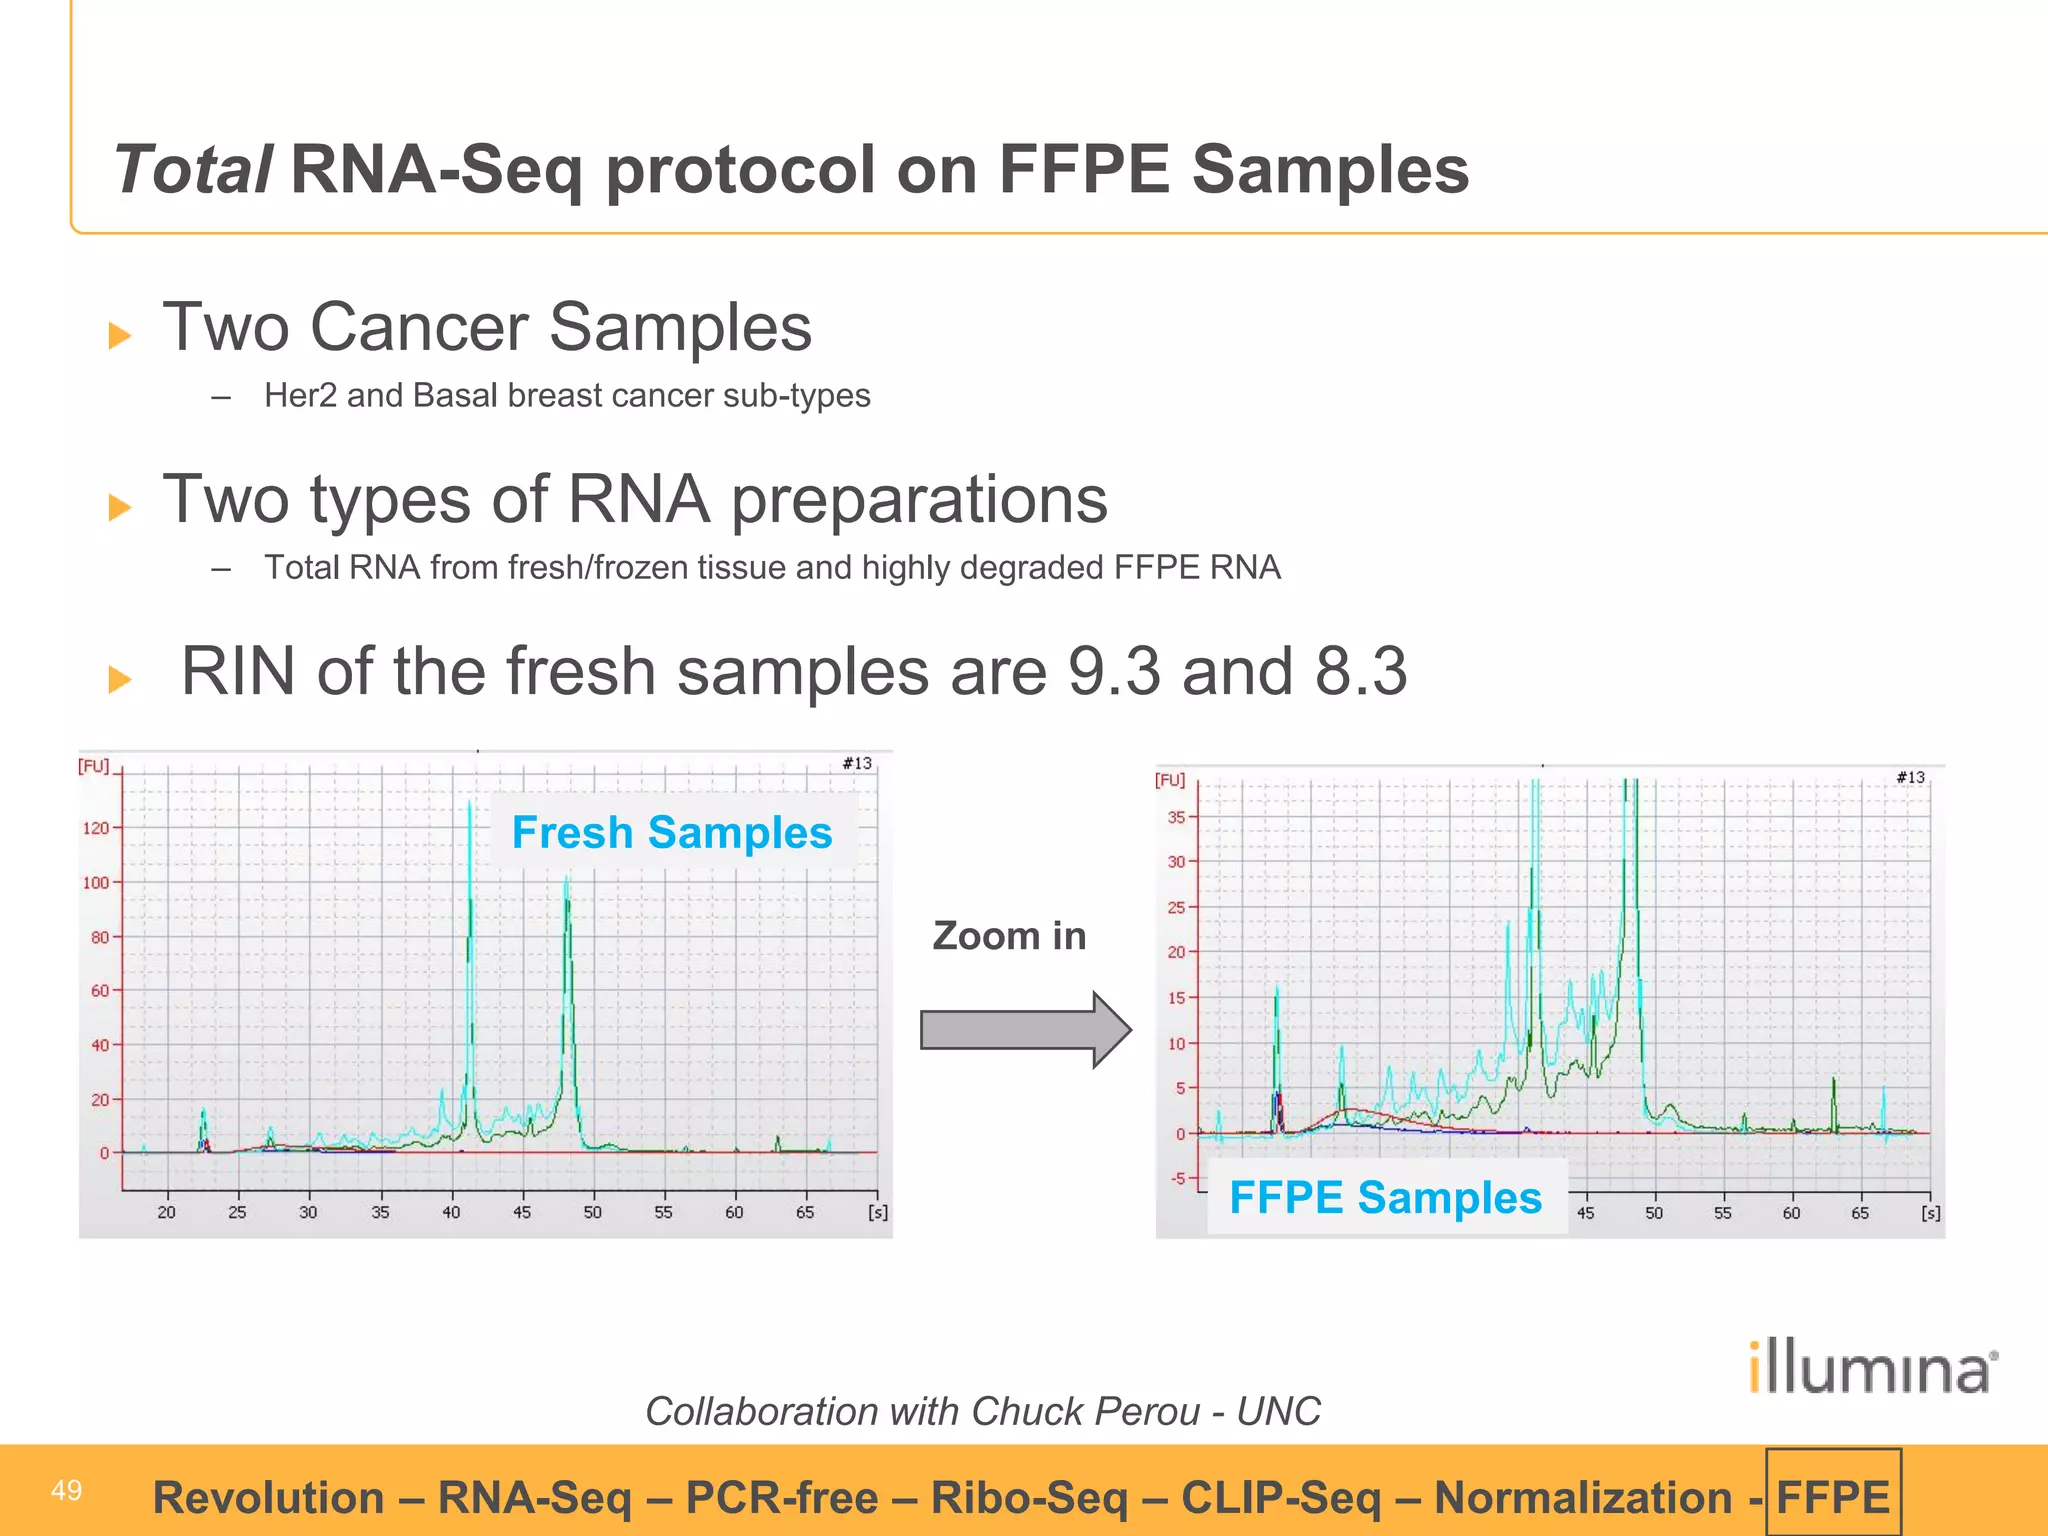
© 2009 Illumina, Inc. All rights reserved. 
Illumina, illuminaDx, Solexa, Making Sense Out of Life, Oligator, Sentrix, GoldenGate, GoldenGate Indexing, DASL, BeadArray, Array of Arrays, Infinium, BeadXpress, VeraCode, IntelliHyb, iSelect, CSPro, and GenomeStudio are registered trademarks or trademarks of Illumina, Inc. All other brands and names contained herein are the property of their respective owners. 
Welcome! 
Abizar Lakdawalla, PhD 
alakdawalla@illumina.com 
•Pervasive transcription 
•Antisense transcription 
•Non-coding RNA 
•Promoter associated RNA 
•Micro-RNA/mRNA targets 
•Enhancer RNAs 
•Gene fusions 
Transcriptome sequencing 
Goodbye! 
Arrays
2 
2 
Revolution –RNA-Seq–PCR-free –Ribo-Seq–CLIP-Seq–Normalization -FFPE 
Human Genome circa2010
3 
3 
Revolution –RNA-Seq–PCR-free –Ribo-Seq–CLIP-Seq–Normalization -FFPE
4 
4 
Revolution –RNA-Seq–PCR-free –Ribo-Seq–CLIP-Seq–Normalization -FFPE 
RNA families 
RNA 
Coding 
PolyA 
mRNA 
Non-PolyA 
mRNA 
Non-coding 
StructuralDNA associated 
Replisome 
DNA Repair 
Telomeric 
DNA methylation 
(piRNA) 
RNA associated 
Ribosome associated 
rRNA 
Regulatory 
Micro RNA 
TSS associated 
Anti-sense 
Enhancer RNA
5 
5 
Revolution –RNA-Seq–PCR-free –Ribo-Seq–CLIP-Seq–Normalization -FFPE 
Genome Analyzer Transcriptional Analysis 
RNA from mitochondria 
RNA from nucleus 
RNA from cytoplasm 
Sub-fractionate the RNA 
•Poly-A RNA 
•RNA without rRNA 
•RNA without … 
Sequence the whole RNA 
Tag Sequence 
(a snippet)
6 
6 
Revolution –RNA-Seq–PCR-free –Ribo-Seq–CLIP-Seq–Normalization -FFPE 
Tag Sequencing 
AAAAA 
mRNA / Total RNA 
Sequencing Adapter Ligation 
GATC 
AAAAA 
TTTTT- 
CTAGMmeI 
AAAAA 
TTTTT- 
1stand 2ndStrand cDNA Synthesis 
Restriction Enzyme Digestion 
GATC 
AAAAA 
TTTTT-
7 
7 
Revolution –RNA-Seq–PCR-free –Ribo-Seq–CLIP-Seq–Normalization -FFPE 
2ndPrimer Addition 
via PCR 
Seq. Primer 
Primer 
Tag 
Primer 
Digital Tag mRNA Sample Preparation 
GATC 
AAAAA 
TTTTT- 
CTAG 
MmeI 
NN 
MmeI Digestion 
Ligation of 
1stPrimer 
NN 
NN
8 
8 
Revolution –RNA-Seq–PCR-free –Ribo-Seq–CLIP-Seq–Normalization -FFPE 
Gene Expression 
250 samples per run (HiSeq 2000)
9 
9 
Revolution –RNA-Seq–PCR-free –Ribo-Seq–CLIP-Seq–Normalization -FFPE 
RNA-Seq: Method 
AAAA AAAAAAA AAAAAA 
Illumina Sequencing 
cDNAsample 
Genome position 
Relative # of reads
10 
10 
Revolution –RNA-Seq–PCR-free –Ribo-Seq–CLIP-Seq–Normalization -FFPE 
We can calculate the expression ratio of any two samples at every region across the entire genome
11 
11 
Revolution –RNA-Seq–PCR-free –Ribo-Seq–CLIP-Seq–Normalization -FFPE
12 
12 
Revolution –RNA-Seq–PCR-free –Ribo-Seq–CLIP-Seq–Normalization -FFPE 
mRNA-SeqData is Information RichmRNA Expression ProfilingAlternative Splicing Analysis Analysis of expressed SNPs and mutationsAnalysis of Allelic-specific ExpressionChimericTranscript DiscoveryGene Discovery and Annotation
1133 Revolution – RNA-Seq – PCR-free – Ribo-Seq – CLIP-Seq – Normalization - FFPE 
Base Position 51,165,353 51,166,593 51,167,833 51,169,073 51,170,313 51,171,553 51,172,793 51,174,033 51,175,273 51,176,513 
Cytogenetic Band q13.13 
Sequence (+) Sequence is too dense for display. 
BCnormal_619K… 
KRT6A 
Base Position 151,798,793 151,800,683 151,802,573 151,804,463 151,806,353 151,808,243 151,810,133 151,812,023 151,813,913 
Cytogenetic Band q21.3 
Sequence (+) Sequence is too dense for display. 
BCnormal_619K… 
S100A2 
Base Position 56,150,388 56,152,598 56,154,808 56,157,018 56,159,228 56,161,438 56,163,648 56,165,858 56,168,068 
Cytogenetic Band q13.33 
Sequence (+) Sequence is too dense for display. 
BCnormal_619K… 
KLK6 
KLK6 
normal 
tumor 
KRT6A S100A2 KLK6
1144 Revolution – RNA-Seq – PCR-free – Ribo-Seq – CLIP-Seq – Normalization - FFPE 
Tissue-specific genes 
Base Position 125,121,475 125,121,905 125,122,335 125,122,765 125,123,195 125,123,625 125,124,055 125,124,485 125,124,915 
Cytogenetic Band q24.2 
Sequence (+) Sequence is too dense for display. 
adipose 
PATE1 
PATE1 Gene 
Prostate And Testis Expressed 1
15 
15 
Revolution –RNA-Seq–PCR-free –Ribo-Seq–CLIP-Seq–Normalization -FFPE 
Read Counts for All RefSeq Genes
16 
16 
Revolution –RNA-Seq–PCR-free –Ribo-Seq–CLIP-Seq–Normalization -FFPE 
RNA-seq and Microarray ComparedExpression levels are shown, as measured by RNA-Seqand tiling arrays for Saccharomycescerevisiaecells. Agree for genes with medium levels of expression, but correlation is very low for genes with either low or high expression levels.
17 
17 
Revolution –RNA-Seq–PCR-free –Ribo-Seq–CLIP-Seq–Normalization -FFPE 
Dynamic Range 
Accuracy and 
Sensitivity 
Performance of RNA sequencing is superior to other gene expression profiling methods
18 
18 
Revolution –RNA-Seq–PCR-free –Ribo-Seq–CLIP-Seq–Normalization -FFPE 
mRNA-Seq
19 
19 
Revolution –RNA-Seq–PCR-free –Ribo-Seq–CLIP-Seq–Normalization -FFPE 
Transcribed region of PMPCB gene is clearly longer than RefSeqannotation 
Overlapping of PMPCB and DNAJC2 genes on two strands
2200 Revolution – RNA-Seq – PCR-free – Ribo-Seq – CLIP-Seq – Normalization - FFPE 
30%
21 
21 
Revolution –RNA-Seq–PCR-free –Ribo-Seq–CLIP-Seq–Normalization -FFPE 
cSNP Analysis 
Homozygous 
Heterozygous
2222 Revolution – RNA-Seq – PCR-free – Ribo-Seq – CLIP-Seq – Normalization - FFPE 
Differential Allelic Expression
23 
23 
Revolution –RNA-Seq–PCR-free –Ribo-Seq–CLIP-Seq–Normalization -FFPE 
Read Counts for All RefSeq Exons
24 
24 
Revolution –RNA-Seq–PCR-free –Ribo-Seq–CLIP-Seq–Normalization -FFPE 
Transcriptome isoforms –
25 
25 
Revolution –RNA-Seq–PCR-free –Ribo-Seq–CLIP-Seq–Normalization -FFPE 
Making Sense“… studying transcription for a long time and never seen this kind of transcription before … but we also see a polymerase that appears to be pointing in the wrong direction.” - Seila/Sharp, MIT 
“The gene, in other words, is in an identity crisis.”
26 
26 
Revolution –RNA-Seq–PCR-free –Ribo-Seq–CLIP-Seq–Normalization -FFPE 
Gene Fusions
27 
27 
Revolution –RNA-Seq–PCR-free –Ribo-Seq–CLIP-Seq–Normalization -FFPE
28 
28 
Revolution –RNA-Seq–PCR-free –Ribo-Seq–CLIP-Seq–Normalization -FFPE 
Foxa2 Binds in Unknown Regions 
… two remote peaks in regions containing no known genes. The first peak (unknown #4) lies close to a mouse EST, while the second peak (unknown #5) overlaps and is close to highly conserved sequence regions.
29 
29 
Revolution –RNA-Seq–PCR-free –Ribo-Seq–CLIP-Seq–Normalization -FFPE
30 
30 
Revolution –RNA-Seq–PCR-free –Ribo-Seq–CLIP-Seq–Normalization -FFPE 
More to small RNA than known microRNAsmiRNA Fragment 
Potential 
Novel Content 
rRNA, tRNA, adaptor contamination 
Standard Protocol:<3% 
sRNA v1.5 30 nt band: 6% 
sRNA v1.5 22 nt band:8% 
Non-coding RNA Fragment
31 
31 
Revolution –RNA-Seq–PCR-free –Ribo-Seq–CLIP-Seq–Normalization -FFPE 
More to small RNAs ...
32 
32 
Revolution –RNA-Seq–PCR-free –Ribo-Seq–CLIP-Seq–Normalization -FFPE 
Identification of micro-RNA targetsHenderson, 2009
33 
33 
Revolution –RNA-Seq–PCR-free –Ribo-Seq–CLIP-Seq–Normalization -FFPE 
ArgonauteHITS-CLIP decodes microRNA- mRNA interaction maps. Chi SW, ZangJB, MeleA, Darnell RB. Nature (2009) 460: 479-86. 
Covalently crosslink native argonauteprotein–RNA gives you Ago–miRNAand Ago–mRNA binding sites. 
Ago-mRNA tags to genome
3344 Revolution – RNA-Seq – PCR-free – Ribo-Seq – CLIP-Seq – Normalization - FFPE 
Ribo-Seq. 
RNA engaged in translation 
Ribo-Seq 
RNA-Seq
35 
35 
Revolution –RNA-Seq–PCR-free –Ribo-Seq–CLIP-Seq–Normalization -FFPE 
RNA Normalization
36 
36 
Revolution –RNA-Seq–PCR-free –Ribo-Seq–CLIP-Seq–Normalization -FFPE 
Genome Analyzer Transcriptional Analysis 
RNA from mitochondria 
RNA from nucleus 
RNA from cytoplasm 
Sub-fractionate the RNA 
•Poly-A RNA 
•RNA without rRNA 
•RNA without … 
Sequence the whole RNA 
Tag Sequence 
(a snippet)
37 
37 
Revolution –RNA-Seq–PCR-free –Ribo-Seq–CLIP-Seq–Normalization -FFPE 
Cot Curves and cDNA Normalization 
rRNA 
mtRNA 
mRNA
38 
38 
Revolution –RNA-Seq–PCR-free –Ribo-Seq–CLIP-Seq–Normalization -FFPE 
Double strand nuclease normalization 
mRNA-Seq 
Purified Total RNA 
Poly-A Selection 
RNA Fragmentation 
cDNA Synthesis* 
Adapter Ligation & PCR 
Total RNA-Seq 
Purified Total RNA 
RNA Fragmentation 
cDNA Synthesis* 
Adapter Ligation & PCR 
DSN Normalization
39 
39 
Revolution –RNA-Seq–PCR-free –Ribo-Seq–CLIP-Seq–Normalization -FFPE 
DSN Library Normalization Process Overview 
From Evrogen.com 
Library is melted at 98ºC 
Library is hybridized at 68ºC 
DSN Cleavage 
PCR to enrich library 
Grow Clusters and Sequence
40 
40 
Revolution –RNA-Seq–PCR-free –Ribo-Seq–CLIP-Seq–Normalization -FFPE 
Total RNA-SeqMethod OverviewRNA from any organism –bacteria, plants, animalsLess than 100 nanogramsof total RNAFull-length cDNA coverage ofall RNA moleculesWorks with low quality RNA –even FFPE preparationsNormalization protocol can be used with most RNA-Seqprotocols
41 
41 
Revolution –RNA-Seq–PCR-free –Ribo-Seq–CLIP-Seq–Normalization -FFPE 
Comparison of Output from Different Protocols
42 
42 
Revolution –RNA-Seq–PCR-free –Ribo-Seq–CLIP-Seq–Normalization -FFPE 
Many ncRNAsare often transcribed from the same strand as mRNA 
Poly-A + DSN 
Total RNA + DSN
43 
43 
Revolution –RNA-Seq–PCR-free –Ribo-Seq–CLIP-Seq–Normalization -FFPE 
Total RNA + DSN 
Poly-A + DSN 
Many non-coding RNAs are seen with TotalRNA-Seq
44 
44 
Revolution –RNA-Seq–PCR-free –Ribo-Seq–CLIP-Seq–Normalization -FFPE 
DSN Normalization has little effect on most mRNAs 
Poly-A mRNA (no DSN) 
Poly-A mRNA (+ DSN)
45 
45 
Revolution –RNA-Seq–PCR-free –Ribo-Seq–CLIP-Seq–Normalization -FFPE 
Plot shows gene level count data for all RefSeqGenes 
Total RNA vs. Poly-A mRNA 
Many non-coding RNAs are observed with 
Total RNA-SeqMethod 
Total RNA 
Poly-A mRNA
4466 Revolution – RNA-Seq – PCR-free – Ribo-Seq – CLIP-Seq – Normalization - FFPE 
-10 -5 0 5 10 
-10 -5 0 5 10 
Log2 sequencing count ratio (brain vs UHR) 
Log2 qPCR ratio (brain vs UHR) 
R = 0.947 
Slope = 1.01 
Fold Change for qRT-PCR: 
Brain/UHR 
Fold Change for Total RNA-SEQ: 
Brain/UHR 
Key Variables: 
RNA is degraded 
No Poly-A Selection 
+ DSN Normalization 
0.1 μg input total RNA 
Fold Change of Total RNA-Seq vs. qRT-PCR
47 
47 
Revolution –RNA-Seq–PCR-free –Ribo-Seq–CLIP-Seq–Normalization -FFPE 
RNA-Seqin FFPE
48 
48 
Revolution –RNA-Seq–PCR-free –Ribo-Seq–CLIP-Seq–Normalization -FFPE 
RNA-SeqProtocol Variations 
mRNA-Seq 
Purified Total RNA 
Poly-A Selection 
RNA Fragmentation 
cDNA Synthesis* 
Adapter Ligation & PCR 
Total RNA-Seq 
Purified Total RNA 
RNA Fragmentation 
cDNA Synthesis* 
Adapter Ligation & PCR 
NormalizationTotalRNA-SeqTotal RNA from FFPEcDNA Synthesis* Adapter Ligation & PCRNormalization
49 
49 
Revolution –RNA-Seq–PCR-free –Ribo-Seq–CLIP-Seq–Normalization -FFPE 
Zoom in 
Collaboration with Chuck Perou -UNC 
Total RNA-Seqprotocol on FFPE SamplesTwo Cancer Samples 
–Her2 and Basal breast cancer sub-typesTwo types of RNA preparations 
–Total RNA from fresh/frozen tissue and highly degraded FFPE RNARIN of the fresh samples are 9.3 and 8.3 
Fresh Samples 
FFPE Samples
5500 Revolution – RNA-Seq – PCR-free – Ribo-Seq – CLIP-Seq – Normalization - FFPE 
10 -2 10 -1 10 0 10 1 10 2 10 3 10 4 
s5_csv1.7_c Counts 
s1_csv1.7_c Counts vs s5_csv1.7_c Counts 
10-2 
10-1 
100 
101 
102 
103 
104 
s1_csv1.7_c Counts 
R2 = 0.89 
FFPE Total RNA-Seq vs. Fresh Total RNA-Seq 
Pair-wise Comparison of FFPE
51 
51 
Revolution –RNA-Seq–PCR-free –Ribo-Seq–CLIP-Seq–Normalization -FFPE 
MUCL1(mucin-like 1 gene) 
FFPE -Basal 
FFPE -Her2 
Fresh mRNA –Basal 
Fresh mRNA -Her2 
Fresh Total RNA -Basal 
Fresh Total RNA –Her2 
Fresh Total RNA -Basal 
Fresh Total RNA –Her2 
Replicate 1 
Replicate 2
52 
52 
Revolution –RNA-Seq–PCR-free –Ribo-Seq–CLIP-Seq–Normalization -FFPE 
Whole Transcriptome Studies on HiSeq 2000 System 
Format 
PF reads 
Average Error Rates (PhiXspike-ins) 
Yield 
Individual human tissues 
2 X 50 
2.55 B 
0.22%, 0.44% 
>120 Gbin <5 days 
Individual human tissues 
1 X 75 
1.27 B 
0.37%, 0.52% 
>95 Gbin <4 days 
Total human transcriptome 
1 X 100 
1.19 B 
0.67%, 0.81% 
>115 Gbin <5 days 
Body Map 2.0 ProjectAdrenal, Adipose, Brain, Breast, Colon, Heart, Kidney, Liver, Lung, Lymph Node, Ovary, Prostate, Skeletal Muscle, Testis, Thyroid, White Blood Cells 
INDIVIDUAL HUMAN TISSUES 
16 tissues, 1 lane per tissue 
Standard Poly-A mRNA-SeqLibrary Preps 
TOTAL HUMAN TRANSCRIPTOME 
Equal Mixture of 16 Human Tissues 
Strand-specific mRNA-Seq 
SUMMARY OF RUN METRICS
53 
53 
Revolution –RNA-Seq–PCR-free –Ribo-Seq–CLIP-Seq–Normalization -FFPE 
PCR-free
54 
54 
Revolution –RNA-Seq–PCR-free –Ribo-Seq–CLIP-Seq–Normalization -FFPE 
No PCR 
No PCR 
PCR 
PCR 
GAPDH
55 
55 
Revolution –RNA-Seq–PCR-free –Ribo-Seq–CLIP-Seq–Normalization -FFPE 
No PCR 
No PCR 
PCR 
PCR 
APOB
5566 Revolution – RNA-Seq – PCR-free – Ribo-Seq – CLIP-Seq – Normalization - FFPE 
No PCR vs PCR (15 cycles) 
10 0 10 1 10 2 10 3 10 4 10 5 
HCT10738 Counts (Raw) 
HCT10736 Counts (Raw) vs HCT10738 Counts (Raw) 
100 
101 
102 
103 
104 
105 
HCT10736 Counts (Raw) 
R2=0.9637
57 
57 
Revolution –RNA-Seq–PCR-free –Ribo-Seq–CLIP-Seq–Normalization -FFPE 
Thank you 
Summary 
RNA-Seq= more publications! 
DATA 
ANALYSES
58 
58 
Revolution –RNA-Seq–PCR-free –Ribo-Seq–CLIP-Seq–Normalization -FFPE 
Samples/flow cell and cost/sample (all consum.) 
GAIIe 
GAIIx 
HiScanSQ 
HiSeq 2000 
DGE (25bp, 2 million) 
60 
€230 
125 
€205 
125 
€204 
250 
€192 
RNA-Seq(75x2, 20 million) 
6 
€1585 
13 
€898 
13 
€835 
25 
€522 
ChIP-Seq(TF) 
125 
€252 
250 
€231 
250 
€229 
500 
€219 
Virus/BAC clones (100x2, 30x) 
2,770 
€209 
5,555 
€207 
5,555 
€207 
11,111 
€206 
Bact./GWAS (100x2, 30x) 
277 
€242 
556 
€224 
556 
€222 
1,111 
€214 
Huexome(100x2, 30x) 
28 
€568 
56 
€387 
56 
€368 
111 
€287 
Hugenome (100x2, 30x) 
0.28 
€36,444 
0.56 
€18,325 
0.56 
€16,436 
1.11 
€8,321 
€5,616 
@300Gb/run
59 
59 
Revolution –RNA-Seq–PCR-free –Ribo-Seq–CLIP-Seq–Normalization -FFPE1270 genes respond to beta-estradiol, includes several direct targets of Eralpha, organized in a gene regulation cascade, stemming from ligand-activated receptor and reaching a large number of downstream targets via AP-2gamma, B-cell activating transcription factor, E2F1 and 2, E74-like factor 3, GTF2IRD1, hairy and enhancer of split homologue-1, MYB, SMAD3, RARalpha, and RXRalphatranscription factors. MicroRNAsintegral components of this gene regulation network; miR-107, miR-424, miR-570, miR-618, and miR-760 are regulated by 17beta-estradiol along with other microRNAsthat can target a significant number of transcripts belonging to one or more estrogen- responsive gene clusters. 
Estrogen receptor alpha controls a gene network in luminal-like breast cancer cells comprising multiple transcription factors and microRNAs. CicatielloL … Am J Pathol(2010) 176: 2113-30.
6600 Revolution – RNA-Seq – PCR-free – Ribo-Seq – CLIP-Seq – Normalization - FFPE 
Genomic DNA 
X X 
Restriction Enzyme Digestion 
Size Selection (200+25bp) 
Bisulfite Treatment 
Sequence Ends of Selected Fragments 
Data Analysis 
200 +/- 25 bp 
Reduced Representation Bisulfite Seq
61 
61 
Revolution –RNA-Seq–PCR-free –Ribo-Seq–CLIP-Seq–Normalization -FFPE 
BC Cell Line RRBS Data -MMEL1 Gene 
MCF7 
ZR-75-1 
T47DBT474 
MDA-MB-231 
MDA-MB-468 
BT20 
MCF10A
62 
62 
Revolution –RNA-Seq–PCR-free –Ribo-Seq–CLIP-Seq–Normalization -FFPE 
BC Cell Line RRBS Data -CD247 Gene 
MCF7 
ZR-75-1T47D 
BT474 
MDA-MB-231 
MDA-MB-468 
BT20 
MCF10A
63 
63 
Revolution –RNA-Seq–PCR-free –Ribo-Seq–CLIP-Seq–Normalization -FFPE 
BC Cell Line RRBS Data -CDH13 Gene 
MCF7ZR-75-1 
T47D 
BT474 
MDA-MB-231 
MDA-MB-468 
BT20 
MCF10A
64 
64 
Revolution –RNA-Seq–PCR-free –Ribo-Seq–CLIP-Seq–Normalization -FFPE 
Correlation of RRBS and mRNA-SeqData for PRKD1 Gene 
chr14:29,027,620-29,554,515 PRKD1 gene methylation for 5’ CpG island region been dramatically changed and anti-correlates well with mRNA levels 
MCF7 
ZR-75-1T47D 
BT474 
MDA-MB-231 
MDA-MB-468 
BT20 
MCF10A 
109 
37 
0 
283 
0 
0 
0 
418 
mRNA levels 
BT474mRNA levels
65 
65 
Revolution –RNA-Seq–PCR-free –Ribo-Seq–CLIP-Seq–Normalization -FFPE 
Lung 
Breast 
CDH13(H-cadherin): increased methylation in lung tumor 
3% ave 
47% ave 
4% ave 
10% ave 
Study both individual CpG sites and CpG Islands
6666 Revolution – RNA-Seq – PCR-free – Ribo-Seq – CLIP-Seq – Normalization - FFPE 
CpG island sumMeth value in twins 
0 
5000 
10000 
15000 
20000 
25000 
30000 
35000 
0 5000 10000 15000 20000 25000 30000 35000 
twin1 
twin2 Twin 101 
Twin 001 
0 
5000 
10000 
15000 
20000 
25000 
30000 
35000 
0 5000 10000 15000 20000 25000 30000 35000 
normal breast 
Breabseta sCt taumnocr Ber 
Normal Breast 
0 
5000 
10000 
15000 
20000 
25000 
30000 
0 5000 10000 15000 20000 25000 30000 
lung normal 
lung tumor B 
Normal Lung 
Lung Cancer 
Comparison of Methylation Summarized for ~ 25K CpG Islands
67 
67 
Revolution –RNA-Seq–PCR-free –Ribo-Seq–CLIP-Seq–Normalization -FFPE 
Whole Genome Bisulfite Sequencing 
Reduced Representation Bisulfite Sequencing
68 
68 
Revolution –RNA-Seq–PCR-free –Ribo-Seq–CLIP-Seq–Normalization -FFPE 
CpG Island Methylation Changes & Pathways 
What are in these pathways that change? 
Top 3 Pathways by Enrichment 
cAMP-mediated Signaling 
(p = 2.09e-8) 
G-Protein Coupled Receptor Signaling 
(p = 4.17e-7) 
Axonal Guidance Signaling 
(p = 1.18e-6) Cell Death RelatedPathways 
Implication: increased methylation of cell death related pathways could promote cell growth and cancer progression
69 
69 
Revolution –RNA-Seq–PCR-free –Ribo-Seq–CLIP-Seq–Normalization -FFPE 
Experimental Data Available 
RNA-Seq 
50 bppaired-end standard mRNA-Seq 
100 bpsingle-read directional mRNA-Seq 
DNA Methylation -RRBS 
CNV-low pass genomic DNA sequencing 
Small RNA Analysis

2010 06 sq-03_lakdawalla_transcriptome_sequencing

  • 1.
    © 2009 Illumina,Inc. All rights reserved. Illumina, illuminaDx, Solexa, Making Sense Out of Life, Oligator, Sentrix, GoldenGate, GoldenGate Indexing, DASL, BeadArray, Array of Arrays, Infinium, BeadXpress, VeraCode, IntelliHyb, iSelect, CSPro, and GenomeStudio are registered trademarks or trademarks of Illumina, Inc. All other brands and names contained herein are the property of their respective owners. Welcome! Abizar Lakdawalla, PhD alakdawalla@illumina.com •Pervasive transcription •Antisense transcription •Non-coding RNA •Promoter associated RNA •Micro-RNA/mRNA targets •Enhancer RNAs •Gene fusions Transcriptome sequencing Goodbye! Arrays
  • 2.
    2 2 Revolution–RNA-Seq–PCR-free –Ribo-Seq–CLIP-Seq–Normalization -FFPE Human Genome circa2010
  • 3.
    3 3 Revolution–RNA-Seq–PCR-free –Ribo-Seq–CLIP-Seq–Normalization -FFPE
  • 4.
    4 4 Revolution–RNA-Seq–PCR-free –Ribo-Seq–CLIP-Seq–Normalization -FFPE RNA families RNA Coding PolyA mRNA Non-PolyA mRNA Non-coding StructuralDNA associated Replisome DNA Repair Telomeric DNA methylation (piRNA) RNA associated Ribosome associated rRNA Regulatory Micro RNA TSS associated Anti-sense Enhancer RNA
  • 5.
    5 5 Revolution–RNA-Seq–PCR-free –Ribo-Seq–CLIP-Seq–Normalization -FFPE Genome Analyzer Transcriptional Analysis RNA from mitochondria RNA from nucleus RNA from cytoplasm Sub-fractionate the RNA •Poly-A RNA •RNA without rRNA •RNA without … Sequence the whole RNA Tag Sequence (a snippet)
  • 6.
    6 6 Revolution–RNA-Seq–PCR-free –Ribo-Seq–CLIP-Seq–Normalization -FFPE Tag Sequencing AAAAA mRNA / Total RNA Sequencing Adapter Ligation GATC AAAAA TTTTT- CTAGMmeI AAAAA TTTTT- 1stand 2ndStrand cDNA Synthesis Restriction Enzyme Digestion GATC AAAAA TTTTT-
  • 7.
    7 7 Revolution–RNA-Seq–PCR-free –Ribo-Seq–CLIP-Seq–Normalization -FFPE 2ndPrimer Addition via PCR Seq. Primer Primer Tag Primer Digital Tag mRNA Sample Preparation GATC AAAAA TTTTT- CTAG MmeI NN MmeI Digestion Ligation of 1stPrimer NN NN
  • 8.
    8 8 Revolution–RNA-Seq–PCR-free –Ribo-Seq–CLIP-Seq–Normalization -FFPE Gene Expression 250 samples per run (HiSeq 2000)
  • 9.
    9 9 Revolution–RNA-Seq–PCR-free –Ribo-Seq–CLIP-Seq–Normalization -FFPE RNA-Seq: Method AAAA AAAAAAA AAAAAA Illumina Sequencing cDNAsample Genome position Relative # of reads
  • 10.
    10 10 Revolution–RNA-Seq–PCR-free –Ribo-Seq–CLIP-Seq–Normalization -FFPE We can calculate the expression ratio of any two samples at every region across the entire genome
  • 11.
    11 11 Revolution–RNA-Seq–PCR-free –Ribo-Seq–CLIP-Seq–Normalization -FFPE
  • 12.
    12 12 Revolution–RNA-Seq–PCR-free –Ribo-Seq–CLIP-Seq–Normalization -FFPE mRNA-SeqData is Information RichmRNA Expression ProfilingAlternative Splicing Analysis Analysis of expressed SNPs and mutationsAnalysis of Allelic-specific ExpressionChimericTranscript DiscoveryGene Discovery and Annotation
  • 13.
    1133 Revolution –RNA-Seq – PCR-free – Ribo-Seq – CLIP-Seq – Normalization - FFPE Base Position 51,165,353 51,166,593 51,167,833 51,169,073 51,170,313 51,171,553 51,172,793 51,174,033 51,175,273 51,176,513 Cytogenetic Band q13.13 Sequence (+) Sequence is too dense for display. BCnormal_619K… KRT6A Base Position 151,798,793 151,800,683 151,802,573 151,804,463 151,806,353 151,808,243 151,810,133 151,812,023 151,813,913 Cytogenetic Band q21.3 Sequence (+) Sequence is too dense for display. BCnormal_619K… S100A2 Base Position 56,150,388 56,152,598 56,154,808 56,157,018 56,159,228 56,161,438 56,163,648 56,165,858 56,168,068 Cytogenetic Band q13.33 Sequence (+) Sequence is too dense for display. BCnormal_619K… KLK6 KLK6 normal tumor KRT6A S100A2 KLK6
  • 14.
    1144 Revolution –RNA-Seq – PCR-free – Ribo-Seq – CLIP-Seq – Normalization - FFPE Tissue-specific genes Base Position 125,121,475 125,121,905 125,122,335 125,122,765 125,123,195 125,123,625 125,124,055 125,124,485 125,124,915 Cytogenetic Band q24.2 Sequence (+) Sequence is too dense for display. adipose PATE1 PATE1 Gene Prostate And Testis Expressed 1
  • 15.
    15 15 Revolution–RNA-Seq–PCR-free –Ribo-Seq–CLIP-Seq–Normalization -FFPE Read Counts for All RefSeq Genes
  • 16.
    16 16 Revolution–RNA-Seq–PCR-free –Ribo-Seq–CLIP-Seq–Normalization -FFPE RNA-seq and Microarray ComparedExpression levels are shown, as measured by RNA-Seqand tiling arrays for Saccharomycescerevisiaecells. Agree for genes with medium levels of expression, but correlation is very low for genes with either low or high expression levels.
  • 17.
    17 17 Revolution–RNA-Seq–PCR-free –Ribo-Seq–CLIP-Seq–Normalization -FFPE Dynamic Range Accuracy and Sensitivity Performance of RNA sequencing is superior to other gene expression profiling methods
  • 18.
    18 18 Revolution–RNA-Seq–PCR-free –Ribo-Seq–CLIP-Seq–Normalization -FFPE mRNA-Seq
  • 19.
    19 19 Revolution–RNA-Seq–PCR-free –Ribo-Seq–CLIP-Seq–Normalization -FFPE Transcribed region of PMPCB gene is clearly longer than RefSeqannotation Overlapping of PMPCB and DNAJC2 genes on two strands
  • 20.
    2200 Revolution –RNA-Seq – PCR-free – Ribo-Seq – CLIP-Seq – Normalization - FFPE 30%
  • 21.
    21 21 Revolution–RNA-Seq–PCR-free –Ribo-Seq–CLIP-Seq–Normalization -FFPE cSNP Analysis Homozygous Heterozygous
  • 22.
    2222 Revolution –RNA-Seq – PCR-free – Ribo-Seq – CLIP-Seq – Normalization - FFPE Differential Allelic Expression
  • 23.
    23 23 Revolution–RNA-Seq–PCR-free –Ribo-Seq–CLIP-Seq–Normalization -FFPE Read Counts for All RefSeq Exons
  • 24.
    24 24 Revolution–RNA-Seq–PCR-free –Ribo-Seq–CLIP-Seq–Normalization -FFPE Transcriptome isoforms –
  • 25.
    25 25 Revolution–RNA-Seq–PCR-free –Ribo-Seq–CLIP-Seq–Normalization -FFPE Making Sense“… studying transcription for a long time and never seen this kind of transcription before … but we also see a polymerase that appears to be pointing in the wrong direction.” - Seila/Sharp, MIT “The gene, in other words, is in an identity crisis.”
  • 26.
    26 26 Revolution–RNA-Seq–PCR-free –Ribo-Seq–CLIP-Seq–Normalization -FFPE Gene Fusions
  • 27.
    27 27 Revolution–RNA-Seq–PCR-free –Ribo-Seq–CLIP-Seq–Normalization -FFPE
  • 28.
    28 28 Revolution–RNA-Seq–PCR-free –Ribo-Seq–CLIP-Seq–Normalization -FFPE Foxa2 Binds in Unknown Regions … two remote peaks in regions containing no known genes. The first peak (unknown #4) lies close to a mouse EST, while the second peak (unknown #5) overlaps and is close to highly conserved sequence regions.
  • 29.
    29 29 Revolution–RNA-Seq–PCR-free –Ribo-Seq–CLIP-Seq–Normalization -FFPE
  • 30.
    30 30 Revolution–RNA-Seq–PCR-free –Ribo-Seq–CLIP-Seq–Normalization -FFPE More to small RNA than known microRNAsmiRNA Fragment Potential Novel Content rRNA, tRNA, adaptor contamination Standard Protocol:<3% sRNA v1.5 30 nt band: 6% sRNA v1.5 22 nt band:8% Non-coding RNA Fragment
  • 31.
    31 31 Revolution–RNA-Seq–PCR-free –Ribo-Seq–CLIP-Seq–Normalization -FFPE More to small RNAs ...
  • 32.
    32 32 Revolution–RNA-Seq–PCR-free –Ribo-Seq–CLIP-Seq–Normalization -FFPE Identification of micro-RNA targetsHenderson, 2009
  • 33.
    33 33 Revolution–RNA-Seq–PCR-free –Ribo-Seq–CLIP-Seq–Normalization -FFPE ArgonauteHITS-CLIP decodes microRNA- mRNA interaction maps. Chi SW, ZangJB, MeleA, Darnell RB. Nature (2009) 460: 479-86. Covalently crosslink native argonauteprotein–RNA gives you Ago–miRNAand Ago–mRNA binding sites. Ago-mRNA tags to genome
  • 34.
    3344 Revolution –RNA-Seq – PCR-free – Ribo-Seq – CLIP-Seq – Normalization - FFPE Ribo-Seq. RNA engaged in translation Ribo-Seq RNA-Seq
  • 35.
    35 35 Revolution–RNA-Seq–PCR-free –Ribo-Seq–CLIP-Seq–Normalization -FFPE RNA Normalization
  • 36.
    36 36 Revolution–RNA-Seq–PCR-free –Ribo-Seq–CLIP-Seq–Normalization -FFPE Genome Analyzer Transcriptional Analysis RNA from mitochondria RNA from nucleus RNA from cytoplasm Sub-fractionate the RNA •Poly-A RNA •RNA without rRNA •RNA without … Sequence the whole RNA Tag Sequence (a snippet)
  • 37.
    37 37 Revolution–RNA-Seq–PCR-free –Ribo-Seq–CLIP-Seq–Normalization -FFPE Cot Curves and cDNA Normalization rRNA mtRNA mRNA
  • 38.
    38 38 Revolution–RNA-Seq–PCR-free –Ribo-Seq–CLIP-Seq–Normalization -FFPE Double strand nuclease normalization mRNA-Seq Purified Total RNA Poly-A Selection RNA Fragmentation cDNA Synthesis* Adapter Ligation & PCR Total RNA-Seq Purified Total RNA RNA Fragmentation cDNA Synthesis* Adapter Ligation & PCR DSN Normalization
  • 39.
    39 39 Revolution–RNA-Seq–PCR-free –Ribo-Seq–CLIP-Seq–Normalization -FFPE DSN Library Normalization Process Overview From Evrogen.com Library is melted at 98ºC Library is hybridized at 68ºC DSN Cleavage PCR to enrich library Grow Clusters and Sequence
  • 40.
    40 40 Revolution–RNA-Seq–PCR-free –Ribo-Seq–CLIP-Seq–Normalization -FFPE Total RNA-SeqMethod OverviewRNA from any organism –bacteria, plants, animalsLess than 100 nanogramsof total RNAFull-length cDNA coverage ofall RNA moleculesWorks with low quality RNA –even FFPE preparationsNormalization protocol can be used with most RNA-Seqprotocols
  • 41.
    41 41 Revolution–RNA-Seq–PCR-free –Ribo-Seq–CLIP-Seq–Normalization -FFPE Comparison of Output from Different Protocols
  • 42.
    42 42 Revolution–RNA-Seq–PCR-free –Ribo-Seq–CLIP-Seq–Normalization -FFPE Many ncRNAsare often transcribed from the same strand as mRNA Poly-A + DSN Total RNA + DSN
  • 43.
    43 43 Revolution–RNA-Seq–PCR-free –Ribo-Seq–CLIP-Seq–Normalization -FFPE Total RNA + DSN Poly-A + DSN Many non-coding RNAs are seen with TotalRNA-Seq
  • 44.
    44 44 Revolution–RNA-Seq–PCR-free –Ribo-Seq–CLIP-Seq–Normalization -FFPE DSN Normalization has little effect on most mRNAs Poly-A mRNA (no DSN) Poly-A mRNA (+ DSN)
  • 45.
    45 45 Revolution–RNA-Seq–PCR-free –Ribo-Seq–CLIP-Seq–Normalization -FFPE Plot shows gene level count data for all RefSeqGenes Total RNA vs. Poly-A mRNA Many non-coding RNAs are observed with Total RNA-SeqMethod Total RNA Poly-A mRNA
  • 46.
    4466 Revolution –RNA-Seq – PCR-free – Ribo-Seq – CLIP-Seq – Normalization - FFPE -10 -5 0 5 10 -10 -5 0 5 10 Log2 sequencing count ratio (brain vs UHR) Log2 qPCR ratio (brain vs UHR) R = 0.947 Slope = 1.01 Fold Change for qRT-PCR: Brain/UHR Fold Change for Total RNA-SEQ: Brain/UHR Key Variables: RNA is degraded No Poly-A Selection + DSN Normalization 0.1 μg input total RNA Fold Change of Total RNA-Seq vs. qRT-PCR
  • 47.
    47 47 Revolution–RNA-Seq–PCR-free –Ribo-Seq–CLIP-Seq–Normalization -FFPE RNA-Seqin FFPE
  • 48.
    48 48 Revolution–RNA-Seq–PCR-free –Ribo-Seq–CLIP-Seq–Normalization -FFPE RNA-SeqProtocol Variations mRNA-Seq Purified Total RNA Poly-A Selection RNA Fragmentation cDNA Synthesis* Adapter Ligation & PCR Total RNA-Seq Purified Total RNA RNA Fragmentation cDNA Synthesis* Adapter Ligation & PCR NormalizationTotalRNA-SeqTotal RNA from FFPEcDNA Synthesis* Adapter Ligation & PCRNormalization
  • 49.
    49 49 Revolution–RNA-Seq–PCR-free –Ribo-Seq–CLIP-Seq–Normalization -FFPE Zoom in Collaboration with Chuck Perou -UNC Total RNA-Seqprotocol on FFPE SamplesTwo Cancer Samples –Her2 and Basal breast cancer sub-typesTwo types of RNA preparations –Total RNA from fresh/frozen tissue and highly degraded FFPE RNARIN of the fresh samples are 9.3 and 8.3 Fresh Samples FFPE Samples
  • 50.
    5500 Revolution –RNA-Seq – PCR-free – Ribo-Seq – CLIP-Seq – Normalization - FFPE 10 -2 10 -1 10 0 10 1 10 2 10 3 10 4 s5_csv1.7_c Counts s1_csv1.7_c Counts vs s5_csv1.7_c Counts 10-2 10-1 100 101 102 103 104 s1_csv1.7_c Counts R2 = 0.89 FFPE Total RNA-Seq vs. Fresh Total RNA-Seq Pair-wise Comparison of FFPE
  • 51.
    51 51 Revolution–RNA-Seq–PCR-free –Ribo-Seq–CLIP-Seq–Normalization -FFPE MUCL1(mucin-like 1 gene) FFPE -Basal FFPE -Her2 Fresh mRNA –Basal Fresh mRNA -Her2 Fresh Total RNA -Basal Fresh Total RNA –Her2 Fresh Total RNA -Basal Fresh Total RNA –Her2 Replicate 1 Replicate 2
  • 52.
    52 52 Revolution–RNA-Seq–PCR-free –Ribo-Seq–CLIP-Seq–Normalization -FFPE Whole Transcriptome Studies on HiSeq 2000 System Format PF reads Average Error Rates (PhiXspike-ins) Yield Individual human tissues 2 X 50 2.55 B 0.22%, 0.44% >120 Gbin <5 days Individual human tissues 1 X 75 1.27 B 0.37%, 0.52% >95 Gbin <4 days Total human transcriptome 1 X 100 1.19 B 0.67%, 0.81% >115 Gbin <5 days Body Map 2.0 ProjectAdrenal, Adipose, Brain, Breast, Colon, Heart, Kidney, Liver, Lung, Lymph Node, Ovary, Prostate, Skeletal Muscle, Testis, Thyroid, White Blood Cells INDIVIDUAL HUMAN TISSUES 16 tissues, 1 lane per tissue Standard Poly-A mRNA-SeqLibrary Preps TOTAL HUMAN TRANSCRIPTOME Equal Mixture of 16 Human Tissues Strand-specific mRNA-Seq SUMMARY OF RUN METRICS
  • 53.
    53 53 Revolution–RNA-Seq–PCR-free –Ribo-Seq–CLIP-Seq–Normalization -FFPE PCR-free
  • 54.
    54 54 Revolution–RNA-Seq–PCR-free –Ribo-Seq–CLIP-Seq–Normalization -FFPE No PCR No PCR PCR PCR GAPDH
  • 55.
    55 55 Revolution–RNA-Seq–PCR-free –Ribo-Seq–CLIP-Seq–Normalization -FFPE No PCR No PCR PCR PCR APOB
  • 56.
    5566 Revolution –RNA-Seq – PCR-free – Ribo-Seq – CLIP-Seq – Normalization - FFPE No PCR vs PCR (15 cycles) 10 0 10 1 10 2 10 3 10 4 10 5 HCT10738 Counts (Raw) HCT10736 Counts (Raw) vs HCT10738 Counts (Raw) 100 101 102 103 104 105 HCT10736 Counts (Raw) R2=0.9637
  • 57.
    57 57 Revolution–RNA-Seq–PCR-free –Ribo-Seq–CLIP-Seq–Normalization -FFPE Thank you Summary RNA-Seq= more publications! DATA ANALYSES
  • 58.
    58 58 Revolution–RNA-Seq–PCR-free –Ribo-Seq–CLIP-Seq–Normalization -FFPE Samples/flow cell and cost/sample (all consum.) GAIIe GAIIx HiScanSQ HiSeq 2000 DGE (25bp, 2 million) 60 €230 125 €205 125 €204 250 €192 RNA-Seq(75x2, 20 million) 6 €1585 13 €898 13 €835 25 €522 ChIP-Seq(TF) 125 €252 250 €231 250 €229 500 €219 Virus/BAC clones (100x2, 30x) 2,770 €209 5,555 €207 5,555 €207 11,111 €206 Bact./GWAS (100x2, 30x) 277 €242 556 €224 556 €222 1,111 €214 Huexome(100x2, 30x) 28 €568 56 €387 56 €368 111 €287 Hugenome (100x2, 30x) 0.28 €36,444 0.56 €18,325 0.56 €16,436 1.11 €8,321 €5,616 @300Gb/run
  • 59.
    59 59 Revolution–RNA-Seq–PCR-free –Ribo-Seq–CLIP-Seq–Normalization -FFPE1270 genes respond to beta-estradiol, includes several direct targets of Eralpha, organized in a gene regulation cascade, stemming from ligand-activated receptor and reaching a large number of downstream targets via AP-2gamma, B-cell activating transcription factor, E2F1 and 2, E74-like factor 3, GTF2IRD1, hairy and enhancer of split homologue-1, MYB, SMAD3, RARalpha, and RXRalphatranscription factors. MicroRNAsintegral components of this gene regulation network; miR-107, miR-424, miR-570, miR-618, and miR-760 are regulated by 17beta-estradiol along with other microRNAsthat can target a significant number of transcripts belonging to one or more estrogen- responsive gene clusters. Estrogen receptor alpha controls a gene network in luminal-like breast cancer cells comprising multiple transcription factors and microRNAs. CicatielloL … Am J Pathol(2010) 176: 2113-30.
  • 60.
    6600 Revolution –RNA-Seq – PCR-free – Ribo-Seq – CLIP-Seq – Normalization - FFPE Genomic DNA X X Restriction Enzyme Digestion Size Selection (200+25bp) Bisulfite Treatment Sequence Ends of Selected Fragments Data Analysis 200 +/- 25 bp Reduced Representation Bisulfite Seq
  • 61.
    61 61 Revolution–RNA-Seq–PCR-free –Ribo-Seq–CLIP-Seq–Normalization -FFPE BC Cell Line RRBS Data -MMEL1 Gene MCF7 ZR-75-1 T47DBT474 MDA-MB-231 MDA-MB-468 BT20 MCF10A
  • 62.
    62 62 Revolution–RNA-Seq–PCR-free –Ribo-Seq–CLIP-Seq–Normalization -FFPE BC Cell Line RRBS Data -CD247 Gene MCF7 ZR-75-1T47D BT474 MDA-MB-231 MDA-MB-468 BT20 MCF10A
  • 63.
    63 63 Revolution–RNA-Seq–PCR-free –Ribo-Seq–CLIP-Seq–Normalization -FFPE BC Cell Line RRBS Data -CDH13 Gene MCF7ZR-75-1 T47D BT474 MDA-MB-231 MDA-MB-468 BT20 MCF10A
  • 64.
    64 64 Revolution–RNA-Seq–PCR-free –Ribo-Seq–CLIP-Seq–Normalization -FFPE Correlation of RRBS and mRNA-SeqData for PRKD1 Gene chr14:29,027,620-29,554,515 PRKD1 gene methylation for 5’ CpG island region been dramatically changed and anti-correlates well with mRNA levels MCF7 ZR-75-1T47D BT474 MDA-MB-231 MDA-MB-468 BT20 MCF10A 109 37 0 283 0 0 0 418 mRNA levels BT474mRNA levels
  • 65.
    65 65 Revolution–RNA-Seq–PCR-free –Ribo-Seq–CLIP-Seq–Normalization -FFPE Lung Breast CDH13(H-cadherin): increased methylation in lung tumor 3% ave 47% ave 4% ave 10% ave Study both individual CpG sites and CpG Islands
  • 66.
    6666 Revolution –RNA-Seq – PCR-free – Ribo-Seq – CLIP-Seq – Normalization - FFPE CpG island sumMeth value in twins 0 5000 10000 15000 20000 25000 30000 35000 0 5000 10000 15000 20000 25000 30000 35000 twin1 twin2 Twin 101 Twin 001 0 5000 10000 15000 20000 25000 30000 35000 0 5000 10000 15000 20000 25000 30000 35000 normal breast Breabseta sCt taumnocr Ber Normal Breast 0 5000 10000 15000 20000 25000 30000 0 5000 10000 15000 20000 25000 30000 lung normal lung tumor B Normal Lung Lung Cancer Comparison of Methylation Summarized for ~ 25K CpG Islands
  • 67.
    67 67 Revolution–RNA-Seq–PCR-free –Ribo-Seq–CLIP-Seq–Normalization -FFPE Whole Genome Bisulfite Sequencing Reduced Representation Bisulfite Sequencing
  • 68.
    68 68 Revolution–RNA-Seq–PCR-free –Ribo-Seq–CLIP-Seq–Normalization -FFPE CpG Island Methylation Changes & Pathways What are in these pathways that change? Top 3 Pathways by Enrichment cAMP-mediated Signaling (p = 2.09e-8) G-Protein Coupled Receptor Signaling (p = 4.17e-7) Axonal Guidance Signaling (p = 1.18e-6) Cell Death RelatedPathways Implication: increased methylation of cell death related pathways could promote cell growth and cancer progression
  • 69.
    69 69 Revolution–RNA-Seq–PCR-free –Ribo-Seq–CLIP-Seq–Normalization -FFPE Experimental Data Available RNA-Seq 50 bppaired-end standard mRNA-Seq 100 bpsingle-read directional mRNA-Seq DNA Methylation -RRBS CNV-low pass genomic DNA sequencing Small RNA Analysis