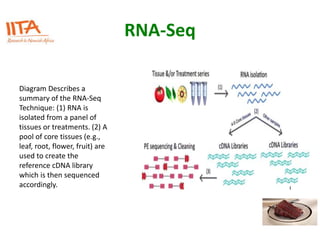
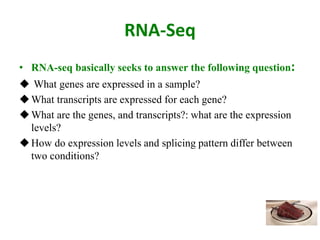
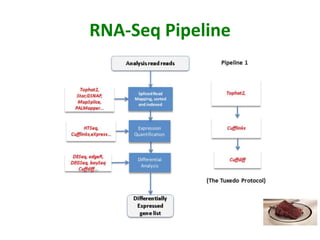
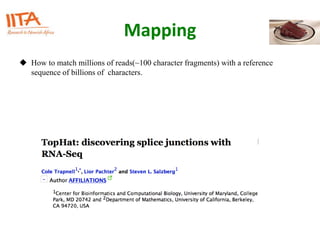
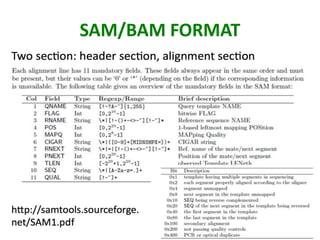
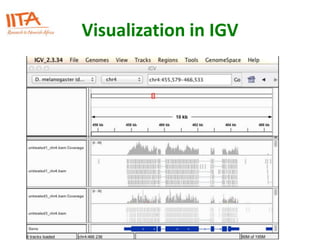
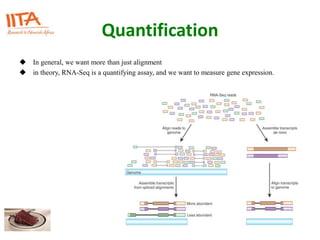
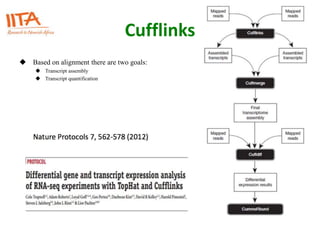
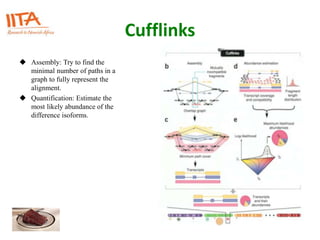
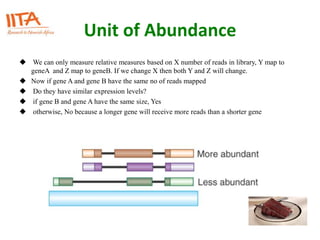
RNA-Seq analysis pipeline For
Unraveling Traits in crops:
TUXEDO protocol
By Abdulsalam Toyin
OUTLINE
RNA-Seq
Biology of Gene Expression
Concept of Genes and Transcripts
Alignment
RNA-Seq specific aligners
Tophat, STAR
SAM/BAM format
 Quantification
cufflinks(gene level, isoform level, splicing…..)
Alternative methods
 Post-Alignment Quality Control
 Other analysis with RNA-Seq
RNA-Seq
Diagram Describes a
summary of the RNA-Seq
Technique: (1) RNA is
isolated from a panel of
tissues or treatments. (2) A
pool of core tissues (e.g.,
leaf, root, flower, fruit) are
used to create the
reference cDNA library
which is then sequenced
accordingly.
RNA-Seq
• RNA-seq basically seeks to answer the following question:
 What genes are expressed in a sample?
What transcripts are expressed for each gene?
What are the genes, and transcripts?: what are the expression
levels?
How do expression levels and splicing pattern differ between
two conditions?
Biology of Gene Expression
The process of gene
expression is very
complex. “Genes takes a
body of their own in
process called gene
expression”. The process
starts with transcription
during which RNA-
polymerase creates a copy
of the gene, nucleotide by
nucleotide as a single
stranded molecule.
While in the
nucleus(highly unstable):5’
capping, 3’ cleavage and
addition of long polyA tail
to stabilize.
Genes are encoded in
the genome occupying
a specific location.
Genes consist of:
Informative block
“Exon” and non
informative block
“intron”. During
transcription the
introns are spliced out
and the exons are glued
together for form
mRNA.
RNA-Seq Pipeline
Mapping
 How to match millions of reads(~100 character fragments) with a reference
sequence of billions of characters.
Mapping for RNA-Seq
 The transcript may result from splicing and the mapping strategy must account for
this.
 Either we map to the transcriptome or we map to the genome with a “splice-aware”
aligner.
 Tophat is one of the first and by far the most popular aligner for RNA-Seq data
 it was built “on top” of bowtie
Mapping for RNA-Seq
 It breaks the reads into pieces, maps first to the genome and then extends to
“possible splice junctions”.
 We can also Pass an annotation file(GTF format) as arguments.
 Extract transcript, build an index
 Map to the “transcriptome” and then to the genome.
Tophat
 Using annotation:
 Improves accuracy, mostly around splicing junctions.
 “bias” in favor of known transcripts
 less power to detect novel transcripts or novel isoforms
 Beware if you have an incomplete annotation
 At the mapping step, it’s better to keep multi-mappers(within a reasonable limit,
10, 20 hits) Tophat provides an options control multiple mappings.
SAM/BAM FORMAT
 Composed of two parts
 Header to describe the source of the data, the reference sequence, the method of alignment and so on.
 Alignments to describe the reads, the location and the nature of the alignments.
SAM/BAM FORMAT
Visualization in IGV
Quantification
 In general, we want more than just alignment
 in theory, RNA-Seq is a quantifying assay, and we want to measure gene expression.
Cufflinks
 Based on alignment there are two goals:
 Transcript assembly
 Transcript quantification
Cufflinks
 Assembly: Try to find the
minimal number of paths in a
graph to fully represent the
alignment.
 Quantification: Estimate the
most likely abundance of the
difference isoforms.
Unit of Abundance
 We can only measure relative measures based on X number of reads in library, Y map to
geneA and Z map to geneB. If we change X then both Y and Z will change.
 Now if gene A and gene B have the same no of reads mapped
 Do they have similar expression levels?
 if gene B and gene A have the same size, Yes
 otherwise, No because a longer gene will receive more reads than a shorter gene
FPKM
Fragment per Kilobase per millions of reads.
 Not annotated gene size, but effective size
 Effective length: number of possible start site on transcript(depends on the
estimated fragment size)
 Millions of reads; millions of mapped reads(not millions of sequenced reads)
 FPKM let you compare the expression of gene between samples(because it
account for differences in library depth)
 It also lets you compare the expression of two genes within the same
sample (because it account difference in gene length).
Cufflinks and Cuffdiff
 In addition to estimating expression, cufflinks output gene expression(more or less
the sum of the different isoforms)
 cufflinks contains a method called cuffdiff for differential expression.
 cuffdiff estimate the isoform expression in two groups(which can be composed of
multiple replicates) and performs statistical test for;
 Differential gen expression
 Differential transcript levels
 Alternative splicing
 Differential usage of transcription start sites
Quality Control
 A number of matrices are important to look at:
Ribosomal contamination
Map the entire library against a set of ribosomal RNA
sequence and count the number reads mapping
 Numbers of reads mapping, and number of reads
mapping uniquely.
 Distribution of expression. Few high expressed,
some mid-expressed many low expression genes.
Quality Control
 Other matrices:
 Duplication rate(based on the location of the alignment) might bias the
estimation of the gene expression
% of the reads mapping of CDS, UTR, intron and intergenic regions,
obviously, the more on CDS and UTR the better.
Unsupervised clustering to verify that the samples cluster according to
biological differences and not according to experimental batches.
Hierarchical Clustering
PCA, MDS plot
Differential Expression
THANK YOU

RNA-Seq_Presentation

  • 1.
    RNA-Seq analysis pipelineFor Unraveling Traits in crops: TUXEDO protocol By Abdulsalam Toyin
  • 2.
    OUTLINE RNA-Seq Biology of GeneExpression Concept of Genes and Transcripts Alignment RNA-Seq specific aligners Tophat, STAR SAM/BAM format  Quantification cufflinks(gene level, isoform level, splicing…..) Alternative methods  Post-Alignment Quality Control  Other analysis with RNA-Seq
  • 3.
    RNA-Seq Diagram Describes a summaryof the RNA-Seq Technique: (1) RNA is isolated from a panel of tissues or treatments. (2) A pool of core tissues (e.g., leaf, root, flower, fruit) are used to create the reference cDNA library which is then sequenced accordingly.
  • 4.
    RNA-Seq • RNA-seq basicallyseeks to answer the following question:  What genes are expressed in a sample? What transcripts are expressed for each gene? What are the genes, and transcripts?: what are the expression levels? How do expression levels and splicing pattern differ between two conditions?
  • 5.
    Biology of GeneExpression The process of gene expression is very complex. “Genes takes a body of their own in process called gene expression”. The process starts with transcription during which RNA- polymerase creates a copy of the gene, nucleotide by nucleotide as a single stranded molecule. While in the nucleus(highly unstable):5’ capping, 3’ cleavage and addition of long polyA tail to stabilize.
  • 6.
    Genes are encodedin the genome occupying a specific location. Genes consist of: Informative block “Exon” and non informative block “intron”. During transcription the introns are spliced out and the exons are glued together for form mRNA.
  • 7.
  • 8.
    Mapping  How tomatch millions of reads(~100 character fragments) with a reference sequence of billions of characters.
  • 9.
    Mapping for RNA-Seq The transcript may result from splicing and the mapping strategy must account for this.  Either we map to the transcriptome or we map to the genome with a “splice-aware” aligner.  Tophat is one of the first and by far the most popular aligner for RNA-Seq data  it was built “on top” of bowtie
  • 10.
    Mapping for RNA-Seq It breaks the reads into pieces, maps first to the genome and then extends to “possible splice junctions”.  We can also Pass an annotation file(GTF format) as arguments.  Extract transcript, build an index  Map to the “transcriptome” and then to the genome.
  • 11.
    Tophat  Using annotation: Improves accuracy, mostly around splicing junctions.  “bias” in favor of known transcripts  less power to detect novel transcripts or novel isoforms  Beware if you have an incomplete annotation  At the mapping step, it’s better to keep multi-mappers(within a reasonable limit, 10, 20 hits) Tophat provides an options control multiple mappings.
  • 12.
    SAM/BAM FORMAT  Composedof two parts  Header to describe the source of the data, the reference sequence, the method of alignment and so on.  Alignments to describe the reads, the location and the nature of the alignments.
  • 13.
  • 14.
  • 15.
    Quantification  In general,we want more than just alignment  in theory, RNA-Seq is a quantifying assay, and we want to measure gene expression.
  • 16.
    Cufflinks  Based onalignment there are two goals:  Transcript assembly  Transcript quantification
  • 17.
    Cufflinks  Assembly: Tryto find the minimal number of paths in a graph to fully represent the alignment.  Quantification: Estimate the most likely abundance of the difference isoforms.
  • 18.
    Unit of Abundance We can only measure relative measures based on X number of reads in library, Y map to geneA and Z map to geneB. If we change X then both Y and Z will change.  Now if gene A and gene B have the same no of reads mapped  Do they have similar expression levels?  if gene B and gene A have the same size, Yes  otherwise, No because a longer gene will receive more reads than a shorter gene
  • 19.
    FPKM Fragment per Kilobaseper millions of reads.  Not annotated gene size, but effective size  Effective length: number of possible start site on transcript(depends on the estimated fragment size)  Millions of reads; millions of mapped reads(not millions of sequenced reads)  FPKM let you compare the expression of gene between samples(because it account for differences in library depth)  It also lets you compare the expression of two genes within the same sample (because it account difference in gene length).
  • 20.
    Cufflinks and Cuffdiff In addition to estimating expression, cufflinks output gene expression(more or less the sum of the different isoforms)  cufflinks contains a method called cuffdiff for differential expression.  cuffdiff estimate the isoform expression in two groups(which can be composed of multiple replicates) and performs statistical test for;  Differential gen expression  Differential transcript levels  Alternative splicing  Differential usage of transcription start sites
  • 21.
    Quality Control  Anumber of matrices are important to look at: Ribosomal contamination Map the entire library against a set of ribosomal RNA sequence and count the number reads mapping  Numbers of reads mapping, and number of reads mapping uniquely.  Distribution of expression. Few high expressed, some mid-expressed many low expression genes.
  • 22.
    Quality Control  Othermatrices:  Duplication rate(based on the location of the alignment) might bias the estimation of the gene expression % of the reads mapping of CDS, UTR, intron and intergenic regions, obviously, the more on CDS and UTR the better. Unsupervised clustering to verify that the samples cluster according to biological differences and not according to experimental batches. Hierarchical Clustering PCA, MDS plot
  • 23.
  • 24.