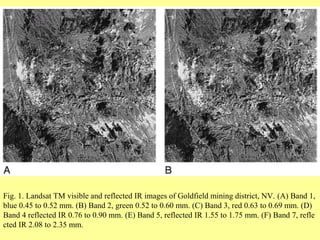
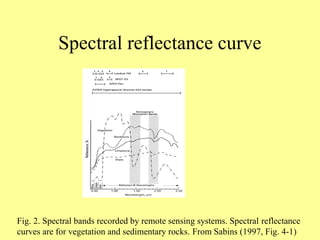
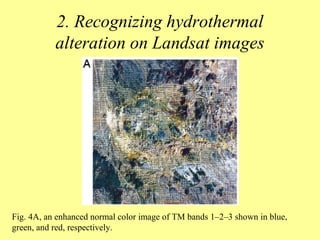
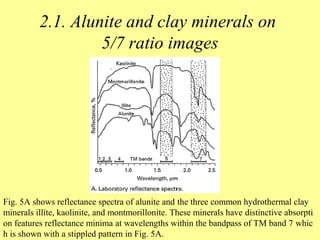
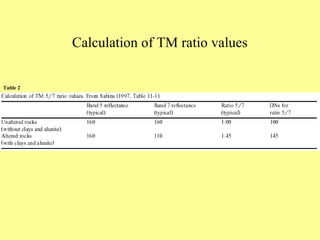
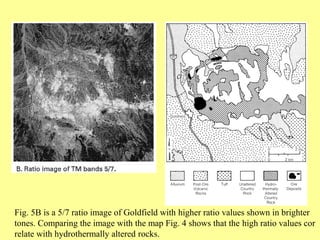
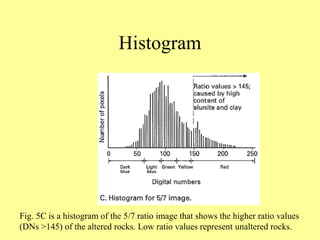
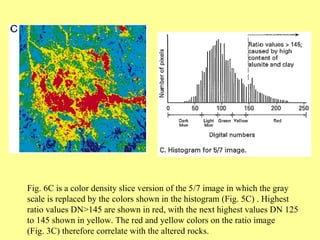
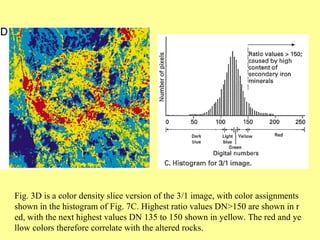
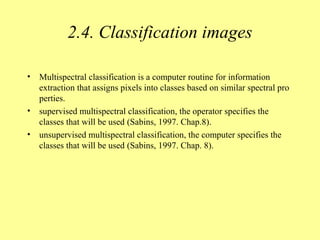
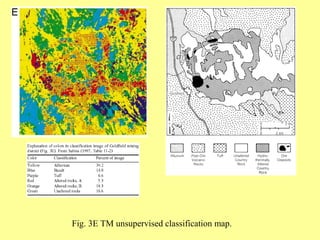
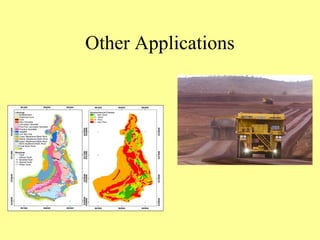
Remote Sensing
for
Mineral Exploration
A solid naturally-occurring compound
having a definite chemical composition
Examples:
quartz - SiO2 (an oxide)
hematite - Fe2O3 (another oxide)
covelite - CuS (a sulphide)
What is a mineral?
An occurrence of minerals or
metals in sufficiently high
concentration to be profitable to
mine and process using current
technology and under current
economic conditions.
What is an ore deposit?
Note for
comparison:
Silicon 28%
Oxygen 46%
Metal
Concentration
(% by weight)
Aluminum 8.0
Iron 5.8
Copper 0.0058
Nickel 0.0072
Zinc 0.0082
Uranium 0.00016
Lead 0.001
Silver 0.000008
Gold 0.0000002
Economically Important Metal
Concentrations in Earth’s Crust
As magma cools, more abundant metals
(silicon, aluminum) deposit first
Solidification of magma releases water -
a hydrothermal solution
Minerals precipitate from hydrothermal
solution and deposit in cracks or veins in
rock
Hydrothermal Ore Deposits
Concentration of minerals caused by
high temperatures and pressures near
intrusions
Examples:
Lead-zinc deposits in southeast B.C.
Diamonds
Garnets
Metamorphic Ore Deposits
Hydrothermal and
Metamorphic Ore Deposits
Intrusion
Hydrothermal solutions
entering veins in rocks
Geyser or hot spring
Ore deposit
Alteration of rocks by
heat and pressure
zoning
Deposition of dense, resistant minerals
in streams, lakes etc (Alluvial Deposits),
e.g. Placer gold
Precipitation of minerals from ancient
oceans (Evaporite Deposits), e.g.
Potash and salt deposits
Accumulation, burial and petrification of
vegetation, e.g. Coal Deposits.
Sedimentary Ore Deposits
Exploration Methods
· Remote sensing
· Geological mapping
· Geophysical surveys
· Geochemical surveys
· Bulk sampling
· Drilling (core or destructive)
Landsat images
• Landsat satellites that have acquired valuable remote sensing data for
mineral exploration and other applications.
• The first generation Landsats 1, 2, and operated from 1972 to 1985.
• The second generation Landsats 4, 5 and 7, which began in 1982 and
continues to the present.
• Landsat 6 of the second generation was launched in 1993, but failed to
reach orbit.
• The TM system records three wavelengths of visible
energy blue, green, and red (Band 1, 2 and 3) and three ba
nds of reflected IR energy (Band 4, 5 and 7). These visible
and reflected IR have a spatial resolution of 30 m.
• Band 6 records thermal IR energy 10.5 to 12.5 mm with a
spatial resolution of 120 m.
• Each TM scene records 170 by 185 km of terrain. The
image data are telemetered to earth receiving stations.
• The second generation of Landsat continued with Landsat
7, launched in April, 1999, with an enhanced TM system.
A panchromatic band 8 0.52 to 0.90 mm with spatial resol
ution of 15 m is added.
Fig. 1. Landsat TM visible and reflected IR images of Goldfield mining district, NV. (A) Band 1,
blue 0.45 to 0.52 mm. (B) Band 2, green 0.52 to 0.60 mm. (C) Band 3, red 0.63 to 0.69 mm. (D)
Band 4 reflected IR 0.76 to 0.90 mm. (E) Band 5, reflected IR 1.55 to 1.75 mm. (F) Band 7, refle
cted IR 2.08 to 2.35 mm.
Spectral reflectance curve
Fig. 2. Spectral bands recorded by remote sensing systems. Spectral reflectance
curves are for vegetation and sedimentary rocks. From Sabins (1997, Fig. 4-1)
Digital image processing
Sabins, 1997 groups image-processing methods into three
functional categories :
• Image restoration compensates for image errors, noise, and
geometric distortions introduced during the scanning,
recording, and playback operations. The objective is to make
the restored image resemble the scene on the terrain.
• Image enhancement alters the visual impact that the image
has on the interpreter. The objective is to improve the
information content of the image.
• Information extraction utilizes the computer to combine and
interact between different aspects of a data set. The objective
is to display spectral and other characteristics of the scene
that are not apparent on restored and enhanced images.
These studies describe two different approaches to mineral
exploration.
Mapping of geology and fracture patterns at regional and
local scales.
• Rowan and Wetlaufer 1975 used a Landsat mosaic of Nevada to
interpret regional lineaments.Comparing the lineament patterns with
ore occurrences showed that mining districts tend to occur along
lineaments and are concentrated at the intersections of lineaments.
• Nicolais 1974 interpreted local fracture patterns from a Landsat image
in Colorado. The mines tend to occur in areas with a high density of
fractures and a concentration of fracture intersections.
• Rowan and Bowers 1995 used TM and aircraft radar images to
interpret linear features in western Nevada. They concluded that the
linear features correlate with the geologic structures that controlled
mineralization.
Recognition of hydrothermally altered rocks that may be
associated with mineral deposits.
• The spectral bands of Landsat TM are well-suited for
recognizing assemblages of alteration minerals iron
oxides, clay, and alunite that occur in hydrothermally
altered rocks. In my experience the best exploration
results are obtained by combining geologic and fracture
mapping with the recognition of hydrothermally altered
rocks.
Mapping hydrothermal alteration
at epithermal vein deposits -- Gold
field, Nevada
• Many mines were discovered by recognizing outcrops of altered rocks,
followed by assays of rock samples.
• Today remote sensing and digital image processing enable us to use
additional spectral bands for mineral exploration.
• In regions where bedrock is exposed, multispectral remote sensing can
be used to recognize altered rocks because their reflectance spectra differ
from those of the unaltered country rock.
• The Goldfield Mining District in south-central Nevada is the test site
where remote sensing methods were first developed to recognize hydrot
hermally altered rocks (Rowan et al., 1974)
1. Geology, ore deposits,
and hydrothermal alteration
– The Goldfield district was noted for the richness of its ore.
– Volcanism began in the Oligocene epoch with eruption of rhyolite
and quartz latite flows and the formation of a small caldera and rin
g-fracture system.
– Hydrothermal alteration and ore deposition occurred during a
second period of volcanism in the early Miocene epoch when the d
acite and andesite flows that host the ore deposits were extruded.
– Following ore deposition, the area was covered by younger
volcanic flows.
– Later doming and erosion have exposed the older volcanic center
with altered rocks and ore deposits.
2. Recognizing hydrothermal
alteration on Landsat images
Fig. 4A, an enhanced normal color image of TM bands 1–2–3 shown in blue,
green, and red, respectively.
2.1. Alunite and clay minerals on
5/7 ratio images
Fig. 5A shows reflectance spectra of alunite and the three common hydrothermal clay
minerals illite, kaolinite, and montmorillonite. These minerals have distinctive absorpti
on features reflectance minima at wavelengths within the bandpass of TM band 7 whic
h is shown with a stippled pattern in Fig. 5A.
Calculation of TM ratio values
Table 2
Fig. 5B is a 5/7 ratio image of Goldfield with higher ratio values shown in brighter
tones. Comparing the image with the map Fig. 4 shows that the high ratio values cor
relate with hydrothermally altered rocks.
Histogram
Fig. 5C is a histogram of the 5/7 ratio image that shows the higher ratio values
(DNs >145) of the altered rocks. Low ratio values represent unaltered rocks.
Fig. 6C is a color density slice version of the 5/7 image in which the gray
scale is replaced by the colors shown in the histogram (Fig. 5C) . Highest
ratio values DN>145 are shown in red, with the next highest values DN 125
to 145 shown in yellow. The red and yellow colors on the ratio image
(Fig. 3C) therefore correlate with the altered rocks.
Fig. 3D is a color density slice version of the 3/1 image, with color assignments
shown in the histogram of Fig. 7C. Highest ratio values DN>150 are shown in r
ed, with the next highest values DN 135 to 150 shown in yellow. The red and ye
llow colors therefore correlate with the altered rocks.
2.4. Classification images
• Multispectral classification is a computer routine for information
extraction that assigns pixels into classes based on similar spectral pro
perties.
• supervised multispectral classification, the operator specifies the
classes that will be used (Sabins, 1997. Chap.8).
• unsupervised multispectral classification, the computer specifies the
classes that will be used (Sabins, 1997. Chap. 8).
Fig. 3E TM unsupervised classification map.
See below…
Other Applications
References
• Floyd F. Sabins (Actual owner of this ppt)
• Google

Mineral exploration

  • 1.
  • 2.
    A solid naturally-occurringcompound having a definite chemical composition Examples: quartz - SiO2 (an oxide) hematite - Fe2O3 (another oxide) covelite - CuS (a sulphide) What is a mineral?
  • 3.
    An occurrence ofminerals or metals in sufficiently high concentration to be profitable to mine and process using current technology and under current economic conditions. What is an ore deposit?
  • 4.
    Note for comparison: Silicon 28% Oxygen46% Metal Concentration (% by weight) Aluminum 8.0 Iron 5.8 Copper 0.0058 Nickel 0.0072 Zinc 0.0082 Uranium 0.00016 Lead 0.001 Silver 0.000008 Gold 0.0000002 Economically Important Metal Concentrations in Earth’s Crust
  • 5.
    As magma cools,more abundant metals (silicon, aluminum) deposit first Solidification of magma releases water - a hydrothermal solution Minerals precipitate from hydrothermal solution and deposit in cracks or veins in rock Hydrothermal Ore Deposits
  • 6.
    Concentration of mineralscaused by high temperatures and pressures near intrusions Examples: Lead-zinc deposits in southeast B.C. Diamonds Garnets Metamorphic Ore Deposits
  • 7.
    Hydrothermal and Metamorphic OreDeposits Intrusion Hydrothermal solutions entering veins in rocks Geyser or hot spring Ore deposit Alteration of rocks by heat and pressure zoning
  • 8.
    Deposition of dense,resistant minerals in streams, lakes etc (Alluvial Deposits), e.g. Placer gold Precipitation of minerals from ancient oceans (Evaporite Deposits), e.g. Potash and salt deposits Accumulation, burial and petrification of vegetation, e.g. Coal Deposits. Sedimentary Ore Deposits
  • 9.
    Exploration Methods · Remotesensing · Geological mapping · Geophysical surveys · Geochemical surveys · Bulk sampling · Drilling (core or destructive)
  • 10.
    Landsat images • Landsatsatellites that have acquired valuable remote sensing data for mineral exploration and other applications. • The first generation Landsats 1, 2, and operated from 1972 to 1985. • The second generation Landsats 4, 5 and 7, which began in 1982 and continues to the present. • Landsat 6 of the second generation was launched in 1993, but failed to reach orbit.
  • 11.
    • The TMsystem records three wavelengths of visible energy blue, green, and red (Band 1, 2 and 3) and three ba nds of reflected IR energy (Band 4, 5 and 7). These visible and reflected IR have a spatial resolution of 30 m. • Band 6 records thermal IR energy 10.5 to 12.5 mm with a spatial resolution of 120 m. • Each TM scene records 170 by 185 km of terrain. The image data are telemetered to earth receiving stations. • The second generation of Landsat continued with Landsat 7, launched in April, 1999, with an enhanced TM system. A panchromatic band 8 0.52 to 0.90 mm with spatial resol ution of 15 m is added.
  • 12.
    Fig. 1. LandsatTM visible and reflected IR images of Goldfield mining district, NV. (A) Band 1, blue 0.45 to 0.52 mm. (B) Band 2, green 0.52 to 0.60 mm. (C) Band 3, red 0.63 to 0.69 mm. (D) Band 4 reflected IR 0.76 to 0.90 mm. (E) Band 5, reflected IR 1.55 to 1.75 mm. (F) Band 7, refle cted IR 2.08 to 2.35 mm.
  • 15.
    Spectral reflectance curve Fig.2. Spectral bands recorded by remote sensing systems. Spectral reflectance curves are for vegetation and sedimentary rocks. From Sabins (1997, Fig. 4-1)
  • 16.
    Digital image processing Sabins,1997 groups image-processing methods into three functional categories : • Image restoration compensates for image errors, noise, and geometric distortions introduced during the scanning, recording, and playback operations. The objective is to make the restored image resemble the scene on the terrain. • Image enhancement alters the visual impact that the image has on the interpreter. The objective is to improve the information content of the image. • Information extraction utilizes the computer to combine and interact between different aspects of a data set. The objective is to display spectral and other characteristics of the scene that are not apparent on restored and enhanced images.
  • 17.
    These studies describetwo different approaches to mineral exploration. Mapping of geology and fracture patterns at regional and local scales. • Rowan and Wetlaufer 1975 used a Landsat mosaic of Nevada to interpret regional lineaments.Comparing the lineament patterns with ore occurrences showed that mining districts tend to occur along lineaments and are concentrated at the intersections of lineaments. • Nicolais 1974 interpreted local fracture patterns from a Landsat image in Colorado. The mines tend to occur in areas with a high density of fractures and a concentration of fracture intersections. • Rowan and Bowers 1995 used TM and aircraft radar images to interpret linear features in western Nevada. They concluded that the linear features correlate with the geologic structures that controlled mineralization.
  • 18.
    Recognition of hydrothermallyaltered rocks that may be associated with mineral deposits. • The spectral bands of Landsat TM are well-suited for recognizing assemblages of alteration minerals iron oxides, clay, and alunite that occur in hydrothermally altered rocks. In my experience the best exploration results are obtained by combining geologic and fracture mapping with the recognition of hydrothermally altered rocks.
  • 19.
    Mapping hydrothermal alteration atepithermal vein deposits -- Gold field, Nevada • Many mines were discovered by recognizing outcrops of altered rocks, followed by assays of rock samples. • Today remote sensing and digital image processing enable us to use additional spectral bands for mineral exploration. • In regions where bedrock is exposed, multispectral remote sensing can be used to recognize altered rocks because their reflectance spectra differ from those of the unaltered country rock. • The Goldfield Mining District in south-central Nevada is the test site where remote sensing methods were first developed to recognize hydrot hermally altered rocks (Rowan et al., 1974)
  • 20.
    1. Geology, oredeposits, and hydrothermal alteration – The Goldfield district was noted for the richness of its ore. – Volcanism began in the Oligocene epoch with eruption of rhyolite and quartz latite flows and the formation of a small caldera and rin g-fracture system. – Hydrothermal alteration and ore deposition occurred during a second period of volcanism in the early Miocene epoch when the d acite and andesite flows that host the ore deposits were extruded. – Following ore deposition, the area was covered by younger volcanic flows. – Later doming and erosion have exposed the older volcanic center with altered rocks and ore deposits.
  • 21.
    2. Recognizing hydrothermal alterationon Landsat images Fig. 4A, an enhanced normal color image of TM bands 1–2–3 shown in blue, green, and red, respectively.
  • 22.
    2.1. Alunite andclay minerals on 5/7 ratio images Fig. 5A shows reflectance spectra of alunite and the three common hydrothermal clay minerals illite, kaolinite, and montmorillonite. These minerals have distinctive absorpti on features reflectance minima at wavelengths within the bandpass of TM band 7 whic h is shown with a stippled pattern in Fig. 5A.
  • 23.
    Calculation of TMratio values Table 2
  • 24.
    Fig. 5B isa 5/7 ratio image of Goldfield with higher ratio values shown in brighter tones. Comparing the image with the map Fig. 4 shows that the high ratio values cor relate with hydrothermally altered rocks.
  • 25.
    Histogram Fig. 5C isa histogram of the 5/7 ratio image that shows the higher ratio values (DNs >145) of the altered rocks. Low ratio values represent unaltered rocks.
  • 26.
    Fig. 6C isa color density slice version of the 5/7 image in which the gray scale is replaced by the colors shown in the histogram (Fig. 5C) . Highest ratio values DN>145 are shown in red, with the next highest values DN 125 to 145 shown in yellow. The red and yellow colors on the ratio image (Fig. 3C) therefore correlate with the altered rocks.
  • 27.
    Fig. 3D isa color density slice version of the 3/1 image, with color assignments shown in the histogram of Fig. 7C. Highest ratio values DN>150 are shown in r ed, with the next highest values DN 135 to 150 shown in yellow. The red and ye llow colors therefore correlate with the altered rocks.
  • 28.
    2.4. Classification images •Multispectral classification is a computer routine for information extraction that assigns pixels into classes based on similar spectral pro perties. • supervised multispectral classification, the operator specifies the classes that will be used (Sabins, 1997. Chap.8). • unsupervised multispectral classification, the computer specifies the classes that will be used (Sabins, 1997. Chap. 8).
  • 29.
    Fig. 3E TMunsupervised classification map.
  • 30.
  • 31.
  • 32.
    References • Floyd F.Sabins (Actual owner of this ppt) • Google

Editor's Notes

  • #3 A rock is an assemblage of minerals
  • #4 Note underlined phrases, particularly current economic conditions
  • #5 Crust is the outer 20 km of earth Underlain by mantle - about 3000 km thick Underlain by core - about 3400 km thick
  • #6 Magma - molten rock beneath surface of earth Lava - molten rock above surface that could ruin your day
  • #7 Should say that intrusions not necessary for metamorphism
  • #8 Hydrothermal deposits are probably being formed as we speak in Yellowstone National Park
  • #9 The most interesting mineral crystal structures form in sedimentary environments.
  • #10 These are roughly in increasing order of cost per square km