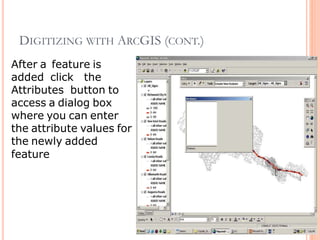
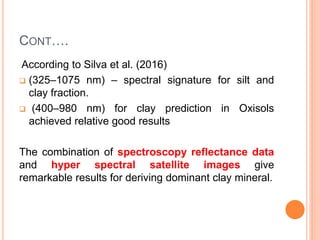
WELCOME
COURSE SEMINAR
Topic: Remote sensing , GIS and Their application for Soil
Fertility Mapping
Supervisor Speaker : Sukirtee
Dr. Y.V. Singh
I.D. No. – S-15195
DEPARTMENTOFSOILSCIENCEANDAGRIL. CHEMISTRY
INSTITUTEOFAGRICULTURALSCIENCES
BANARASHINDUUNIVERSITY
VARANASI-221005
INDIA
ON
Introduction to
Remote Sensing
REMOTE SENSING
Collecting information primarily by
sensing radiation that is naturally
emitted or reflected by the Earth’s
surface or from the atmosphere, or by
sensing signals transmitted from a
device and reflected back to it.
Remote Sensing Process Components
Energy Source or Illumination (A)
Radiation and the Atmosphere (B)
Interaction with the Target (C)
Recording of Energy by the Sensor (D)
Transmission, Reception, and
Processing (E)
Interpretation and Analysis(F)
Application (G)
MAJOR COMPONENTS OF REMOTE SENSING TECHNOLOGY
1. Energy Source:
2. Platforms
TYPES OF REMOTE SENSING
Two Types:
1.Passive Remote Sensing: Makes use of
sensors that detect reflected or emitted
electro-magnetic radiation (EMR) from
natural sources.
2.Active Remote Sensing: Makes use of
sensors that detect reflected responses from
objects that are irradiated from artificially-
generated energy sources, such as radar.
Passive Remote Sensing
Active Remote Sensing
PLATFORMS USED TO ACQUIRE REMOTE
SENSING DATA
• Aircraft
– Low, medium & high altitude
– Higher level of spatial detail
• Satellite
– Polar-orbiting
• 800-900 km altitude, 90-100 minutes/orbit
– Geo-synchronous
• 35,900 km altitude, 24 hrs/orbit
• stationary relative to Earth
MULTISPECTRAL REMOTE SENSING
SATELLITES
• NOAA-AVHRR (1100 m)
• GOES (700 m)
• MODIS (250, 500, 1000 m)
• Landsat TM and ETM (30 – 60 m)
• SPOT (10 – 20 m)
• IKONOS (4, 1 m)
• Quickbird (0.6 m)
MODIS Land Reflectance and Sea Surface
Temperature
(Geographical Information System)
GIS DEFINITION….
A GIS is an organized collection of computer
hardware, software, geographic data and
personnel designed to efficiently capture, store,
update, manipulate, analyze and display all forms of
geographically referenced information (ESRI 1990).
A GIS may be thought of as a higher order map (star
and estes 1990)
DATA SOURCES
1. Conventional Data sources
A) Primary Data Source
First Hand Observation e.g. Socioeconomic
data, Meteorological data
B) Secondary Data Source
Collected, Compiled & Published
2. Direct Data Sources
3. Existing Data Source
3. Existing Data Sources
a) www.nrsa.gov.in
b) www.landcover.gov.in
c) www.ersu.com
d) www.fgdc.gov.in
e) www.spaceimagine.com
Assessment of Soil Resources using Remote Sensing
and GIS Techniques in Mathura District, Uttar
Pradesh
FCC covering study area as on May 2, 2000 (RGB -B432, IRS-1C, LISS III)
Yamuna River
Vrindavan
Undulating Recent Alluvial Plain (Slope 5-10%)
Active Flood Plain (Slope 0-1%)
Old alluvial Plain (Slope1-3%)
Yamuna River
181
181
181
181
181
183 183
183
183
184
178
177
179
170
170
169
185
02 2 4
Km
Physiographic map of the study
area
Soil Reaction
Cation Exchange
Capacity
Base Saturation
%
Fig. 4.7 Fig. 4.8
(%)
Fig. 4.7 Fig. 4.8
DTPA Fe
DTPA Mn
Fig. 4.12
Fig. 4.13
Fig. 4.14
Fig. 4.15
DTPA Zn
DTPA Cu
LEGEND LEGEND
LEGEND
LEGEND
LEGEND
LEGEND
LEGEND
LEGEND
Fig. 4.41 Fig. 4.42
MECHANISM OF MAPPING
Three step process:
 Collection of information
 Quantitative and Qualitative assessment of soil
properties by using regression model
• PLSR (Partial least square regression) for sand,silt,clay
• MARS( multivariate adaptive Regression splin) salinity
• SMLR ( Stepwise multiple linear regression ) heavy
metal
• PCR(principal component regression ) slope information
 Mapping using ArcGIS
DIGITIZING WITH ARCGIS
 Add the new feature
classes to the data
frame that holds
your source map
 Turn on the Editor
toolbar
(View>Toolbars
>Editor)
DIGITIZING WITH ARCGIS (CONT.)
 Click Editor>Start
Editing
 Select the layer
you’d like to edit
from the Target
drop- down list
DIGITIZING WITH ARCGIS (CONT.)
 Select the Create
New Feature task
from the Task drop-
down list
 Click the sketch tool
(pencil)
DIGITIZING WITH ARCGIS (CONT.)
 If digitizing point features, a single left- click
with the sketch tool will create a new point.
 If digitizing line or polygon features, left-
clicking will place a vertex. Vertices should
be placed along the length of the map feature.
A line or polygon feature is completed and
added to the feature class by double-clicking on
the last vertex or by right-clicking and choosing
Finish Sketch
DIGITIZING WITH ARCGIS (CONT.)
After a feature is
added click the
Attributes button to
access a dialog box
where you can enter
the attribute values for
the newly added
feature
DIGITIZING WITH ARCGIS (CONT.)
 Continue digitizing features in the feature
class. To add features to a different
feature class, choose another layer in the
Target drop-down list.
 When all editing is complete, choose
Editor>Stop Editing.
 Note: it is a good idea to periodically save your
work when digitizing a lot of features by
clicking Editor>Save Edits
STUDY OF CLAY MINERALS…..
AVIRIS data (van-der-Meer, 2004) According to
these studies absorption band position of
 hematite the strong absorption in the visible
light range.
 In calcite, the major component of limestone, the
carbonate ion (CO3 = ) is responsible for a series of
absorption bands between 1.8 and 2.4 mm
 Kaolinite – Spectral signature of kaolinite is around
weak 1.9 mm band( Hydroxyl ions)
 Montmorillonite – spectral signature is in Strong 1.9
mm band( Bound water molecules)
CONT….
According to Silva et al. (2016)
 (325–1075 nm) – spectral signature for silt and
clay fraction.
 (400–980 nm) for clay prediction in Oxisols
achieved relative good results
The combination of spectroscopy reflectance data
and hyper spectral satellite images give
remarkable results for deriving dominant clay mineral.
SPECTRAL LIBRARIES
Spectral libraries For example, the ASTER spectral
library version 2.0, which is a collection of
contributions from the Jet Propulsion Laboratory,
Johns Hopkins University and the United States
Geological Survey, is a widely used spectral library
which contains over 2400 spectra of a wide variety of
minerals, rocks, vegetation and manmade materials
covering the wavelength range 0.4–15.4 μm
(Baldridge et.al., 2008).Used to match collected
spectral samples to those in the spectra.
Spectral reflectance of different clay minerals. (Source: Clark,
1999).
SOIL CONTAMINATION
Diffuse reflectance spectroscopy (DRS) in visible-
near infrared (VNIR) region (400–2500 nm) has been
used to quickly analyse contamination of heavy
metals.
 Pb and Zn – 2010 and 2149 nm respectively.
 Mn and Cu – 2072 and 2139 nm
Mohamed et al. (2016)
 The areas affected by concentration of heavy elements. (Source;
Mohamed et al., 2016).
LAND SUITABILITY FOR COTTON IN RINGNABODY
WATERSHED IN MAHARASHTRA….
 Study conducted by N. Walke et.al in Ringnabodi
watershed is located in Nagpur district,
Maharashtra.
 Methodology given in the FAO frame work on land
evaluation (FAO,1976,1985)
 Land area is assigned a suitability for a land use
 S1 – Highly suited
 S2- Moderately suited
 S3 – Marginally suited
 N1 – Unsuited for economic reasons
 N2 – Unsuited for physical reasons
Soil suitability for cotton (N.walke et.al. 2012)
CONCLUSION
 Under the current situations, the conventional
methods of soil analyses takes a long time, in
addition to their expensive costs.
 Different remote sensing data and NIRS can be
maximized the ability to cover and investigate large
surfaces in a single flight.
 The generated GIS-based thematic maps could be
used by extension scientists and farmers to choose
a crop for specific areas to enhance crop
productivity.
Thank You

Remote sensing presentation

  • 1.
  • 2.
    COURSE SEMINAR Topic: Remotesensing , GIS and Their application for Soil Fertility Mapping Supervisor Speaker : Sukirtee Dr. Y.V. Singh I.D. No. – S-15195 DEPARTMENTOFSOILSCIENCEANDAGRIL. CHEMISTRY INSTITUTEOFAGRICULTURALSCIENCES BANARASHINDUUNIVERSITY VARANASI-221005 INDIA ON
  • 3.
  • 4.
    REMOTE SENSING Collecting informationprimarily by sensing radiation that is naturally emitted or reflected by the Earth’s surface or from the atmosphere, or by sensing signals transmitted from a device and reflected back to it.
  • 5.
    Remote Sensing ProcessComponents Energy Source or Illumination (A) Radiation and the Atmosphere (B) Interaction with the Target (C) Recording of Energy by the Sensor (D) Transmission, Reception, and Processing (E) Interpretation and Analysis(F) Application (G)
  • 7.
    MAJOR COMPONENTS OFREMOTE SENSING TECHNOLOGY 1. Energy Source: 2. Platforms
  • 8.
    TYPES OF REMOTESENSING Two Types: 1.Passive Remote Sensing: Makes use of sensors that detect reflected or emitted electro-magnetic radiation (EMR) from natural sources. 2.Active Remote Sensing: Makes use of sensors that detect reflected responses from objects that are irradiated from artificially- generated energy sources, such as radar.
  • 9.
  • 10.
    PLATFORMS USED TOACQUIRE REMOTE SENSING DATA • Aircraft – Low, medium & high altitude – Higher level of spatial detail • Satellite – Polar-orbiting • 800-900 km altitude, 90-100 minutes/orbit – Geo-synchronous • 35,900 km altitude, 24 hrs/orbit • stationary relative to Earth
  • 11.
    MULTISPECTRAL REMOTE SENSING SATELLITES •NOAA-AVHRR (1100 m) • GOES (700 m) • MODIS (250, 500, 1000 m) • Landsat TM and ETM (30 – 60 m) • SPOT (10 – 20 m) • IKONOS (4, 1 m) • Quickbird (0.6 m)
  • 12.
    MODIS Land Reflectanceand Sea Surface Temperature
  • 13.
  • 14.
    GIS DEFINITION…. A GISis an organized collection of computer hardware, software, geographic data and personnel designed to efficiently capture, store, update, manipulate, analyze and display all forms of geographically referenced information (ESRI 1990). A GIS may be thought of as a higher order map (star and estes 1990)
  • 18.
    DATA SOURCES 1. ConventionalData sources A) Primary Data Source First Hand Observation e.g. Socioeconomic data, Meteorological data B) Secondary Data Source Collected, Compiled & Published 2. Direct Data Sources 3. Existing Data Source
  • 19.
    3. Existing DataSources a) www.nrsa.gov.in b) www.landcover.gov.in c) www.ersu.com d) www.fgdc.gov.in e) www.spaceimagine.com
  • 21.
    Assessment of SoilResources using Remote Sensing and GIS Techniques in Mathura District, Uttar Pradesh
  • 22.
    FCC covering studyarea as on May 2, 2000 (RGB -B432, IRS-1C, LISS III) Yamuna River Vrindavan
  • 23.
    Undulating Recent AlluvialPlain (Slope 5-10%) Active Flood Plain (Slope 0-1%) Old alluvial Plain (Slope1-3%) Yamuna River 181 181 181 181 181 183 183 183 183 184 178 177 179 170 170 169 185 02 2 4 Km Physiographic map of the study area
  • 24.
  • 25.
    % Fig. 4.7 Fig.4.8 (%) Fig. 4.7 Fig. 4.8
  • 27.
    DTPA Fe DTPA Mn Fig.4.12 Fig. 4.13 Fig. 4.14 Fig. 4.15 DTPA Zn DTPA Cu
  • 28.
  • 29.
  • 31.
  • 32.
    MECHANISM OF MAPPING Threestep process:  Collection of information  Quantitative and Qualitative assessment of soil properties by using regression model • PLSR (Partial least square regression) for sand,silt,clay • MARS( multivariate adaptive Regression splin) salinity • SMLR ( Stepwise multiple linear regression ) heavy metal • PCR(principal component regression ) slope information  Mapping using ArcGIS
  • 33.
    DIGITIZING WITH ARCGIS Add the new feature classes to the data frame that holds your source map  Turn on the Editor toolbar (View>Toolbars >Editor)
  • 34.
    DIGITIZING WITH ARCGIS(CONT.)  Click Editor>Start Editing  Select the layer you’d like to edit from the Target drop- down list
  • 35.
    DIGITIZING WITH ARCGIS(CONT.)  Select the Create New Feature task from the Task drop- down list  Click the sketch tool (pencil)
  • 36.
    DIGITIZING WITH ARCGIS(CONT.)  If digitizing point features, a single left- click with the sketch tool will create a new point.  If digitizing line or polygon features, left- clicking will place a vertex. Vertices should be placed along the length of the map feature. A line or polygon feature is completed and added to the feature class by double-clicking on the last vertex or by right-clicking and choosing Finish Sketch
  • 37.
    DIGITIZING WITH ARCGIS(CONT.) After a feature is added click the Attributes button to access a dialog box where you can enter the attribute values for the newly added feature
  • 38.
    DIGITIZING WITH ARCGIS(CONT.)  Continue digitizing features in the feature class. To add features to a different feature class, choose another layer in the Target drop-down list.  When all editing is complete, choose Editor>Stop Editing.  Note: it is a good idea to periodically save your work when digitizing a lot of features by clicking Editor>Save Edits
  • 39.
    STUDY OF CLAYMINERALS….. AVIRIS data (van-der-Meer, 2004) According to these studies absorption band position of  hematite the strong absorption in the visible light range.  In calcite, the major component of limestone, the carbonate ion (CO3 = ) is responsible for a series of absorption bands between 1.8 and 2.4 mm  Kaolinite – Spectral signature of kaolinite is around weak 1.9 mm band( Hydroxyl ions)  Montmorillonite – spectral signature is in Strong 1.9 mm band( Bound water molecules)
  • 40.
    CONT…. According to Silvaet al. (2016)  (325–1075 nm) – spectral signature for silt and clay fraction.  (400–980 nm) for clay prediction in Oxisols achieved relative good results The combination of spectroscopy reflectance data and hyper spectral satellite images give remarkable results for deriving dominant clay mineral.
  • 41.
    SPECTRAL LIBRARIES Spectral librariesFor example, the ASTER spectral library version 2.0, which is a collection of contributions from the Jet Propulsion Laboratory, Johns Hopkins University and the United States Geological Survey, is a widely used spectral library which contains over 2400 spectra of a wide variety of minerals, rocks, vegetation and manmade materials covering the wavelength range 0.4–15.4 μm (Baldridge et.al., 2008).Used to match collected spectral samples to those in the spectra.
  • 42.
    Spectral reflectance ofdifferent clay minerals. (Source: Clark, 1999).
  • 43.
    SOIL CONTAMINATION Diffuse reflectancespectroscopy (DRS) in visible- near infrared (VNIR) region (400–2500 nm) has been used to quickly analyse contamination of heavy metals.  Pb and Zn – 2010 and 2149 nm respectively.  Mn and Cu – 2072 and 2139 nm Mohamed et al. (2016)
  • 44.
     The areasaffected by concentration of heavy elements. (Source; Mohamed et al., 2016).
  • 45.
    LAND SUITABILITY FORCOTTON IN RINGNABODY WATERSHED IN MAHARASHTRA….  Study conducted by N. Walke et.al in Ringnabodi watershed is located in Nagpur district, Maharashtra.  Methodology given in the FAO frame work on land evaluation (FAO,1976,1985)  Land area is assigned a suitability for a land use  S1 – Highly suited  S2- Moderately suited  S3 – Marginally suited  N1 – Unsuited for economic reasons  N2 – Unsuited for physical reasons
  • 46.
    Soil suitability forcotton (N.walke et.al. 2012)
  • 47.
    CONCLUSION  Under thecurrent situations, the conventional methods of soil analyses takes a long time, in addition to their expensive costs.  Different remote sensing data and NIRS can be maximized the ability to cover and investigate large surfaces in a single flight.  The generated GIS-based thematic maps could be used by extension scientists and farmers to choose a crop for specific areas to enhance crop productivity.
  • 48.