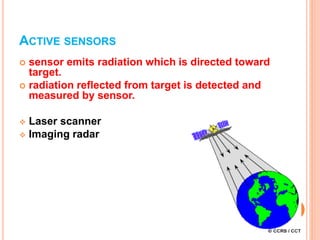
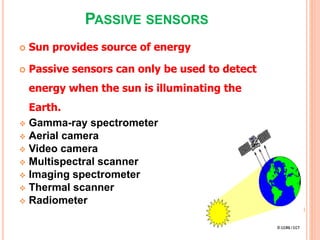
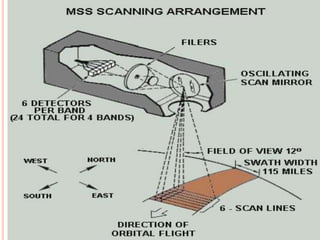
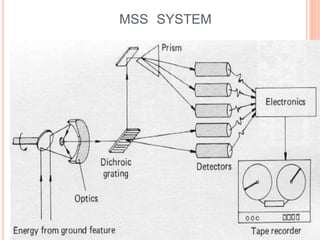
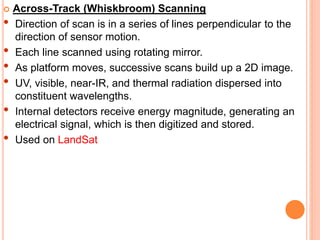
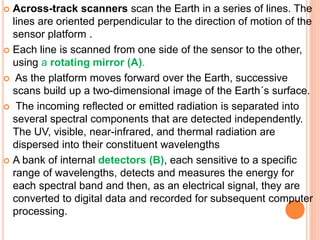
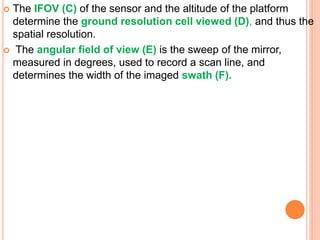
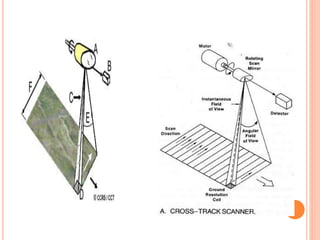
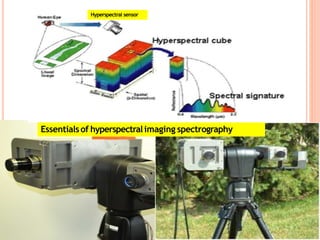
SENSORS AND SCANNERS
SENSORS
 Sensor is a device that gathers
electromagnetic radiations, converts it into
a signal and presents it in a form suitable
for obtaining information about the objects
under investigation.
The specific parameters of sensors are
 Spatial resolution.
 Spectral resolution.
 Radiometric resolution
 Temporal resolution
SPATIAL RESOLUTION
It is the capability of the sensor to
distinguish two closed spaced object
surfaces as two different object
surfaces.
As a rule, with an increasing resolution
the identification of even smaller object
surfaces become possible
SPECTRAL RESOLUTION
It refers to the sensing and
recording power of the sensor in
different bands of EMR
(Electromagnetic radiation).
RADIOMETRIC RESOLUTION
It is the capability of the sensor to
discriminate between two targets.
Higher the radiometric resolution,
smaller the radiance differences that
can be detected between two targets.
TEMPORAL RESOLUTION
represents the capability to view the
same target, under similar
conditions, at regular intervals.
ON THE BASIS OF ENERGY SOURCE
Sensors can be grouped, either on the basis of energy
source or on the
basis of wave bands employed. Based on energy
sources, sensors are
classified as follows
 1. Active sensor
An active sensor operates by emitting its own energy
which is needed to detect the various phenomena
(eg.: RADAR)
 2. Passive sensor
The operation of passive sensor is dependent on the
existing sources of energy, like sun (eg.:
Photographic systems, multi spectral scanners)
ACTIVE SENSORS
 sensor emits radiation which is directed toward
target.
 radiation reflected from target is detected and
measured by sensor.
 Laser scanner
 Imaging radar
PASSIVE SENSORS
 Sun provides source of energy
 Passive sensors can only be used to detect
energy when the sun is illuminating the
Earth.
 Gamma-ray spectrometer
 Aerial camera
 Video camera
 Multispectral scanner
 Imaging spectrometer
 Thermal scanner
 Radiometer
SENSORS CAN BE
 non-imaging - measures radiation and
reports result as electrical signal
 imaging - electrons released are used to
excite or ionize a substance like silver (Ag) in
film or to drive an image producing device
like a TV or computer monitor.
SCANNING SYSTEM
A scanning system employs a detector with a
narrow field of view that is swept across the
terrain to produce an image.
When photons of electromagnetic energy
radiated / reflected from the terrain
encounter the detector, an electrical signal is
produced that varies in proportion to the
number of photons. The electrical signal is
amplified, recorded on magnetic tape and
played back later to produce an image.
 A scanning system used to collect data over a variety of
different wavelength ranges is called a multispectral scanner
(MSS), and is the most commonly used scanning system.
Multispectral scanners sense in very narrow
spectral bands, but over a greater range of the EM
spectrum
Multispectral scanners using electronic detectors can
extend the range from 0.3m to about 14m; this covers:
UV, visible, near-IR, mid-IR, and thermal IR
MSS SYSTEM
TYPES OF SCANNERS
 Cross-trackscanner
 Along-trackscanner
 Circularscanner
 Side- scanningsystem
Multispectral scanner images are acquired
through across-track and along-track
scanning.
INSTANTANEOUS FIELD OF VIEW (IFOV)
Instantaneous field of view (IFOV) is
the angular field of view of the sensor,
independent of height
 Across-Track (Whiskbroom) Scanning
• Direction of scan is in a series of lines perpendicular to the
direction of sensor motion.
• Each line scanned using rotating mirror.
• As platform moves, successive scans build up a 2D image.
• UV, visible, near-IR, and thermal radiation dispersed into
constituent wavelengths.
• Internal detectors receive energy magnitude, generating an
electrical signal, which is then digitized and stored.
• Used on LandSat
 Across-track scanners scan the Earth in a series of lines. The
lines are oriented perpendicular to the direction of motion of the
sensor platform .
 Each line is scanned from one side of the sensor to the other,
using a rotating mirror (A).
 As the platform moves forward over the Earth, successive
scans build up a two-dimensional image of the Earth´s surface.
 The incoming reflected or emitted radiation is separated into
several spectral components that are detected independently.
The UV, visible, near-infrared, and thermal radiation are
dispersed into their constituent wavelengths
 A bank of internal detectors (B), each sensitive to a specific
range of wavelengths, detects and measures the energy for
each spectral band and then, as an electrical signal, they are
converted to digital data and recorded for subsequent computer
processing.
 The IFOV (C) of the sensor and the altitude of the platform
determine the ground resolution cell viewed (D), and thus the
spatial resolution.
 The angular field of view (E) is the sweep of the mirror,
measured in degrees, used to record a scan line, and
determines the width of the imaged swath (F).
LANDSAT WITH WHISKBROOM SCANNER
 Along-Track (Pushbroom) Scanning
• No rotating mirror
• Linear detector array, or charged coupled device (CCD), about
6000 sensors
• Each detector projects IFOV
• Recorded signal  total radiation in IFOV
• At any instant, row of pixels formed
• Row sweeps to form 2D image
• Used on SPOT satellites
 However, instead of a scanning mirror, they use a linear array of
detectors (A) located at the focal plane of the image (B) formed
by lens systems (C), which are "pushed" along in the flight track
direction (i.e. along track).
 Each individual detector measures the energy for a single
ground resolution cell (D) and thus the size and IFOV of the
detectors determines the spatial resolution of the system.
 For each scan line, the energy detected by each detector is
sampled electronically and digitally recorded.
 Along-track scanners with linear arrays have several
advantages over across-track mirror scanners.
 The array of detectors combined with the pushbroom motion
allows each detector to "see" and measure the energy from
each ground resolution cell for a longer period of time
 This allows more energy to be detected and improves the
radiometric resolution.
 The increased dwell time also facilitates smaller IFOVs and
narrower bandwidths for each detector.
 Thus, finer spatial and spectral resolution can be achieved
without impacting radiometric resolution.
 Because detectors are usually solid-state microelectronic
devices, they are generally smaller, lighter, require less power,
and are more reliable and last longer because they have no
moving parts.
 On the other hand, cross-calibrating thousands of detectors to
achieve uniform sensitivity across the array is necessary and
complicated.
SPOT CARRIES TWO IDENTICAL
HRV(HIGH RESOLUTION VISIBLE)
PUSHBROOM SCANNERS
WHISKBROOM & PUSHBROOMSCANNERS
CIRCULAR SCANNERS
In this , the scan motor and mirror are
mounted with a vertical axis of rotation
that sweeps circular path on the
terrain.
Only the forward portion of the sweep
is recorded to produce images.
Circular scanners are used for
reconnaissance purposes in
aircraft.
SIDE-SCANNING SYSTEM
Side-scanning system is primarily an
active system which provides their
own energy sources.
The example given here is a radar
system that transmits pulses of
microwave energy to one side of the
flight path and records the energy
scattered from the terrain back to the
antenna.
Thermal scanner
Thermal scanner is a special kind of
across track multispectral scanner which
senses the energy in the thermal
wavelength range of the EMR spectrum.
Thermal infrared radiation refers to
electromagnetic waves with wavelength 3-
14 μm.
 The Advanced Spaceborne Thermal Emission
and Reflection Radiometer (ASTER) onboard
Terra, Thermal Infrared Multispectral Scanner
(TIMS) developed jointly by NASA JPL and
the Daedalus Corporation are some of the
examples.
 ASTER data is used to create detailed maps of
land surface temperature, reflectance, and
elevation. TIMS is used as an airborne
geologic remote sensing tool to acquire mineral
signatures to discriminate minerals like silicate
and carbonate. It uses 6 wavelength channels .
 Spectral bands of the TIMS
Channel Wavelength μm
1 8.2-8.6
2 8.6-9.0
3 9.0-9.4
4 9.4-10.2
5 10.2-11.2
6 11.2-12.2
Since the energy received at the sensor decreases as the
wavelength increases, larger IFOVs are generally used in
thermal sensors to ensure that enough energy reaches the
detector for a reliable measurement.
Natural
image
Thermal
image
Hyperspectral Sensors
 Hyperspectral sensors (also known as
imaging spectrometers) are instruments
that acquire images in several, narrow,
contiguous spectral bands in the visible,
NIR, MIR, and thermal infrared regions of
the EMR spectrum.
Hyperspectral sensors may be along-
track or across-track.
 A typical hyperspectral scanner records more
than 100 bands and thus enables the
construction of a continuous reflectance
spectrum for each pixel.
 For example, the Hyperion sensor onboard
NASA’s EO-1 satellite images the earth's
surface in 220 contiguous spectral bands,
covering the region from 400 nm to 2.5 μm, at a
ground resolution of 30 m. The AVIRIS sensor
developed by the JPL contains four
spectrometers with a total of 224 individual
CCD detectors (channels), each with a spectral
resolution of 10 nanometers and a spatial
resolution of 20 meters.
Essentialsof hyperspectralimaging spectrography
Hyperspectral sensor
 From the data acquired in multiple, contiguous
bands, the spectral curve for any pixel can be
calculated that may correspond to an extended
ground feature.
 Hyperspectral sensors look at objects using a vast
portion of the electromagnetic spectrum. Certain
objects leave unique 'fingerprints' in the
electromagnetic spectrum Known as spectral
signatures.
 Hyperspectral imaging has wide ranging
applications in mining, geology, forestry,
agriculture, and environmental management.
 SWIR range enables discrimination of iron-
oxides, clays, carbonates, weathering products
from sulphides etc.

SENSORS AND SCANNERS.pptx

  • 1.
  • 2.
    SENSORS  Sensor isa device that gathers electromagnetic radiations, converts it into a signal and presents it in a form suitable for obtaining information about the objects under investigation. The specific parameters of sensors are  Spatial resolution.  Spectral resolution.  Radiometric resolution  Temporal resolution
  • 3.
    SPATIAL RESOLUTION It isthe capability of the sensor to distinguish two closed spaced object surfaces as two different object surfaces. As a rule, with an increasing resolution the identification of even smaller object surfaces become possible
  • 4.
    SPECTRAL RESOLUTION It refersto the sensing and recording power of the sensor in different bands of EMR (Electromagnetic radiation).
  • 5.
    RADIOMETRIC RESOLUTION It isthe capability of the sensor to discriminate between two targets. Higher the radiometric resolution, smaller the radiance differences that can be detected between two targets.
  • 6.
    TEMPORAL RESOLUTION represents thecapability to view the same target, under similar conditions, at regular intervals.
  • 7.
    ON THE BASISOF ENERGY SOURCE Sensors can be grouped, either on the basis of energy source or on the basis of wave bands employed. Based on energy sources, sensors are classified as follows  1. Active sensor An active sensor operates by emitting its own energy which is needed to detect the various phenomena (eg.: RADAR)  2. Passive sensor The operation of passive sensor is dependent on the existing sources of energy, like sun (eg.: Photographic systems, multi spectral scanners)
  • 8.
    ACTIVE SENSORS  sensoremits radiation which is directed toward target.  radiation reflected from target is detected and measured by sensor.  Laser scanner  Imaging radar
  • 9.
    PASSIVE SENSORS  Sunprovides source of energy  Passive sensors can only be used to detect energy when the sun is illuminating the Earth.  Gamma-ray spectrometer  Aerial camera  Video camera  Multispectral scanner  Imaging spectrometer  Thermal scanner  Radiometer
  • 10.
    SENSORS CAN BE non-imaging - measures radiation and reports result as electrical signal  imaging - electrons released are used to excite or ionize a substance like silver (Ag) in film or to drive an image producing device like a TV or computer monitor.
  • 11.
    SCANNING SYSTEM A scanningsystem employs a detector with a narrow field of view that is swept across the terrain to produce an image. When photons of electromagnetic energy radiated / reflected from the terrain encounter the detector, an electrical signal is produced that varies in proportion to the number of photons. The electrical signal is amplified, recorded on magnetic tape and played back later to produce an image.
  • 12.
     A scanningsystem used to collect data over a variety of different wavelength ranges is called a multispectral scanner (MSS), and is the most commonly used scanning system. Multispectral scanners sense in very narrow spectral bands, but over a greater range of the EM spectrum Multispectral scanners using electronic detectors can extend the range from 0.3m to about 14m; this covers: UV, visible, near-IR, mid-IR, and thermal IR
  • 14.
  • 15.
    TYPES OF SCANNERS Cross-trackscanner  Along-trackscanner  Circularscanner  Side- scanningsystem Multispectral scanner images are acquired through across-track and along-track scanning.
  • 16.
    INSTANTANEOUS FIELD OFVIEW (IFOV) Instantaneous field of view (IFOV) is the angular field of view of the sensor, independent of height
  • 17.
     Across-Track (Whiskbroom)Scanning • Direction of scan is in a series of lines perpendicular to the direction of sensor motion. • Each line scanned using rotating mirror. • As platform moves, successive scans build up a 2D image. • UV, visible, near-IR, and thermal radiation dispersed into constituent wavelengths. • Internal detectors receive energy magnitude, generating an electrical signal, which is then digitized and stored. • Used on LandSat
  • 18.
     Across-track scannersscan the Earth in a series of lines. The lines are oriented perpendicular to the direction of motion of the sensor platform .  Each line is scanned from one side of the sensor to the other, using a rotating mirror (A).  As the platform moves forward over the Earth, successive scans build up a two-dimensional image of the Earth´s surface.  The incoming reflected or emitted radiation is separated into several spectral components that are detected independently. The UV, visible, near-infrared, and thermal radiation are dispersed into their constituent wavelengths  A bank of internal detectors (B), each sensitive to a specific range of wavelengths, detects and measures the energy for each spectral band and then, as an electrical signal, they are converted to digital data and recorded for subsequent computer processing.
  • 19.
     The IFOV(C) of the sensor and the altitude of the platform determine the ground resolution cell viewed (D), and thus the spatial resolution.  The angular field of view (E) is the sweep of the mirror, measured in degrees, used to record a scan line, and determines the width of the imaged swath (F).
  • 21.
  • 22.
     Along-Track (Pushbroom)Scanning • No rotating mirror • Linear detector array, or charged coupled device (CCD), about 6000 sensors • Each detector projects IFOV • Recorded signal  total radiation in IFOV • At any instant, row of pixels formed • Row sweeps to form 2D image • Used on SPOT satellites
  • 23.
     However, insteadof a scanning mirror, they use a linear array of detectors (A) located at the focal plane of the image (B) formed by lens systems (C), which are "pushed" along in the flight track direction (i.e. along track).  Each individual detector measures the energy for a single ground resolution cell (D) and thus the size and IFOV of the detectors determines the spatial resolution of the system.  For each scan line, the energy detected by each detector is sampled electronically and digitally recorded.
  • 25.
     Along-track scannerswith linear arrays have several advantages over across-track mirror scanners.  The array of detectors combined with the pushbroom motion allows each detector to "see" and measure the energy from each ground resolution cell for a longer period of time  This allows more energy to be detected and improves the radiometric resolution.  The increased dwell time also facilitates smaller IFOVs and narrower bandwidths for each detector.  Thus, finer spatial and spectral resolution can be achieved without impacting radiometric resolution.  Because detectors are usually solid-state microelectronic devices, they are generally smaller, lighter, require less power, and are more reliable and last longer because they have no moving parts.  On the other hand, cross-calibrating thousands of detectors to achieve uniform sensitivity across the array is necessary and complicated.
  • 26.
    SPOT CARRIES TWOIDENTICAL HRV(HIGH RESOLUTION VISIBLE) PUSHBROOM SCANNERS
  • 27.
  • 28.
    CIRCULAR SCANNERS In this, the scan motor and mirror are mounted with a vertical axis of rotation that sweeps circular path on the terrain. Only the forward portion of the sweep is recorded to produce images. Circular scanners are used for reconnaissance purposes in aircraft.
  • 30.
    SIDE-SCANNING SYSTEM Side-scanning systemis primarily an active system which provides their own energy sources. The example given here is a radar system that transmits pulses of microwave energy to one side of the flight path and records the energy scattered from the terrain back to the antenna.
  • 32.
    Thermal scanner Thermal scanneris a special kind of across track multispectral scanner which senses the energy in the thermal wavelength range of the EMR spectrum. Thermal infrared radiation refers to electromagnetic waves with wavelength 3- 14 μm.
  • 33.
     The AdvancedSpaceborne Thermal Emission and Reflection Radiometer (ASTER) onboard Terra, Thermal Infrared Multispectral Scanner (TIMS) developed jointly by NASA JPL and the Daedalus Corporation are some of the examples.  ASTER data is used to create detailed maps of land surface temperature, reflectance, and elevation. TIMS is used as an airborne geologic remote sensing tool to acquire mineral signatures to discriminate minerals like silicate and carbonate. It uses 6 wavelength channels .
  • 34.
     Spectral bandsof the TIMS Channel Wavelength μm 1 8.2-8.6 2 8.6-9.0 3 9.0-9.4 4 9.4-10.2 5 10.2-11.2 6 11.2-12.2 Since the energy received at the sensor decreases as the wavelength increases, larger IFOVs are generally used in thermal sensors to ensure that enough energy reaches the detector for a reliable measurement.
  • 35.
  • 36.
    Hyperspectral Sensors  Hyperspectralsensors (also known as imaging spectrometers) are instruments that acquire images in several, narrow, contiguous spectral bands in the visible, NIR, MIR, and thermal infrared regions of the EMR spectrum. Hyperspectral sensors may be along- track or across-track.
  • 37.
     A typicalhyperspectral scanner records more than 100 bands and thus enables the construction of a continuous reflectance spectrum for each pixel.  For example, the Hyperion sensor onboard NASA’s EO-1 satellite images the earth's surface in 220 contiguous spectral bands, covering the region from 400 nm to 2.5 μm, at a ground resolution of 30 m. The AVIRIS sensor developed by the JPL contains four spectrometers with a total of 224 individual CCD detectors (channels), each with a spectral resolution of 10 nanometers and a spatial resolution of 20 meters.
  • 38.
  • 39.
     From thedata acquired in multiple, contiguous bands, the spectral curve for any pixel can be calculated that may correspond to an extended ground feature.  Hyperspectral sensors look at objects using a vast portion of the electromagnetic spectrum. Certain objects leave unique 'fingerprints' in the electromagnetic spectrum Known as spectral signatures.  Hyperspectral imaging has wide ranging applications in mining, geology, forestry, agriculture, and environmental management.  SWIR range enables discrimination of iron- oxides, clays, carbonates, weathering products from sulphides etc.