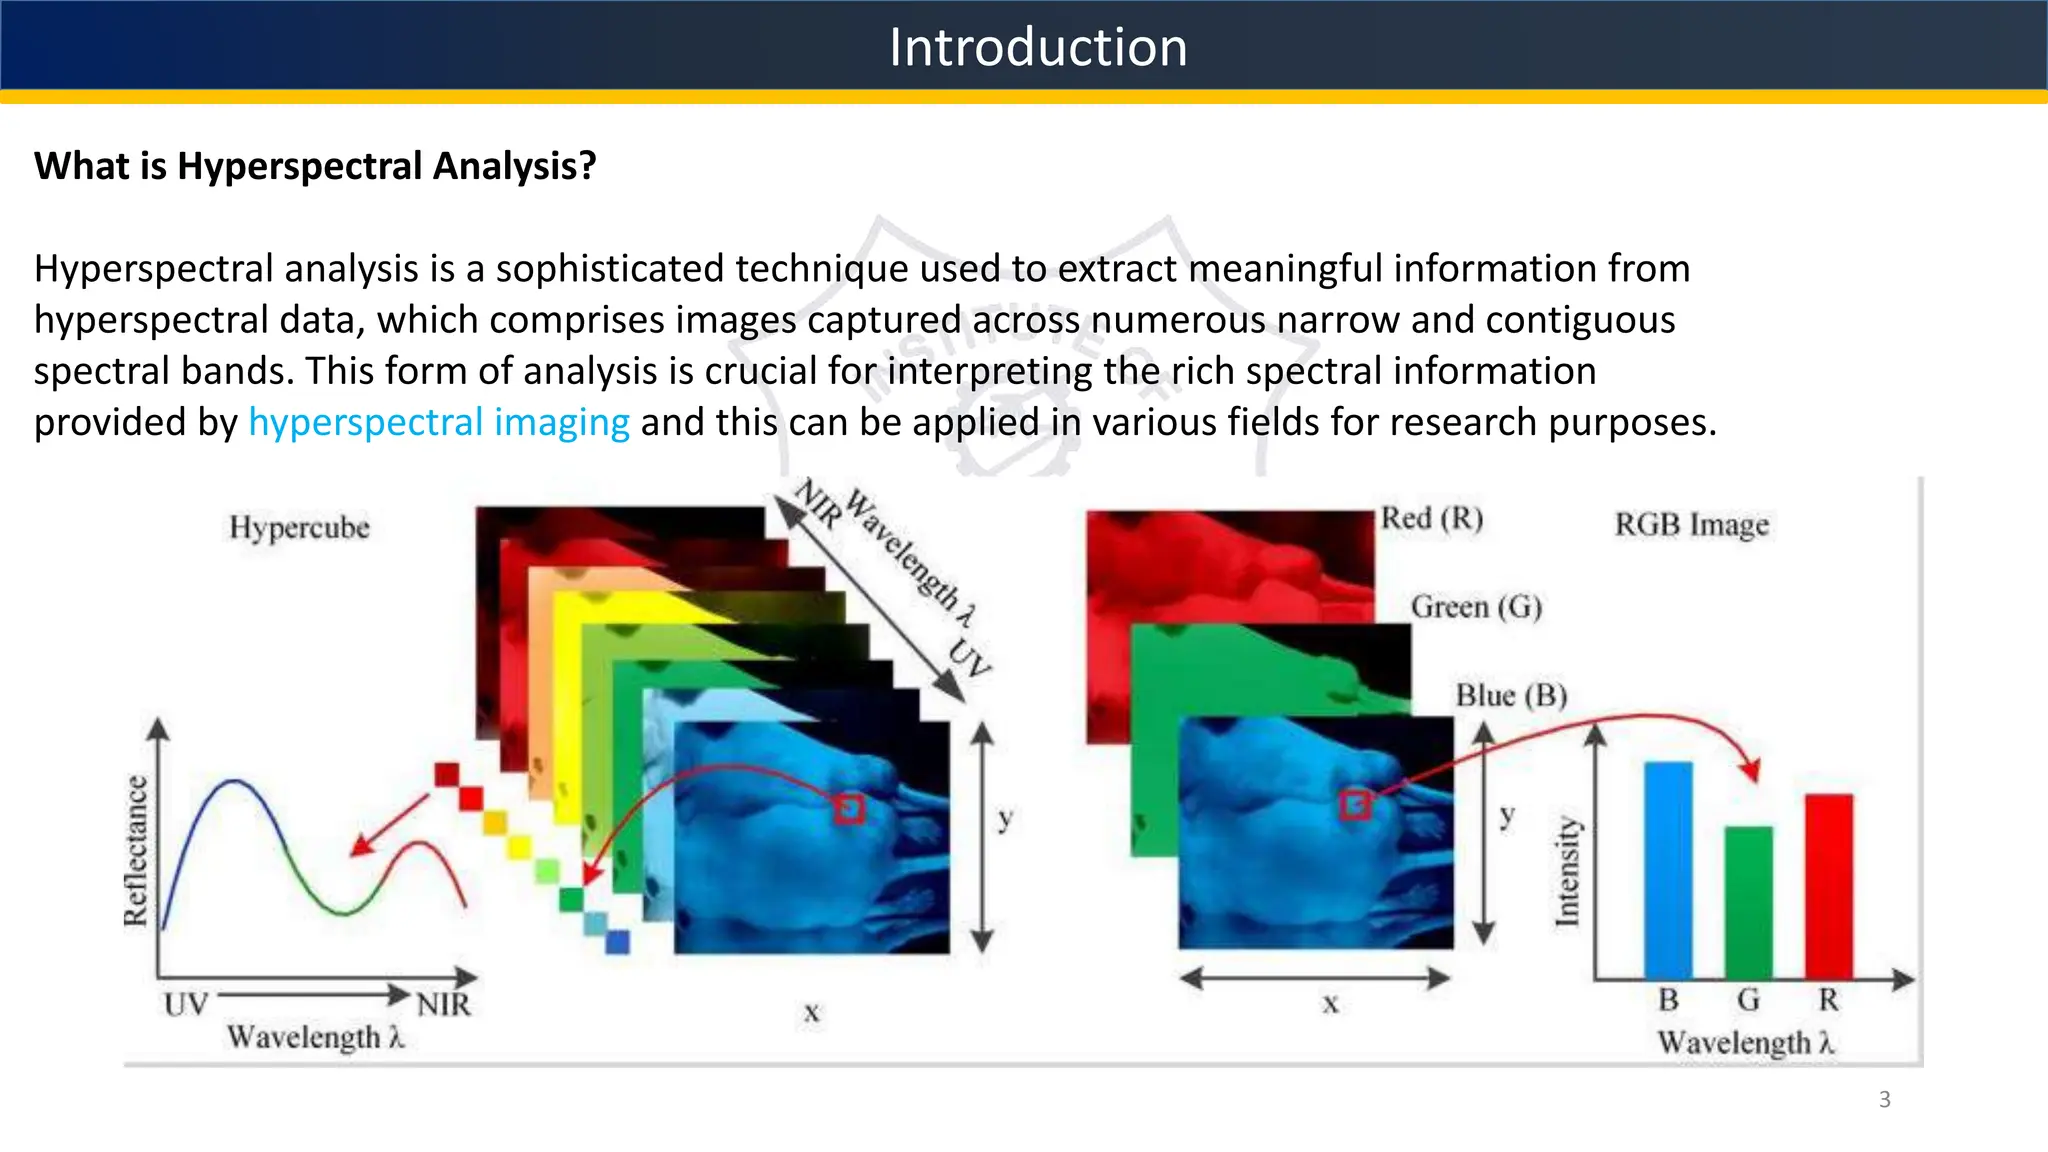
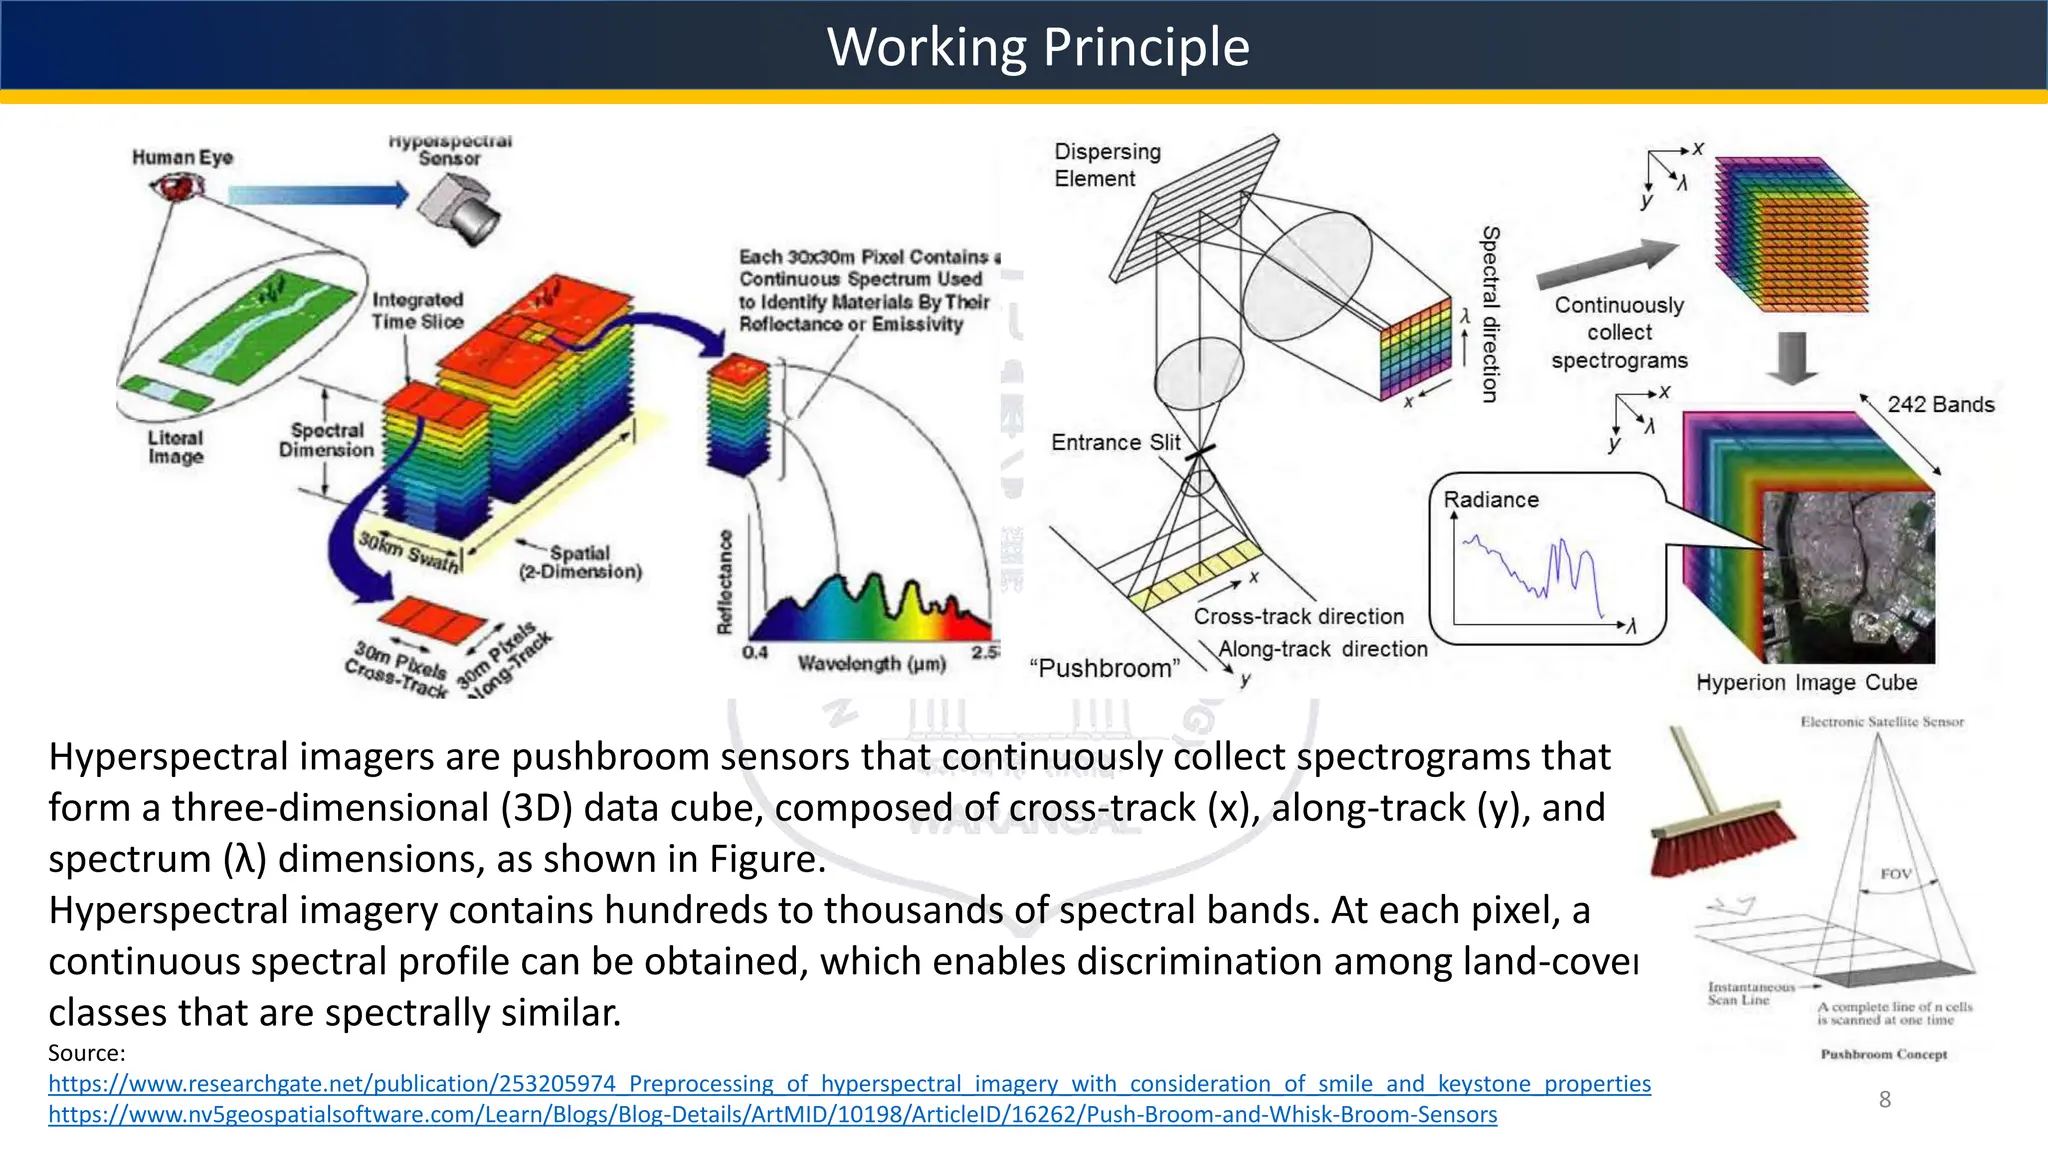
SlideShare a Scribd company logo
1 of 22
A presentation on
Hyperspectral Analysis
Remote sensing & Geographical Information Systems
Department of Civil Engineering
National Institute of Technology, Warangal
2024-2025
Presented by - Nilotpal Lahkar (23CEM5R09)
Navya Bharathi (23CEM5R11)
Sai Bharathi (23CEM5R12)
Vamshi Palaparthi (23CEM5R10)
Contents
2
Introduction
Working principle
Hyperspectral sensors
Applications of Hyperspectral analysis
Research Papers and references
Introduction
3
What is Hyperspectral Analysis?
Hyperspectral analysis is a sophisticated technique used to extract meaningful information from
hyperspectral data, which comprises images captured across numerous narrow and contiguous
spectral bands. This form of analysis is crucial for interpreting the rich spectral information
provided by hyperspectral imaging and this can be applied in various fields for research purposes.
Working Principle
4
What is Hyperspectral Imaging?
Hyperspectral imaging (HSI) is an advanced technique that combines imaging and spectroscopy to
capture information from across the electromagnetic spectrum. Unlike traditional imaging
techniques that capture only three bands of data (red, green, and blue), hyperspectral imaging
divides the spectrum into hundreds or even thousands of narrow, contiguous bands. In
hyperspectral imaging, each pixel in the image is represented by a spectrum, which is a complete
set of intensity values across all spectral bands. After the image is acquired, a data cube
(hypercube) consisting of spatial and spectral information appears.
Advantages
5
Advantages of Hyperspectral Imaging:
 Enhanced Spectral Resolution: Captures detailed spectral information for precise material identification. (e.g.- AVIRIS
with 224 spectral bands provides 4 m and Hyperion and CHRIS Proba have 15–30 m spatial resolutions)
 Improved Material Discrimination: Enables better differentiation between materials, aiding in various fields, by capturing
a much larger number of spectral bands across the electromagnetic spectrum. This detailed spectral information allows
for better differentiation between materials based on their unique spectral signatures.
 Detection of Subtle Changes: Can detect slight changes in material properties over time, by acquiring hyperspectral
images of the same area at different times, subtle changes in material properties can be detected by comparing the
spectral signatures of the same pixels over time. For example, changes in vegetation health, soil moisture content, or
surface minerals can be monitored over time.
 Target Identification and Analysis: Allows for specific target detection and analysis based on spectral signatures.
 Quantitative Analysis: Hyperspectral remote sensing provides quantitative analysis by utilizing spectral data to estimate
various material properties, such as mass and volume. Here's how it works: Volume Estimation: Hyperspectral imaging
can also be used to estimate the volume of materials, such as forests or crops. By combining spectral information with
spatial data, such as height or density, it is possible to estimate the volume of three-dimensional objects.
source- https://www.sciencedirect.com/topics/earth-and-planetary-sciences/hyperspectral-imaging
Difference
6
Hyperspectral vs Multispectral vs Optical Remote Sensing:
1.Spectral Resolution:
1. Hyperspectral: Provides very high spectral resolution, with numerous narrow and contiguous bands.
2. Multispectral: Offers moderate spectral resolution, with fewer bands than hyperspectral sensors.
3. Optical: Generally refers to visible and near-infrared bands, with lower spectral resolution compared to
hyperspectral and multispectral sensors.
2.Bandwidth and Coverage:
1. Hyperspectral: Covers a wide range of wavelengths with narrow bands, providing detailed spectral
information.
2. Multispectral: Covers broader wavelength ranges but with fewer bands compared to hyperspectral sensors.
3. Optical: Typically covers the visible and near-infrared spectrum, offering limited spectral information
compared to hyperspectral and some multispectral sensors.
3.Feature Discrimination:
1. Hyperspectral: Enables detailed discrimination between different materials or features based on their
spectral signatures.
2. Multispectral: Provides moderate discrimination capabilities but may struggle with distinguishing between
similar materials.
3. Optical: Offers limited discrimination compared to hyperspectral and multispectral sensors due to fewer
Difference
7
Hyperspectral vs Multispectral vs Optical Remote Sensing:
4.Applications:
Hyperspectral: Ideal for applications requiring detailed spectral analysis, such as mineral exploration,
environmental monitoring, and precision agriculture.
Multispectral: Suited for applications where moderate spectral resolution is sufficient, such as land cover
classification, vegetation monitoring, and urban mapping.
Optical: Commonly used for general imaging purposes, including satellite imaging, surveillance, and
photography.
5.Data Processing:
Hyperspectral: Requires complex data processing and analysis techniques to extract meaningful information
from the large amount of spectral data.
Multispectral: Generally easier to process than hyperspectral data but still requires spectral analysis
techniques.
Optical: Typically easier to process than hyperspectral and multispectral data due to simpler spectral
characteristics.
6.Cost and Availability:
Hyperspectral: Generally more expensive and less common than multispectral and optical sensors.
Multispectral: More affordable and widely available compared to hyperspectral sensors.
Working Principle
8
Hyperspectral imagers are pushbroom sensors that continuously collect spectrograms that
form a three-dimensional (3D) data cube, composed of cross-track (x), along-track (y), and
spectrum (λ) dimensions, as shown in Figure.
Hyperspectral imagery contains hundreds to thousands of spectral bands. At each pixel, a
continuous spectral profile can be obtained, which enables discrimination among land-cover
classes that are spectrally similar.
Source:
https://www.researchgate.net/publication/253205974_Preprocessing_of_hyperspectral_imagery_with_consideration_of_smile_and_keystone_properties
https://www.nv5geospatialsoftware.com/Learn/Blogs/Blog-Details/ArtMID/10198/ArticleID/16262/Push-Broom-and-Whisk-Broom-Sensors
HYPERSPECTRAL SENSORS
A hyperspectral sensor is a device capable of capturing and analyzing a wide range of electromagnetic
wavelengths, providing detailed spectral information for each pixel in an image.
DIFFERENT TYPES OF HYPERSPECTRAL SENSORS:
1. Ground-Based Hyperspectral Sensors: These sensors are portable instruments used for collecting
spectral data from the ground level. They are typically handheld or tripod-mounted and are employed for
applications such as agriculture, environmental monitoring, and geological surveys.
2. Airborne Hyperspectral Sensors:
-Airborne hyperspectral sensors are mounted on aircraft or drones and are used to collect high-resolution
spectral data over large areas. They offer greater spatial coverage compared to ground-based sensors and
are utilized for applications such as land cover mapping, mineral exploration, and precision agriculture.
3. Spaceborne Hyperspectral Sensors:
Spaceborne hyperspectral sensors are deployed on satellites orbiting the Earth. They provide global
coverage and are used for monitoring large-scale environmental changes, mapping land cover and land use,
and studying the Earth's surface and atmosphere. Spaceborne sensors play a crucial role in various fields
including agriculture, forestry, urban planning, and climate monitoring.
Hyperspectral Sensors
9
GROUND-BASED HYPERSPECTRAL SENSORS:
Field Spectrometers: These are portable instruments used for collecting high-resolution spectral data in the
field. They provide detailed information about the spectral properties of objects or surfaces. Field
spectrometers are commonly used in agriculture, environmental monitoring, and geological surveys.
ASD Field Spec Hand Held series: These handheld spectroradiometers are widely used for applications
such as vegetation analysis, soil characterization, and mineral identification. They offer high spectral
resolution and flexibility for field measurements.
GER Field Spec line : GER instruments are known for their ruggedness and reliability, making them
suitable for various outdoor applications including agriculture, forestry, and geology. They provide accurate
spectral measurements across a wide range of wavelengths
Hyperspectral Sensors
10
2.AIRBORNE HYPERSPECTRAL SENSORS:
-AVIRIS (Airborne Visible/Infrared Imaging Spectrometer): AVIRIS is one of the most well-known airborne
hyperspectral sensors. It is mounted on aircraft and captures high-resolution spectral images of the Earth's
surface. AVIRIS data are used for diverse applications such as mineral exploration, vegetation mapping, and
environmental monitoring. It provides detailed spectral information across hundreds of narrow spectral bands.
CASI (Compact Airborne Spectrographic Imager):CASI is a compact hyperspectral sensor designed for
airborne remote sensing applications. It offers high spatial and spectral resolution imagery, making it suitable
for tasks such as land cover mapping, coastal zone monitoring, and urban planning. CASI data are widely used
in environmental research and resource management.
HySpex:HySpex sensors are commonly used in airborne hyperspectral imaging missions. They offer high
spectral resolution and sensitivity across the visible, near-infrared, and shortwave infrared regions of the
electromagnetic spectrum. HySpex data are utilized for applications including geological mapping, agriculture,
and forestry management.
Hyperspectral Sensors
11
3. SPACEBORNE HYPERSPECTRAL SENSORS:
Hyperion:Hyperion is an imaging spectrometer onboard NASA's Earth Observing-1 (EO-1) satellite. It captures
hyperspectral data with high spectral resolution across the visible, near-infrared, and shortwave infrared regions.
Hyperion data are used for various Earth science applications including land cover classification, mineral
exploration, and environmental monitoring.
EnMAP (Environmental Mapping and Analysis Program): EnMAP is a German hyperspectral satellite mission
designed for environmental monitoring. It provides high-quality spectral data covering the visible to shortwave
infrared regions. EnMAP data are used for tasks such as land cover mapping, vegetation analysis, and habitat
monitoring.
PRISMA (PRecursore IperSpettrale della Missione Applicativa):PRISMA is an Italian hyperspectral satellite
mission equipped with a hyperspectral sensor capable of capturing data across the visible and near-infrared regions.
It offers high spectral resolution imagery for applications such as urban planning, agriculture, and environmental
monitoring.
Hyperspectral Sensors
12
1.Imaging Spectrometers: These sensors take pictures with a complete spectrum of data contained in each pixel. Based
on their design, imaging spectrometers can be further divided into different varieties, including whiskbroom,
pushbroom, and snapshot.
2. Spectrometers with prisms: Using a prism, prism-based spectrometers divide incoming light into its component
wavelengths. These are frequently utilised for spectroscopic examination in scientific environments.
3. Grating Spectrometers: Light is divided into its spectrum components by diffraction gratings in grating
spectrometers. Because of their effectiveness and adaptability, they are frequently utilised in a variety of hyperspectral
applications.
4. Fabry-Perot Interferometers: These instruments are made up of two partially reflecting mirrors that are separated
from one another. They choose particular light wavelengths for investigation by taking advantage of interference
patterns.
5. Acousto-optic Tunable Filters (AOTFs): AOTFs produce a diffraction grating inside an optical medium by using
sound waves. They are frequently utilised in space-based and aircraft-based hyperspectral imaging systems because of
their quick spectral scanning capabilities.
Hyperspectral Sensors
13
6. Liquid Crystal Tunable Filters (LCTFs): LCTFs selectively transmit certain light wavelengths while
blocking others through the use of liquid crystal technology. They are used in situations when spectral
band tuning must happen quickly.
7. Linear Variable Filters (LVFs): LVFs are made up of a substrate that has a thin film put on it that
varies in thickness, allowing the film to transmit various light wavelengths at various points along its
length. Compact hyperspectral imaging systems frequently use them.
8.Hyperspectral sensors can be employed with Whispering Gallery Mode Resonators (WGMRs):which
are microscale optical resonators. For spectroscopic examination, they can be incorporated into lab-on-
a-chip systems and have a high sensitivity.
These are a few popular varieties of hyperspectral sensors, each having special applications and
working principles. A number of criteria, including spectrum range, spectral resolution, spatial
resolution, sensitivity, and cost, influence the choice of sensor.
Hyperspectral Sensors
14
Hyperspectral Sensor
PRISMA and Hyperion sensor hyperspectral data are often accessible through dedicated data repositories or Earth
observation data management organisations. The following are some typical places to look for hyperspectral data:
1. European Space Agency (ESA): https://www.earthdata.nasa.gov/ - With assistance from ESA, the Italian Space Agency
(ASI) is launching the PRISMA mission. Consequently, one possible location to start would be ESA's Earth Observation
Data User Element (EO-Data Uptake) program
2.NASA:https://www.earthdata.nasa.gov/ - NASA is in charge of the Earth Observing-1 (EO-1) spacecraft, which is
equipped with the hyperspectral imager Hyperion. Through a number of portals, including the Earth Observing System
Data and Information System (EOSDIS), NASA makes a vast array of Earth observation data accessible.
3. United States Geological Survey (USGS), https://earthexplorer.usgs.gov/ - Hyperspectral data is hosted by the United
States Geological Survey (USGS), which also hosts other Earth observation data. It is possible to obtain hyperion data
using the USGS Earth Explorer website.
4.European Space Research Institute (ESRIN): https://www.esa.int/About_Us/ESRIN - Since PRISMA is an Italian
mission that collaborates with ESA, PRISMA data may potentially be available via the ESA-established European Space
Research Institute. And one more website is ASI (Agenzia Spaziale Italiana)https://www.asi.it/:
GROUND BASED SENSORS
SPACEBRONE SENSOR
Hyperspectral Sensors
16
Applications of hyperspectral analysis
17
Hyperspectral analysis has a wide range of applications across various fields due to its ability to capture
detailed spectral information across a broad range of wavelengths.
1.Remote Sensing and Earth Observation
Hyperspectral analysis is extensively used in remote sensing applications to monitor the Earth's surface,
atmosphere, and oceans. It enables the identification and characterization of land cover, vegetation types,
soil composition, and geological features.
2. Agriculture and Crop Monitoring
In agriculture, hyperspectral analysis helps in assessing crop health, detecting diseases, monitoring nutrient
levels, optimizing irrigation, and predicting yield. It enables farmers to make informed decisions about
planting, fertilization, and pest control.
3. Environmental Monitoring and Pollution Detection
Hyperspectral imaging is used to monitor environmental changes, assess water quality, detect pollutants,
and track changes in ecosystems. It enables the identification and mapping of environmental hazards such
as oil spills, algal blooms, and deforestation.
4. Mineral Exploration and Geology
In the field of geology and mineral exploration, hyperspectral analysis is used to identify and map mineral
deposits, geological formations, and alteration zones. It helps geologists and mining companies to prospect
for valuable resources and plan exploration activities more efficiently.
Applications of hyperspectral analysis
18
5. Forestry and Land Management
Hyperspectral analysis aids in forest management, biodiversity assessment, and habitat monitoring. It
enables the identification of tree species, forest health assessment, mapping of invasive species, and
monitoring of deforestation and land degradation.
6. Urban Planning and Infrastructure Monitoring
In urban areas, hyperspectral analysis is used for urban planning, land use classification, and infrastructure
monitoring. It helps city planners to assess urban sprawl, monitor changes in built-up areas, and identify
potential infrastructure risks such as landslides and subsidence.
7. Medical Imaging and Healthcare
In the field of medical imaging, hyperspectral analysis is used for disease diagnosis, tissue characterization,
and surgical guidance. It enables the detection of abnormalities, differentiation of healthy and diseased
tissues, and assessment of treatment response in areas such as dermatology, ophthalmology, and oncology
8. Food Quality and Safety
Hyperspectral analysis is employed in food processing and quality control to assess the freshness, ripeness,
and nutritional content of agricultural products. It helps in detecting contaminants, foreign objects, and
spoilage in food products, ensuring food safety and compliance with regulatory standards.
Research papers
19
ID TITLE AUTHOR YEAR DATA USED
1 Remote Sensing of Lake Sediment Core
Particle Size Using Hyperspectral Image
Analysis
Hamid Ghanbari et.al 2020 scanner system equipped with two hyperspectral
cameras (Specim Ltd., Oulu, Finland) working in
the SWIR and VNIR wavelengths of the
electromagnetic spectrum
2 Hyperspectral Imaging Analysis for the
Early Detection of Tomato Bacterial Leaf
Spot Disease
Xuemei Zhang et.al 2023 Hyperspectral images of the detached leaves were
collected using a RESONON benchtop system with
Pika L (visible & near infrared: 400-1000 nm) and
Pika NIR320 (shortwave infrared: 900-1700 nm)
cameras
3 Hyperspectral Imaging in Environmental
Monitoring: A Review of Recent
Developments and Technological Advances
in Compact Field Deployable Systems
Mary B.Stuart et.al 2019 data collected using Imaging Spectrometers such
as Push Broom sensor and Whiskbroom sensor
4 Application of hyperspectral remote
sensing for supplementary investigation of
polymetallic deposits in Huaniushan ore
region, northwestern China
Yu-qing Wan et.al 2021 CASI/SASI airborne hyperspectral images are the
primary data
Research papers
20
ID TITLE AUTHOR YEAR DATA USED
5 Monitoring Forest Health Using
Hyperspectral Imagery: Does Feature
Selection Improve the Performance of
Machine-Learning Techniques?
Patrick Schratz et.al 2021 The airborne hyperspectral data were acquired by an AISA
EAGLE-II sensor during two flight campaigns
6 Human settlement and infrastructure
monitoring with hyperspectral imaging
Andrea Marinoni
et.al
2019 Hyperion sensor onboard the NASA Earth Observing-1
(EO-1) satellite
7 A Non-destructive Methodology for
Determining Chemical Composition of
Salvia miltiorrhiza via Hyperspectral
Imaging Analysis and Squeeze-and-
Excitation Residual Networks
Jieqiang Zhu et.al 2023 The imaging process employed a Lambda-Nir
hyperspectral camera (Wuxi Spectrum Vision Technology
Co., Wuxi, China), capturing at intervals of precisely 5.38
nm within the visible and near-infrared spectrum, ranging
from 380 nm to 1064 nm. This spanned a total of 128
distinct bands and operated at a spectral resolution of 10
nm
8 Hyperspectral imaging technique for
evaluating food quality and safety during
various processes: A review of recent
applications
Yuwei Liu et.al 2017 Hyperspectral cameras operating in the VNIR and NIR
range
Sources
21
1. Hamid Ghanbari et.al; Remote Sensing of Lake Sediment Core Particle Size Using Hyperspectral Image Analysis;2020
https://www.researchgate.net/publication/346410537_Remote_Sensing_of_Lake_Sediment_Core_Particle_Size_Using_Hyperspectral_Image
2. Xuemei Zhang et.al; Hyperspectral Imaging Analysis for the Early Detection of Tomato Bacterial Leaf Spot Disease;2023
https://www.researchgate.net/publication/376848576_Hyperspectral_Imaging_Analysis_for_the_Early_Detection_of_Tomato_Bacterial_Leaf
_Spot_Disease
3. Mary B.Stuart et.al; Hyperspectral Imaging in Environmental Monitoring: A Review of Recent Developments and Technological Advances in
Compact Field Deployable Systems;2019
https://www.ncbi.nlm.nih.gov/pmc/articles/PMC6678368/
4. Yu-qing Wan et.al; Application of hyperspectral remote sensing for supplementary investigation of polymetallic deposits in Huaniushan ore
region, northwestern China;2021
https://www.nature.com/articles/s41598-020-79864-0
5. Patrick Schratz et.al; Monitoring Forest Health Using Hyperspectral Imagery: Does Feature Selection Improve the Performance of Machine-
Learning Techniques?;2021
https://www.mdpi.com/2072-4292/13/23/4832
6. Andrea Marinoni et.al; Human settlement and infrastructure monitoring with hyperspectral imaging;2019
https://www.researchgate.net/publication/335351541_Human_settlement_and_infrastructure_monitoring_with_hyperspectral_imaging
7. Jieqiang Zhu et.al; A Non-destructive Methodology for Determining Chemical Composition of Salvia miltiorrhiza via Hyperspectral Imaging
Analysis and Squeeze-and-Excitation Residual Networks;2023
https://www.mdpi.com/1424-8220/23/23/9345
8. Yuwei Liu et.al; Hyperspectral imaging technique for evaluating food quality and safety during various processes: A review of recent
applications;2017
https://www.sciencedirect.com/science/article/pii/S0924224416305052
Hyperspectral & Remote Sensing on Remote Sensing and GIS.pptx

More Related Content

Similar to Hyperspectral & Remote Sensing on Remote Sensing and GIS.pptx

Remote sensing and application by Nikhil Pakwanne
Remote sensing and application by Nikhil PakwanneRemote sensing and application by Nikhil Pakwanne
Remote sensing and application by Nikhil Pakwanne
NIKHIL PAKWANNE
 
rsgis-unitii-160731062950.pdf
rsgis-unitii-160731062950.pdfrsgis-unitii-160731062950.pdf
rsgis-unitii-160731062950.pdf
BSuresh26
 
上海必和 Advancements in hyperspectral and multi-spectral ima超光谱高光谱多光谱
上海必和 Advancements in hyperspectral and multi-spectral ima超光谱高光谱多光谱上海必和 Advancements in hyperspectral and multi-spectral ima超光谱高光谱多光谱
上海必和 Advancements in hyperspectral and multi-spectral ima超光谱高光谱多光谱
algous
 
35001320006_Saraswati Mahato_Remote sensing and gis_ca 1_2024_even.pdf
35001320006_Saraswati Mahato_Remote sensing and gis_ca 1_2024_even.pdf35001320006_Saraswati Mahato_Remote sensing and gis_ca 1_2024_even.pdf
35001320006_Saraswati Mahato_Remote sensing and gis_ca 1_2024_even.pdf
barunmahato3
 

Similar to Hyperspectral & Remote Sensing on Remote Sensing and GIS.pptx (20)

rs&gis-theena.pptx
rs&gis-theena.pptxrs&gis-theena.pptx
rs&gis-theena.pptx
 
Remote sensing
Remote sensingRemote sensing
Remote sensing
 
Remote Sensing - A tool of plant disease management
Remote Sensing - A tool of plant disease managementRemote Sensing - A tool of plant disease management
Remote Sensing - A tool of plant disease management
 
Remote Sensing: Meaning, Concept and Components | Geography
Remote Sensing: Meaning, Concept and Components | GeographyRemote Sensing: Meaning, Concept and Components | Geography
Remote Sensing: Meaning, Concept and Components | Geography
 
sources of imges
sources of imgessources of imges
sources of imges
 
DSP FINALs
DSP FINALsDSP FINALs
DSP FINALs
 
Report
ReportReport
Report
 
Remote sensing and application by Nikhil Pakwanne
Remote sensing and application by Nikhil PakwanneRemote sensing and application by Nikhil Pakwanne
Remote sensing and application by Nikhil Pakwanne
 
Hyperspectral Imaging
Hyperspectral ImagingHyperspectral Imaging
Hyperspectral Imaging
 
Remote sensing
Remote sensingRemote sensing
Remote sensing
 
REMOTE SENSING AND GEOGRAPHIC INFORMATION SYSTEMS
REMOTE SENSING AND GEOGRAPHIC INFORMATION SYSTEMS REMOTE SENSING AND GEOGRAPHIC INFORMATION SYSTEMS
REMOTE SENSING AND GEOGRAPHIC INFORMATION SYSTEMS
 
rsgis-unitii-160731062950.pdf
rsgis-unitii-160731062950.pdfrsgis-unitii-160731062950.pdf
rsgis-unitii-160731062950.pdf
 
Introduction to Remote Sensing
Introduction to Remote SensingIntroduction to Remote Sensing
Introduction to Remote Sensing
 
remote sensing
remote sensingremote sensing
remote sensing
 
上海必和 Advancements in hyperspectral and multi-spectral ima超光谱高光谱多光谱
上海必和 Advancements in hyperspectral and multi-spectral ima超光谱高光谱多光谱上海必和 Advancements in hyperspectral and multi-spectral ima超光谱高光谱多光谱
上海必和 Advancements in hyperspectral and multi-spectral ima超光谱高光谱多光谱
 
remote sensing ppt.pptx
remote sensing ppt.pptxremote sensing ppt.pptx
remote sensing ppt.pptx
 
Estimating cellphone signal intensity & identifying
Estimating cellphone signal intensity & identifyingEstimating cellphone signal intensity & identifying
Estimating cellphone signal intensity & identifying
 
Remote sensing-presentaion
Remote sensing-presentaionRemote sensing-presentaion
Remote sensing-presentaion
 
35001320006_Saraswati Mahato_Remote sensing and gis_ca 1_2024_even.pdf
35001320006_Saraswati Mahato_Remote sensing and gis_ca 1_2024_even.pdf35001320006_Saraswati Mahato_Remote sensing and gis_ca 1_2024_even.pdf
35001320006_Saraswati Mahato_Remote sensing and gis_ca 1_2024_even.pdf
 
Sensors and Systems
Sensors and SystemsSensors and Systems
Sensors and Systems
 

Recently uploaded

Finding Java's Hidden Performance Traps @ DevoxxUK 2024
Finding Java's Hidden Performance Traps @ DevoxxUK 2024Finding Java's Hidden Performance Traps @ DevoxxUK 2024
Finding Java's Hidden Performance Traps @ DevoxxUK 2024
Victor Rentea
 
+971581248768>> SAFE AND ORIGINAL ABORTION PILLS FOR SALE IN DUBAI AND ABUDHA...
+971581248768>> SAFE AND ORIGINAL ABORTION PILLS FOR SALE IN DUBAI AND ABUDHA...+971581248768>> SAFE AND ORIGINAL ABORTION PILLS FOR SALE IN DUBAI AND ABUDHA...
+971581248768>> SAFE AND ORIGINAL ABORTION PILLS FOR SALE IN DUBAI AND ABUDHA...
?#DUbAI#??##{{(☎️+971_581248768%)**%*]'#abortion pills for sale in dubai@
 
Cloud Frontiers: A Deep Dive into Serverless Spatial Data and FME
Cloud Frontiers:  A Deep Dive into Serverless Spatial Data and FMECloud Frontiers:  A Deep Dive into Serverless Spatial Data and FME
Cloud Frontiers: A Deep Dive into Serverless Spatial Data and FME
Safe Software
 
Why Teams call analytics are critical to your entire business
Why Teams call analytics are critical to your entire businessWhy Teams call analytics are critical to your entire business
Why Teams call analytics are critical to your entire business
panagenda
 

Recently uploaded (20)

JohnPollard-hybrid-app-RailsConf2024.pptx
JohnPollard-hybrid-app-RailsConf2024.pptxJohnPollard-hybrid-app-RailsConf2024.pptx
JohnPollard-hybrid-app-RailsConf2024.pptx
 
Six Myths about Ontologies: The Basics of Formal Ontology
Six Myths about Ontologies: The Basics of Formal OntologySix Myths about Ontologies: The Basics of Formal Ontology
Six Myths about Ontologies: The Basics of Formal Ontology
 
Finding Java's Hidden Performance Traps @ DevoxxUK 2024
Finding Java's Hidden Performance Traps @ DevoxxUK 2024Finding Java's Hidden Performance Traps @ DevoxxUK 2024
Finding Java's Hidden Performance Traps @ DevoxxUK 2024
 
Exploring Multimodal Embeddings with Milvus
Exploring Multimodal Embeddings with MilvusExploring Multimodal Embeddings with Milvus
Exploring Multimodal Embeddings with Milvus
 
Navigating the Deluge_ Dubai Floods and the Resilience of Dubai International...
Navigating the Deluge_ Dubai Floods and the Resilience of Dubai International...Navigating the Deluge_ Dubai Floods and the Resilience of Dubai International...
Navigating the Deluge_ Dubai Floods and the Resilience of Dubai International...
 
EMPOWERMENT TECHNOLOGY GRADE 11 QUARTER 2 REVIEWER
EMPOWERMENT TECHNOLOGY GRADE 11 QUARTER 2 REVIEWEREMPOWERMENT TECHNOLOGY GRADE 11 QUARTER 2 REVIEWER
EMPOWERMENT TECHNOLOGY GRADE 11 QUARTER 2 REVIEWER
 
+971581248768>> SAFE AND ORIGINAL ABORTION PILLS FOR SALE IN DUBAI AND ABUDHA...
+971581248768>> SAFE AND ORIGINAL ABORTION PILLS FOR SALE IN DUBAI AND ABUDHA...+971581248768>> SAFE AND ORIGINAL ABORTION PILLS FOR SALE IN DUBAI AND ABUDHA...
+971581248768>> SAFE AND ORIGINAL ABORTION PILLS FOR SALE IN DUBAI AND ABUDHA...
 
Corporate and higher education May webinar.pptx
Corporate and higher education May webinar.pptxCorporate and higher education May webinar.pptx
Corporate and higher education May webinar.pptx
 
AWS Community Day CPH - Three problems of Terraform
AWS Community Day CPH - Three problems of TerraformAWS Community Day CPH - Three problems of Terraform
AWS Community Day CPH - Three problems of Terraform
 
Cloud Frontiers: A Deep Dive into Serverless Spatial Data and FME
Cloud Frontiers:  A Deep Dive into Serverless Spatial Data and FMECloud Frontiers:  A Deep Dive into Serverless Spatial Data and FME
Cloud Frontiers: A Deep Dive into Serverless Spatial Data and FME
 
Understanding the FAA Part 107 License ..
Understanding the FAA Part 107 License ..Understanding the FAA Part 107 License ..
Understanding the FAA Part 107 License ..
 
"I see eyes in my soup": How Delivery Hero implemented the safety system for ...
"I see eyes in my soup": How Delivery Hero implemented the safety system for ..."I see eyes in my soup": How Delivery Hero implemented the safety system for ...
"I see eyes in my soup": How Delivery Hero implemented the safety system for ...
 
Polkadot JAM Slides - Token2049 - By Dr. Gavin Wood
Polkadot JAM Slides - Token2049 - By Dr. Gavin WoodPolkadot JAM Slides - Token2049 - By Dr. Gavin Wood
Polkadot JAM Slides - Token2049 - By Dr. Gavin Wood
 
TrustArc Webinar - Unlock the Power of AI-Driven Data Discovery
TrustArc Webinar - Unlock the Power of AI-Driven Data DiscoveryTrustArc Webinar - Unlock the Power of AI-Driven Data Discovery
TrustArc Webinar - Unlock the Power of AI-Driven Data Discovery
 
Connector Corner: Accelerate revenue generation using UiPath API-centric busi...
Connector Corner: Accelerate revenue generation using UiPath API-centric busi...Connector Corner: Accelerate revenue generation using UiPath API-centric busi...
Connector Corner: Accelerate revenue generation using UiPath API-centric busi...
 
Apidays New York 2024 - The Good, the Bad and the Governed by David O'Neill, ...
Apidays New York 2024 - The Good, the Bad and the Governed by David O'Neill, ...Apidays New York 2024 - The Good, the Bad and the Governed by David O'Neill, ...
Apidays New York 2024 - The Good, the Bad and the Governed by David O'Neill, ...
 
Apidays New York 2024 - Passkeys: Developing APIs to enable passwordless auth...
Apidays New York 2024 - Passkeys: Developing APIs to enable passwordless auth...Apidays New York 2024 - Passkeys: Developing APIs to enable passwordless auth...
Apidays New York 2024 - Passkeys: Developing APIs to enable passwordless auth...
 
Why Teams call analytics are critical to your entire business
Why Teams call analytics are critical to your entire businessWhy Teams call analytics are critical to your entire business
Why Teams call analytics are critical to your entire business
 
AI+A11Y 11MAY2024 HYDERBAD GAAD 2024 - HelloA11Y (11 May 2024)
AI+A11Y 11MAY2024 HYDERBAD GAAD 2024 - HelloA11Y (11 May 2024)AI+A11Y 11MAY2024 HYDERBAD GAAD 2024 - HelloA11Y (11 May 2024)
AI+A11Y 11MAY2024 HYDERBAD GAAD 2024 - HelloA11Y (11 May 2024)
 
Spring Boot vs Quarkus the ultimate battle - DevoxxUK
Spring Boot vs Quarkus the ultimate battle - DevoxxUKSpring Boot vs Quarkus the ultimate battle - DevoxxUK
Spring Boot vs Quarkus the ultimate battle - DevoxxUK
 

Hyperspectral & Remote Sensing on Remote Sensing and GIS.pptx

  • 1. A presentation on Hyperspectral Analysis Remote sensing & Geographical Information Systems Department of Civil Engineering National Institute of Technology, Warangal 2024-2025 Presented by - Nilotpal Lahkar (23CEM5R09) Navya Bharathi (23CEM5R11) Sai Bharathi (23CEM5R12) Vamshi Palaparthi (23CEM5R10)
  • 2. Contents 2 Introduction Working principle Hyperspectral sensors Applications of Hyperspectral analysis Research Papers and references
  • 3. Introduction 3 What is Hyperspectral Analysis? Hyperspectral analysis is a sophisticated technique used to extract meaningful information from hyperspectral data, which comprises images captured across numerous narrow and contiguous spectral bands. This form of analysis is crucial for interpreting the rich spectral information provided by hyperspectral imaging and this can be applied in various fields for research purposes.
  • 4. Working Principle 4 What is Hyperspectral Imaging? Hyperspectral imaging (HSI) is an advanced technique that combines imaging and spectroscopy to capture information from across the electromagnetic spectrum. Unlike traditional imaging techniques that capture only three bands of data (red, green, and blue), hyperspectral imaging divides the spectrum into hundreds or even thousands of narrow, contiguous bands. In hyperspectral imaging, each pixel in the image is represented by a spectrum, which is a complete set of intensity values across all spectral bands. After the image is acquired, a data cube (hypercube) consisting of spatial and spectral information appears.
  • 5. Advantages 5 Advantages of Hyperspectral Imaging:  Enhanced Spectral Resolution: Captures detailed spectral information for precise material identification. (e.g.- AVIRIS with 224 spectral bands provides 4 m and Hyperion and CHRIS Proba have 15–30 m spatial resolutions)  Improved Material Discrimination: Enables better differentiation between materials, aiding in various fields, by capturing a much larger number of spectral bands across the electromagnetic spectrum. This detailed spectral information allows for better differentiation between materials based on their unique spectral signatures.  Detection of Subtle Changes: Can detect slight changes in material properties over time, by acquiring hyperspectral images of the same area at different times, subtle changes in material properties can be detected by comparing the spectral signatures of the same pixels over time. For example, changes in vegetation health, soil moisture content, or surface minerals can be monitored over time.  Target Identification and Analysis: Allows for specific target detection and analysis based on spectral signatures.  Quantitative Analysis: Hyperspectral remote sensing provides quantitative analysis by utilizing spectral data to estimate various material properties, such as mass and volume. Here's how it works: Volume Estimation: Hyperspectral imaging can also be used to estimate the volume of materials, such as forests or crops. By combining spectral information with spatial data, such as height or density, it is possible to estimate the volume of three-dimensional objects. source- https://www.sciencedirect.com/topics/earth-and-planetary-sciences/hyperspectral-imaging
  • 6. Difference 6 Hyperspectral vs Multispectral vs Optical Remote Sensing: 1.Spectral Resolution: 1. Hyperspectral: Provides very high spectral resolution, with numerous narrow and contiguous bands. 2. Multispectral: Offers moderate spectral resolution, with fewer bands than hyperspectral sensors. 3. Optical: Generally refers to visible and near-infrared bands, with lower spectral resolution compared to hyperspectral and multispectral sensors. 2.Bandwidth and Coverage: 1. Hyperspectral: Covers a wide range of wavelengths with narrow bands, providing detailed spectral information. 2. Multispectral: Covers broader wavelength ranges but with fewer bands compared to hyperspectral sensors. 3. Optical: Typically covers the visible and near-infrared spectrum, offering limited spectral information compared to hyperspectral and some multispectral sensors. 3.Feature Discrimination: 1. Hyperspectral: Enables detailed discrimination between different materials or features based on their spectral signatures. 2. Multispectral: Provides moderate discrimination capabilities but may struggle with distinguishing between similar materials. 3. Optical: Offers limited discrimination compared to hyperspectral and multispectral sensors due to fewer
  • 7. Difference 7 Hyperspectral vs Multispectral vs Optical Remote Sensing: 4.Applications: Hyperspectral: Ideal for applications requiring detailed spectral analysis, such as mineral exploration, environmental monitoring, and precision agriculture. Multispectral: Suited for applications where moderate spectral resolution is sufficient, such as land cover classification, vegetation monitoring, and urban mapping. Optical: Commonly used for general imaging purposes, including satellite imaging, surveillance, and photography. 5.Data Processing: Hyperspectral: Requires complex data processing and analysis techniques to extract meaningful information from the large amount of spectral data. Multispectral: Generally easier to process than hyperspectral data but still requires spectral analysis techniques. Optical: Typically easier to process than hyperspectral and multispectral data due to simpler spectral characteristics. 6.Cost and Availability: Hyperspectral: Generally more expensive and less common than multispectral and optical sensors. Multispectral: More affordable and widely available compared to hyperspectral sensors.
  • 8. Working Principle 8 Hyperspectral imagers are pushbroom sensors that continuously collect spectrograms that form a three-dimensional (3D) data cube, composed of cross-track (x), along-track (y), and spectrum (λ) dimensions, as shown in Figure. Hyperspectral imagery contains hundreds to thousands of spectral bands. At each pixel, a continuous spectral profile can be obtained, which enables discrimination among land-cover classes that are spectrally similar. Source: https://www.researchgate.net/publication/253205974_Preprocessing_of_hyperspectral_imagery_with_consideration_of_smile_and_keystone_properties https://www.nv5geospatialsoftware.com/Learn/Blogs/Blog-Details/ArtMID/10198/ArticleID/16262/Push-Broom-and-Whisk-Broom-Sensors
  • 9. HYPERSPECTRAL SENSORS A hyperspectral sensor is a device capable of capturing and analyzing a wide range of electromagnetic wavelengths, providing detailed spectral information for each pixel in an image. DIFFERENT TYPES OF HYPERSPECTRAL SENSORS: 1. Ground-Based Hyperspectral Sensors: These sensors are portable instruments used for collecting spectral data from the ground level. They are typically handheld or tripod-mounted and are employed for applications such as agriculture, environmental monitoring, and geological surveys. 2. Airborne Hyperspectral Sensors: -Airborne hyperspectral sensors are mounted on aircraft or drones and are used to collect high-resolution spectral data over large areas. They offer greater spatial coverage compared to ground-based sensors and are utilized for applications such as land cover mapping, mineral exploration, and precision agriculture. 3. Spaceborne Hyperspectral Sensors: Spaceborne hyperspectral sensors are deployed on satellites orbiting the Earth. They provide global coverage and are used for monitoring large-scale environmental changes, mapping land cover and land use, and studying the Earth's surface and atmosphere. Spaceborne sensors play a crucial role in various fields including agriculture, forestry, urban planning, and climate monitoring. Hyperspectral Sensors 9
  • 10. GROUND-BASED HYPERSPECTRAL SENSORS: Field Spectrometers: These are portable instruments used for collecting high-resolution spectral data in the field. They provide detailed information about the spectral properties of objects or surfaces. Field spectrometers are commonly used in agriculture, environmental monitoring, and geological surveys. ASD Field Spec Hand Held series: These handheld spectroradiometers are widely used for applications such as vegetation analysis, soil characterization, and mineral identification. They offer high spectral resolution and flexibility for field measurements. GER Field Spec line : GER instruments are known for their ruggedness and reliability, making them suitable for various outdoor applications including agriculture, forestry, and geology. They provide accurate spectral measurements across a wide range of wavelengths Hyperspectral Sensors 10
  • 11. 2.AIRBORNE HYPERSPECTRAL SENSORS: -AVIRIS (Airborne Visible/Infrared Imaging Spectrometer): AVIRIS is one of the most well-known airborne hyperspectral sensors. It is mounted on aircraft and captures high-resolution spectral images of the Earth's surface. AVIRIS data are used for diverse applications such as mineral exploration, vegetation mapping, and environmental monitoring. It provides detailed spectral information across hundreds of narrow spectral bands. CASI (Compact Airborne Spectrographic Imager):CASI is a compact hyperspectral sensor designed for airborne remote sensing applications. It offers high spatial and spectral resolution imagery, making it suitable for tasks such as land cover mapping, coastal zone monitoring, and urban planning. CASI data are widely used in environmental research and resource management. HySpex:HySpex sensors are commonly used in airborne hyperspectral imaging missions. They offer high spectral resolution and sensitivity across the visible, near-infrared, and shortwave infrared regions of the electromagnetic spectrum. HySpex data are utilized for applications including geological mapping, agriculture, and forestry management. Hyperspectral Sensors 11
  • 12. 3. SPACEBORNE HYPERSPECTRAL SENSORS: Hyperion:Hyperion is an imaging spectrometer onboard NASA's Earth Observing-1 (EO-1) satellite. It captures hyperspectral data with high spectral resolution across the visible, near-infrared, and shortwave infrared regions. Hyperion data are used for various Earth science applications including land cover classification, mineral exploration, and environmental monitoring. EnMAP (Environmental Mapping and Analysis Program): EnMAP is a German hyperspectral satellite mission designed for environmental monitoring. It provides high-quality spectral data covering the visible to shortwave infrared regions. EnMAP data are used for tasks such as land cover mapping, vegetation analysis, and habitat monitoring. PRISMA (PRecursore IperSpettrale della Missione Applicativa):PRISMA is an Italian hyperspectral satellite mission equipped with a hyperspectral sensor capable of capturing data across the visible and near-infrared regions. It offers high spectral resolution imagery for applications such as urban planning, agriculture, and environmental monitoring. Hyperspectral Sensors 12
  • 13. 1.Imaging Spectrometers: These sensors take pictures with a complete spectrum of data contained in each pixel. Based on their design, imaging spectrometers can be further divided into different varieties, including whiskbroom, pushbroom, and snapshot. 2. Spectrometers with prisms: Using a prism, prism-based spectrometers divide incoming light into its component wavelengths. These are frequently utilised for spectroscopic examination in scientific environments. 3. Grating Spectrometers: Light is divided into its spectrum components by diffraction gratings in grating spectrometers. Because of their effectiveness and adaptability, they are frequently utilised in a variety of hyperspectral applications. 4. Fabry-Perot Interferometers: These instruments are made up of two partially reflecting mirrors that are separated from one another. They choose particular light wavelengths for investigation by taking advantage of interference patterns. 5. Acousto-optic Tunable Filters (AOTFs): AOTFs produce a diffraction grating inside an optical medium by using sound waves. They are frequently utilised in space-based and aircraft-based hyperspectral imaging systems because of their quick spectral scanning capabilities. Hyperspectral Sensors 13
  • 14. 6. Liquid Crystal Tunable Filters (LCTFs): LCTFs selectively transmit certain light wavelengths while blocking others through the use of liquid crystal technology. They are used in situations when spectral band tuning must happen quickly. 7. Linear Variable Filters (LVFs): LVFs are made up of a substrate that has a thin film put on it that varies in thickness, allowing the film to transmit various light wavelengths at various points along its length. Compact hyperspectral imaging systems frequently use them. 8.Hyperspectral sensors can be employed with Whispering Gallery Mode Resonators (WGMRs):which are microscale optical resonators. For spectroscopic examination, they can be incorporated into lab-on- a-chip systems and have a high sensitivity. These are a few popular varieties of hyperspectral sensors, each having special applications and working principles. A number of criteria, including spectrum range, spectral resolution, spatial resolution, sensitivity, and cost, influence the choice of sensor. Hyperspectral Sensors 14
  • 15. Hyperspectral Sensor PRISMA and Hyperion sensor hyperspectral data are often accessible through dedicated data repositories or Earth observation data management organisations. The following are some typical places to look for hyperspectral data: 1. European Space Agency (ESA): https://www.earthdata.nasa.gov/ - With assistance from ESA, the Italian Space Agency (ASI) is launching the PRISMA mission. Consequently, one possible location to start would be ESA's Earth Observation Data User Element (EO-Data Uptake) program 2.NASA:https://www.earthdata.nasa.gov/ - NASA is in charge of the Earth Observing-1 (EO-1) spacecraft, which is equipped with the hyperspectral imager Hyperion. Through a number of portals, including the Earth Observing System Data and Information System (EOSDIS), NASA makes a vast array of Earth observation data accessible. 3. United States Geological Survey (USGS), https://earthexplorer.usgs.gov/ - Hyperspectral data is hosted by the United States Geological Survey (USGS), which also hosts other Earth observation data. It is possible to obtain hyperion data using the USGS Earth Explorer website. 4.European Space Research Institute (ESRIN): https://www.esa.int/About_Us/ESRIN - Since PRISMA is an Italian mission that collaborates with ESA, PRISMA data may potentially be available via the ESA-established European Space Research Institute. And one more website is ASI (Agenzia Spaziale Italiana)https://www.asi.it/:
  • 16. GROUND BASED SENSORS SPACEBRONE SENSOR Hyperspectral Sensors 16
  • 17. Applications of hyperspectral analysis 17 Hyperspectral analysis has a wide range of applications across various fields due to its ability to capture detailed spectral information across a broad range of wavelengths. 1.Remote Sensing and Earth Observation Hyperspectral analysis is extensively used in remote sensing applications to monitor the Earth's surface, atmosphere, and oceans. It enables the identification and characterization of land cover, vegetation types, soil composition, and geological features. 2. Agriculture and Crop Monitoring In agriculture, hyperspectral analysis helps in assessing crop health, detecting diseases, monitoring nutrient levels, optimizing irrigation, and predicting yield. It enables farmers to make informed decisions about planting, fertilization, and pest control. 3. Environmental Monitoring and Pollution Detection Hyperspectral imaging is used to monitor environmental changes, assess water quality, detect pollutants, and track changes in ecosystems. It enables the identification and mapping of environmental hazards such as oil spills, algal blooms, and deforestation. 4. Mineral Exploration and Geology In the field of geology and mineral exploration, hyperspectral analysis is used to identify and map mineral deposits, geological formations, and alteration zones. It helps geologists and mining companies to prospect for valuable resources and plan exploration activities more efficiently.
  • 18. Applications of hyperspectral analysis 18 5. Forestry and Land Management Hyperspectral analysis aids in forest management, biodiversity assessment, and habitat monitoring. It enables the identification of tree species, forest health assessment, mapping of invasive species, and monitoring of deforestation and land degradation. 6. Urban Planning and Infrastructure Monitoring In urban areas, hyperspectral analysis is used for urban planning, land use classification, and infrastructure monitoring. It helps city planners to assess urban sprawl, monitor changes in built-up areas, and identify potential infrastructure risks such as landslides and subsidence. 7. Medical Imaging and Healthcare In the field of medical imaging, hyperspectral analysis is used for disease diagnosis, tissue characterization, and surgical guidance. It enables the detection of abnormalities, differentiation of healthy and diseased tissues, and assessment of treatment response in areas such as dermatology, ophthalmology, and oncology 8. Food Quality and Safety Hyperspectral analysis is employed in food processing and quality control to assess the freshness, ripeness, and nutritional content of agricultural products. It helps in detecting contaminants, foreign objects, and spoilage in food products, ensuring food safety and compliance with regulatory standards.
  • 19. Research papers 19 ID TITLE AUTHOR YEAR DATA USED 1 Remote Sensing of Lake Sediment Core Particle Size Using Hyperspectral Image Analysis Hamid Ghanbari et.al 2020 scanner system equipped with two hyperspectral cameras (Specim Ltd., Oulu, Finland) working in the SWIR and VNIR wavelengths of the electromagnetic spectrum 2 Hyperspectral Imaging Analysis for the Early Detection of Tomato Bacterial Leaf Spot Disease Xuemei Zhang et.al 2023 Hyperspectral images of the detached leaves were collected using a RESONON benchtop system with Pika L (visible & near infrared: 400-1000 nm) and Pika NIR320 (shortwave infrared: 900-1700 nm) cameras 3 Hyperspectral Imaging in Environmental Monitoring: A Review of Recent Developments and Technological Advances in Compact Field Deployable Systems Mary B.Stuart et.al 2019 data collected using Imaging Spectrometers such as Push Broom sensor and Whiskbroom sensor 4 Application of hyperspectral remote sensing for supplementary investigation of polymetallic deposits in Huaniushan ore region, northwestern China Yu-qing Wan et.al 2021 CASI/SASI airborne hyperspectral images are the primary data
  • 20. Research papers 20 ID TITLE AUTHOR YEAR DATA USED 5 Monitoring Forest Health Using Hyperspectral Imagery: Does Feature Selection Improve the Performance of Machine-Learning Techniques? Patrick Schratz et.al 2021 The airborne hyperspectral data were acquired by an AISA EAGLE-II sensor during two flight campaigns 6 Human settlement and infrastructure monitoring with hyperspectral imaging Andrea Marinoni et.al 2019 Hyperion sensor onboard the NASA Earth Observing-1 (EO-1) satellite 7 A Non-destructive Methodology for Determining Chemical Composition of Salvia miltiorrhiza via Hyperspectral Imaging Analysis and Squeeze-and- Excitation Residual Networks Jieqiang Zhu et.al 2023 The imaging process employed a Lambda-Nir hyperspectral camera (Wuxi Spectrum Vision Technology Co., Wuxi, China), capturing at intervals of precisely 5.38 nm within the visible and near-infrared spectrum, ranging from 380 nm to 1064 nm. This spanned a total of 128 distinct bands and operated at a spectral resolution of 10 nm 8 Hyperspectral imaging technique for evaluating food quality and safety during various processes: A review of recent applications Yuwei Liu et.al 2017 Hyperspectral cameras operating in the VNIR and NIR range
  • 21. Sources 21 1. Hamid Ghanbari et.al; Remote Sensing of Lake Sediment Core Particle Size Using Hyperspectral Image Analysis;2020 https://www.researchgate.net/publication/346410537_Remote_Sensing_of_Lake_Sediment_Core_Particle_Size_Using_Hyperspectral_Image 2. Xuemei Zhang et.al; Hyperspectral Imaging Analysis for the Early Detection of Tomato Bacterial Leaf Spot Disease;2023 https://www.researchgate.net/publication/376848576_Hyperspectral_Imaging_Analysis_for_the_Early_Detection_of_Tomato_Bacterial_Leaf _Spot_Disease 3. Mary B.Stuart et.al; Hyperspectral Imaging in Environmental Monitoring: A Review of Recent Developments and Technological Advances in Compact Field Deployable Systems;2019 https://www.ncbi.nlm.nih.gov/pmc/articles/PMC6678368/ 4. Yu-qing Wan et.al; Application of hyperspectral remote sensing for supplementary investigation of polymetallic deposits in Huaniushan ore region, northwestern China;2021 https://www.nature.com/articles/s41598-020-79864-0 5. Patrick Schratz et.al; Monitoring Forest Health Using Hyperspectral Imagery: Does Feature Selection Improve the Performance of Machine- Learning Techniques?;2021 https://www.mdpi.com/2072-4292/13/23/4832 6. Andrea Marinoni et.al; Human settlement and infrastructure monitoring with hyperspectral imaging;2019 https://www.researchgate.net/publication/335351541_Human_settlement_and_infrastructure_monitoring_with_hyperspectral_imaging 7. Jieqiang Zhu et.al; A Non-destructive Methodology for Determining Chemical Composition of Salvia miltiorrhiza via Hyperspectral Imaging Analysis and Squeeze-and-Excitation Residual Networks;2023 https://www.mdpi.com/1424-8220/23/23/9345 8. Yuwei Liu et.al; Hyperspectral imaging technique for evaluating food quality and safety during various processes: A review of recent applications;2017 https://www.sciencedirect.com/science/article/pii/S0924224416305052