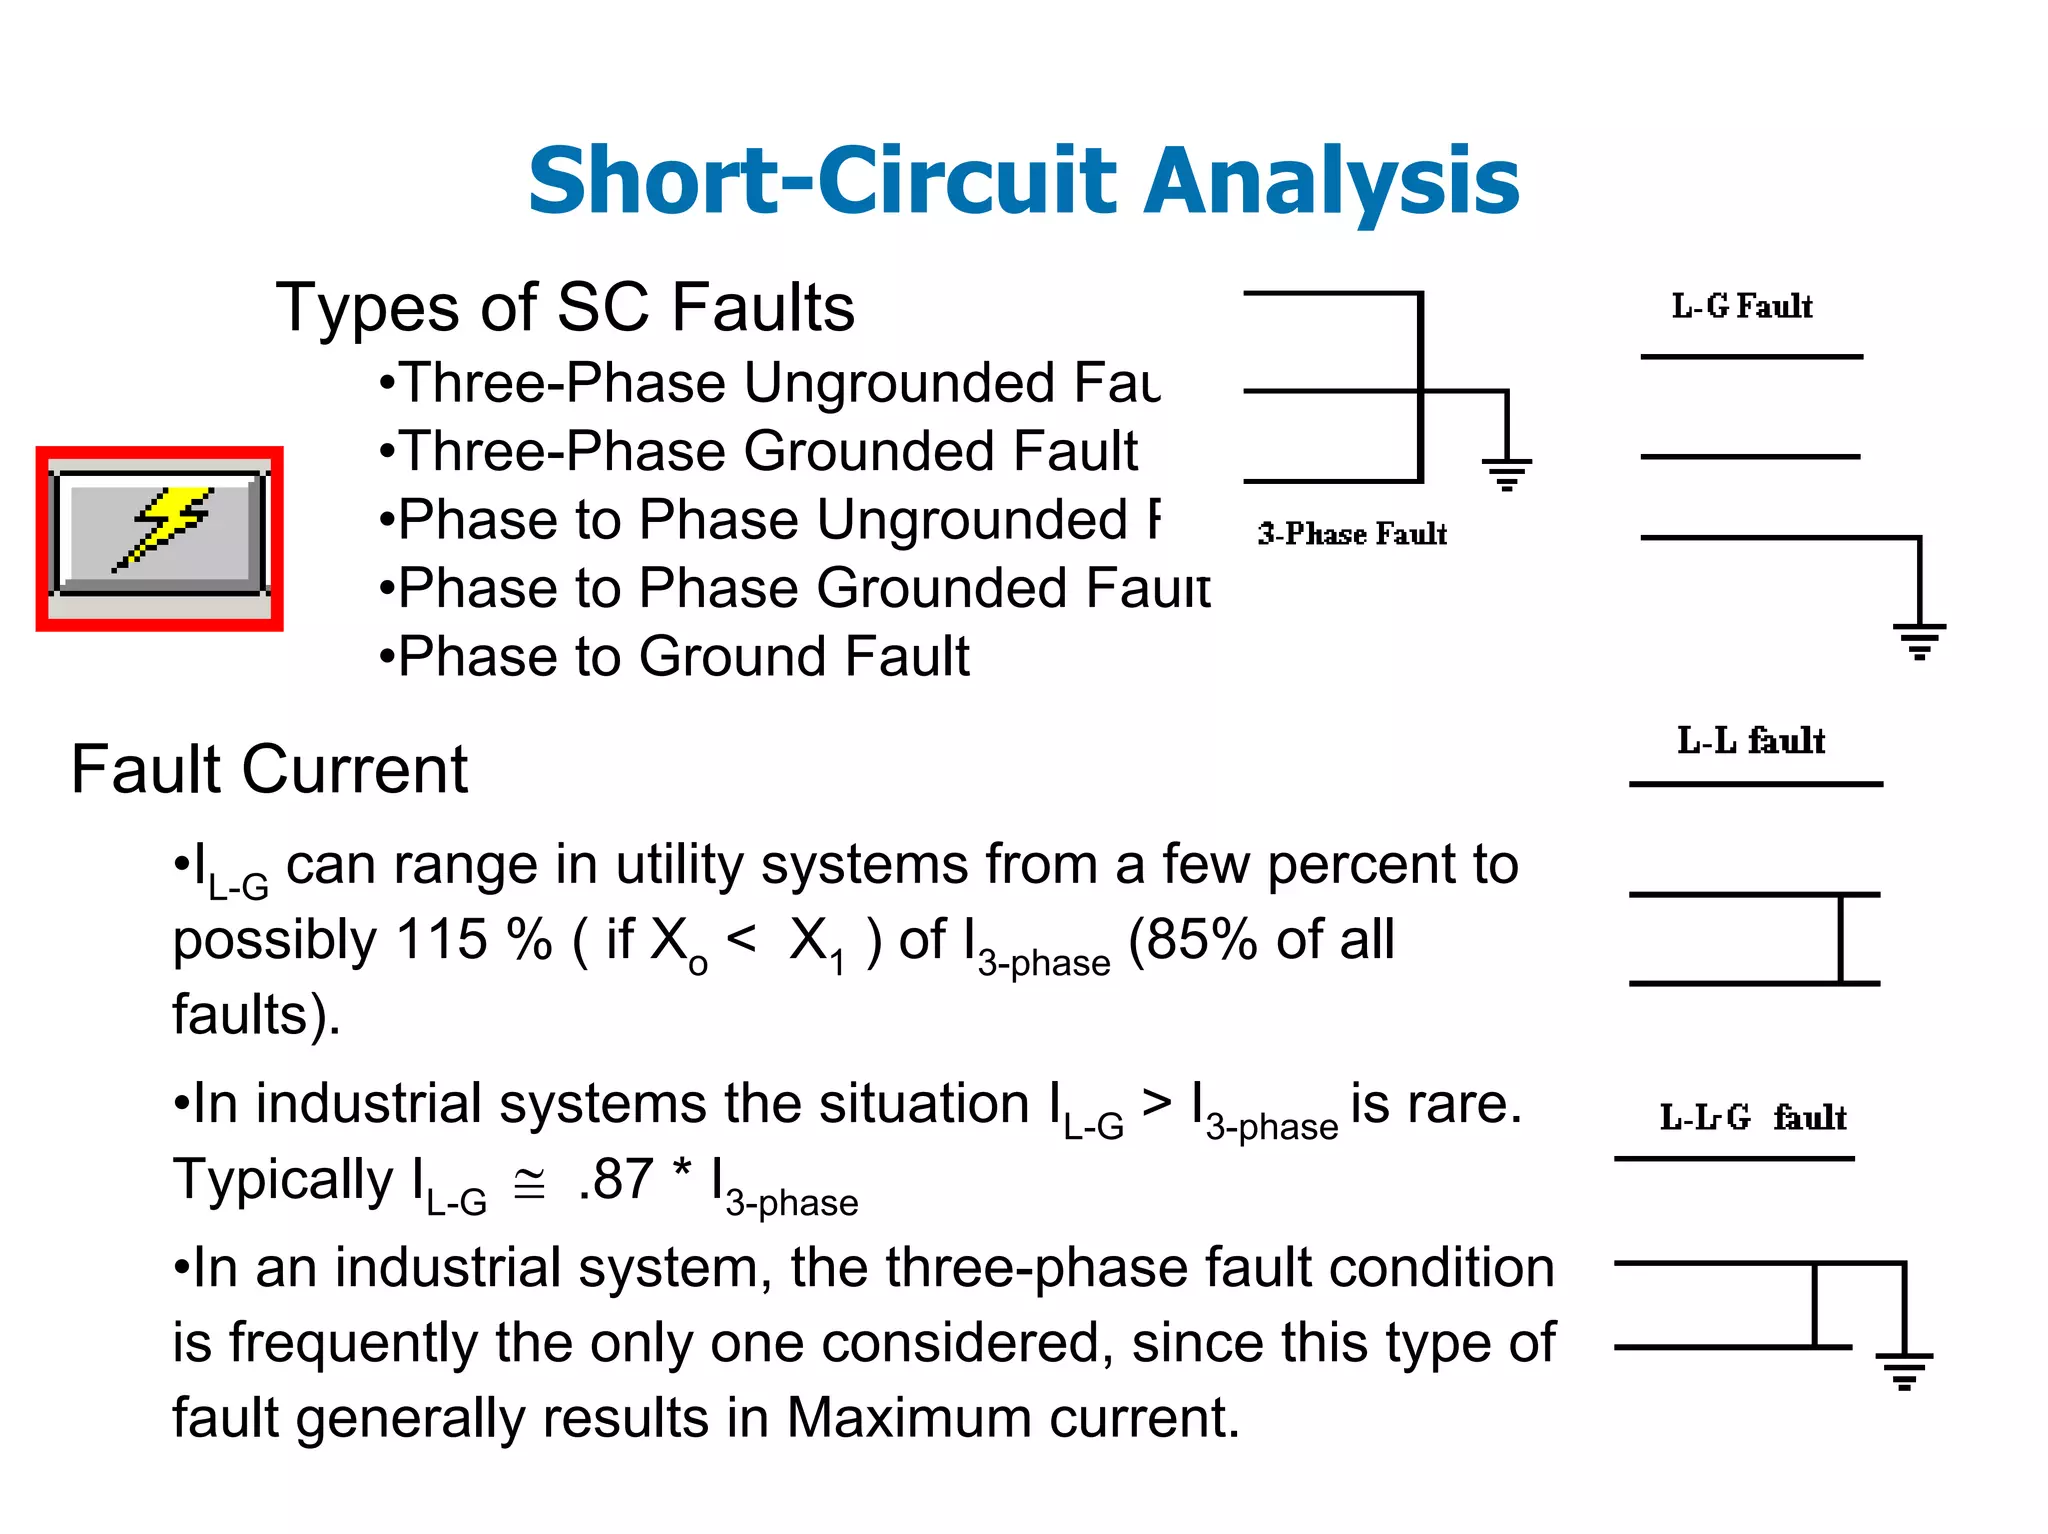
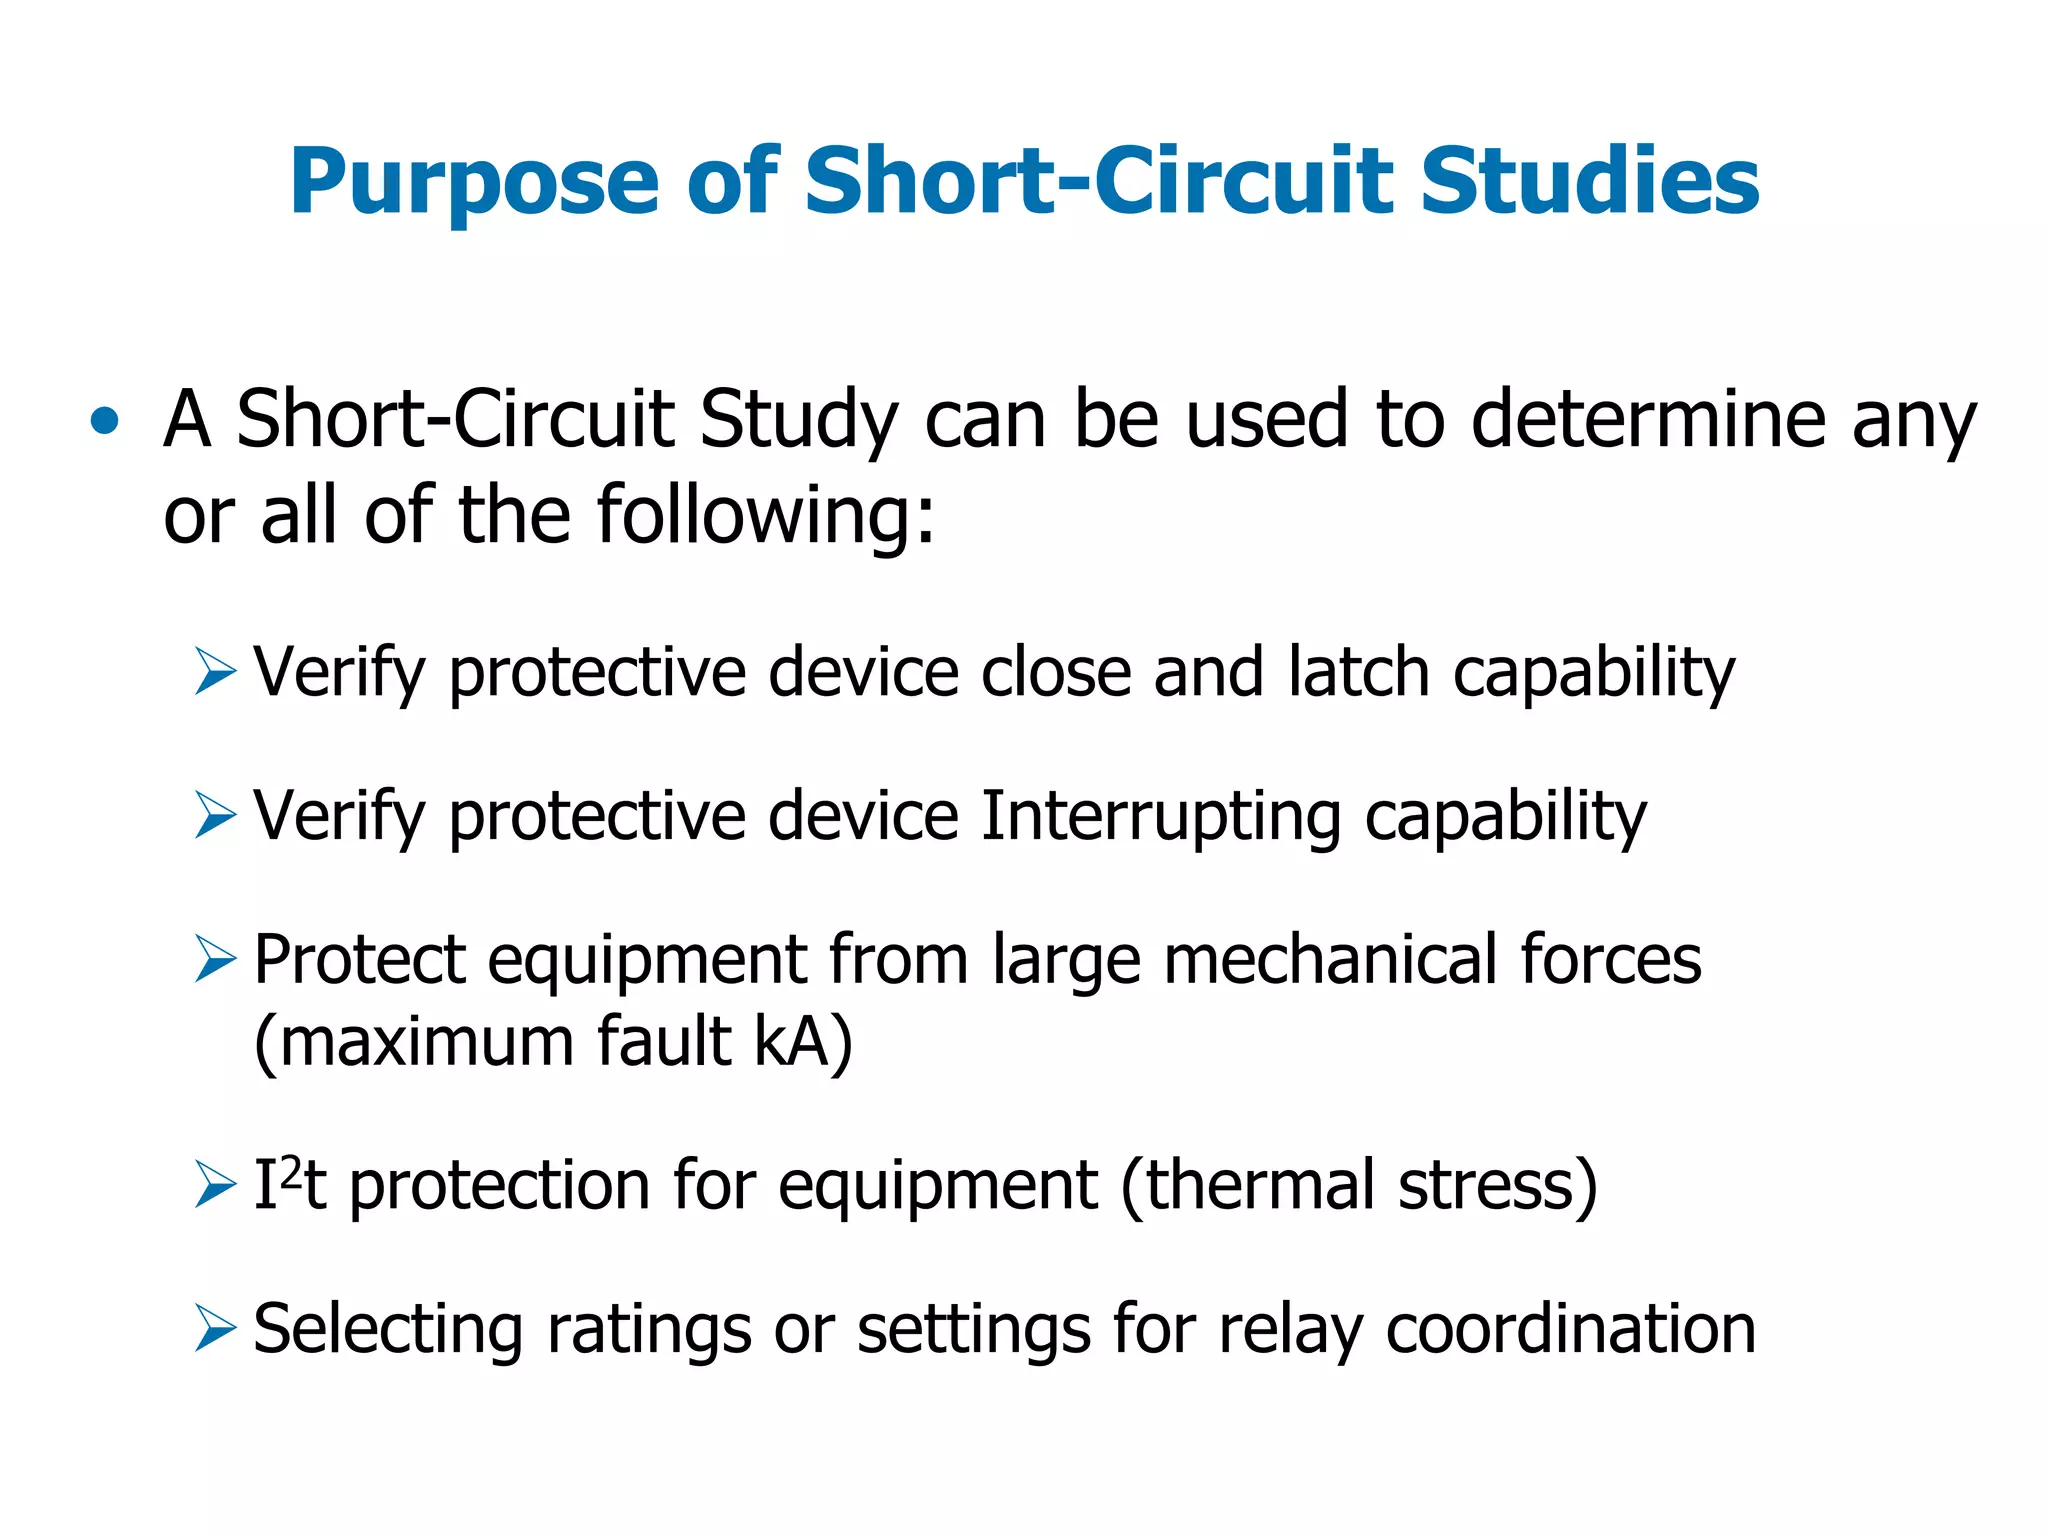
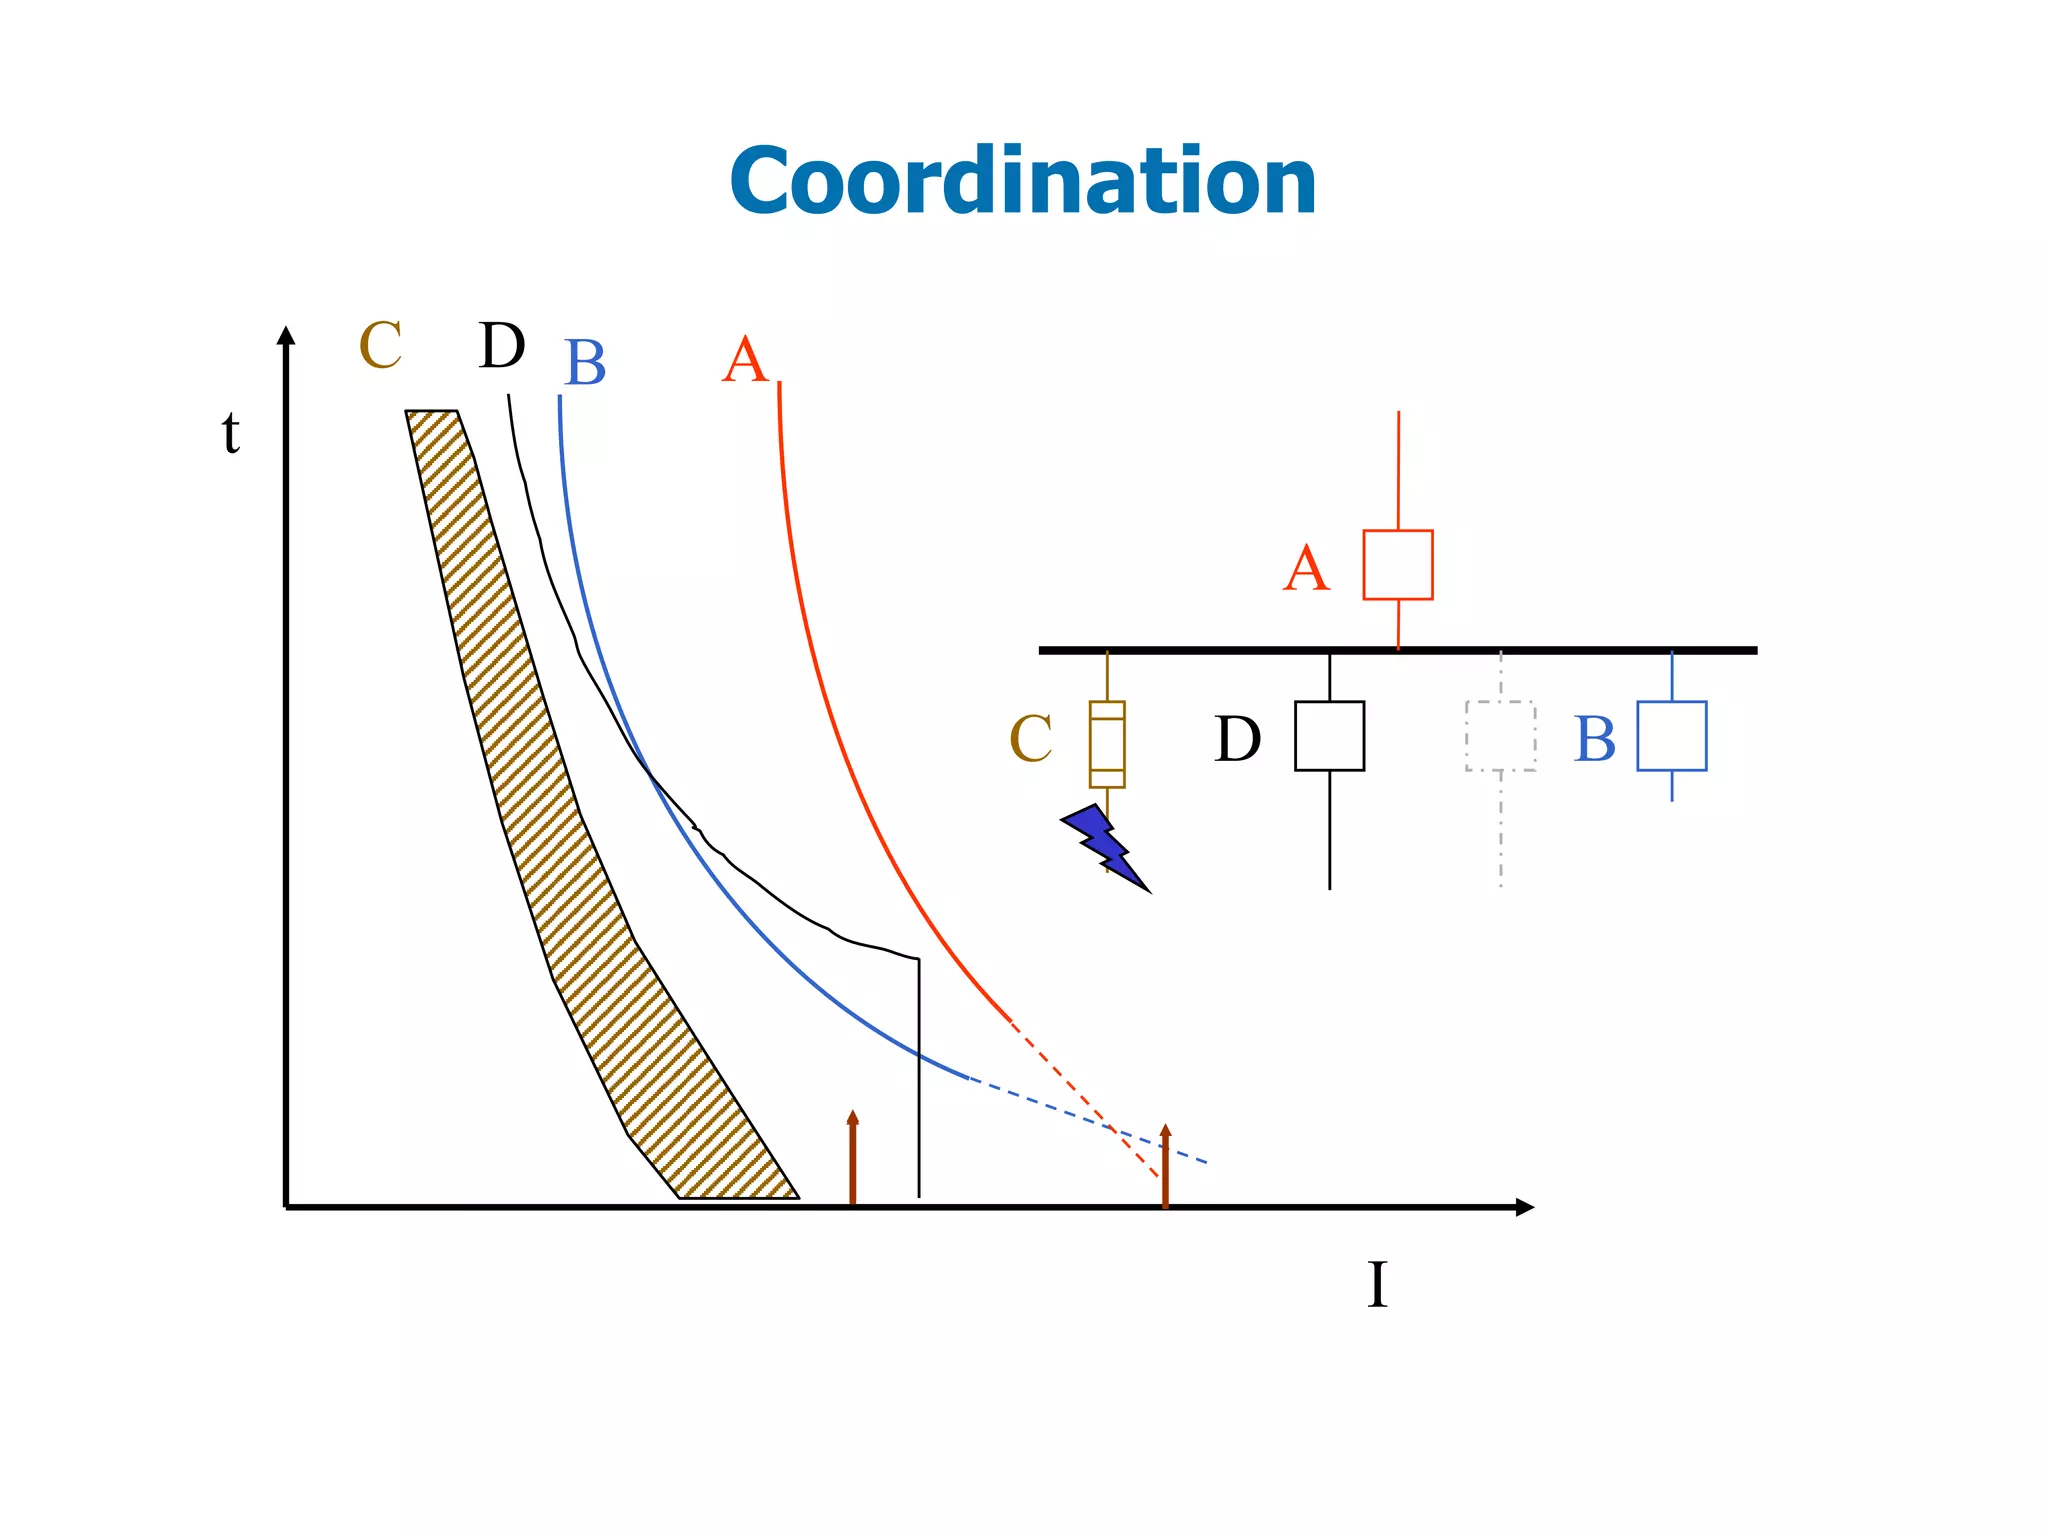
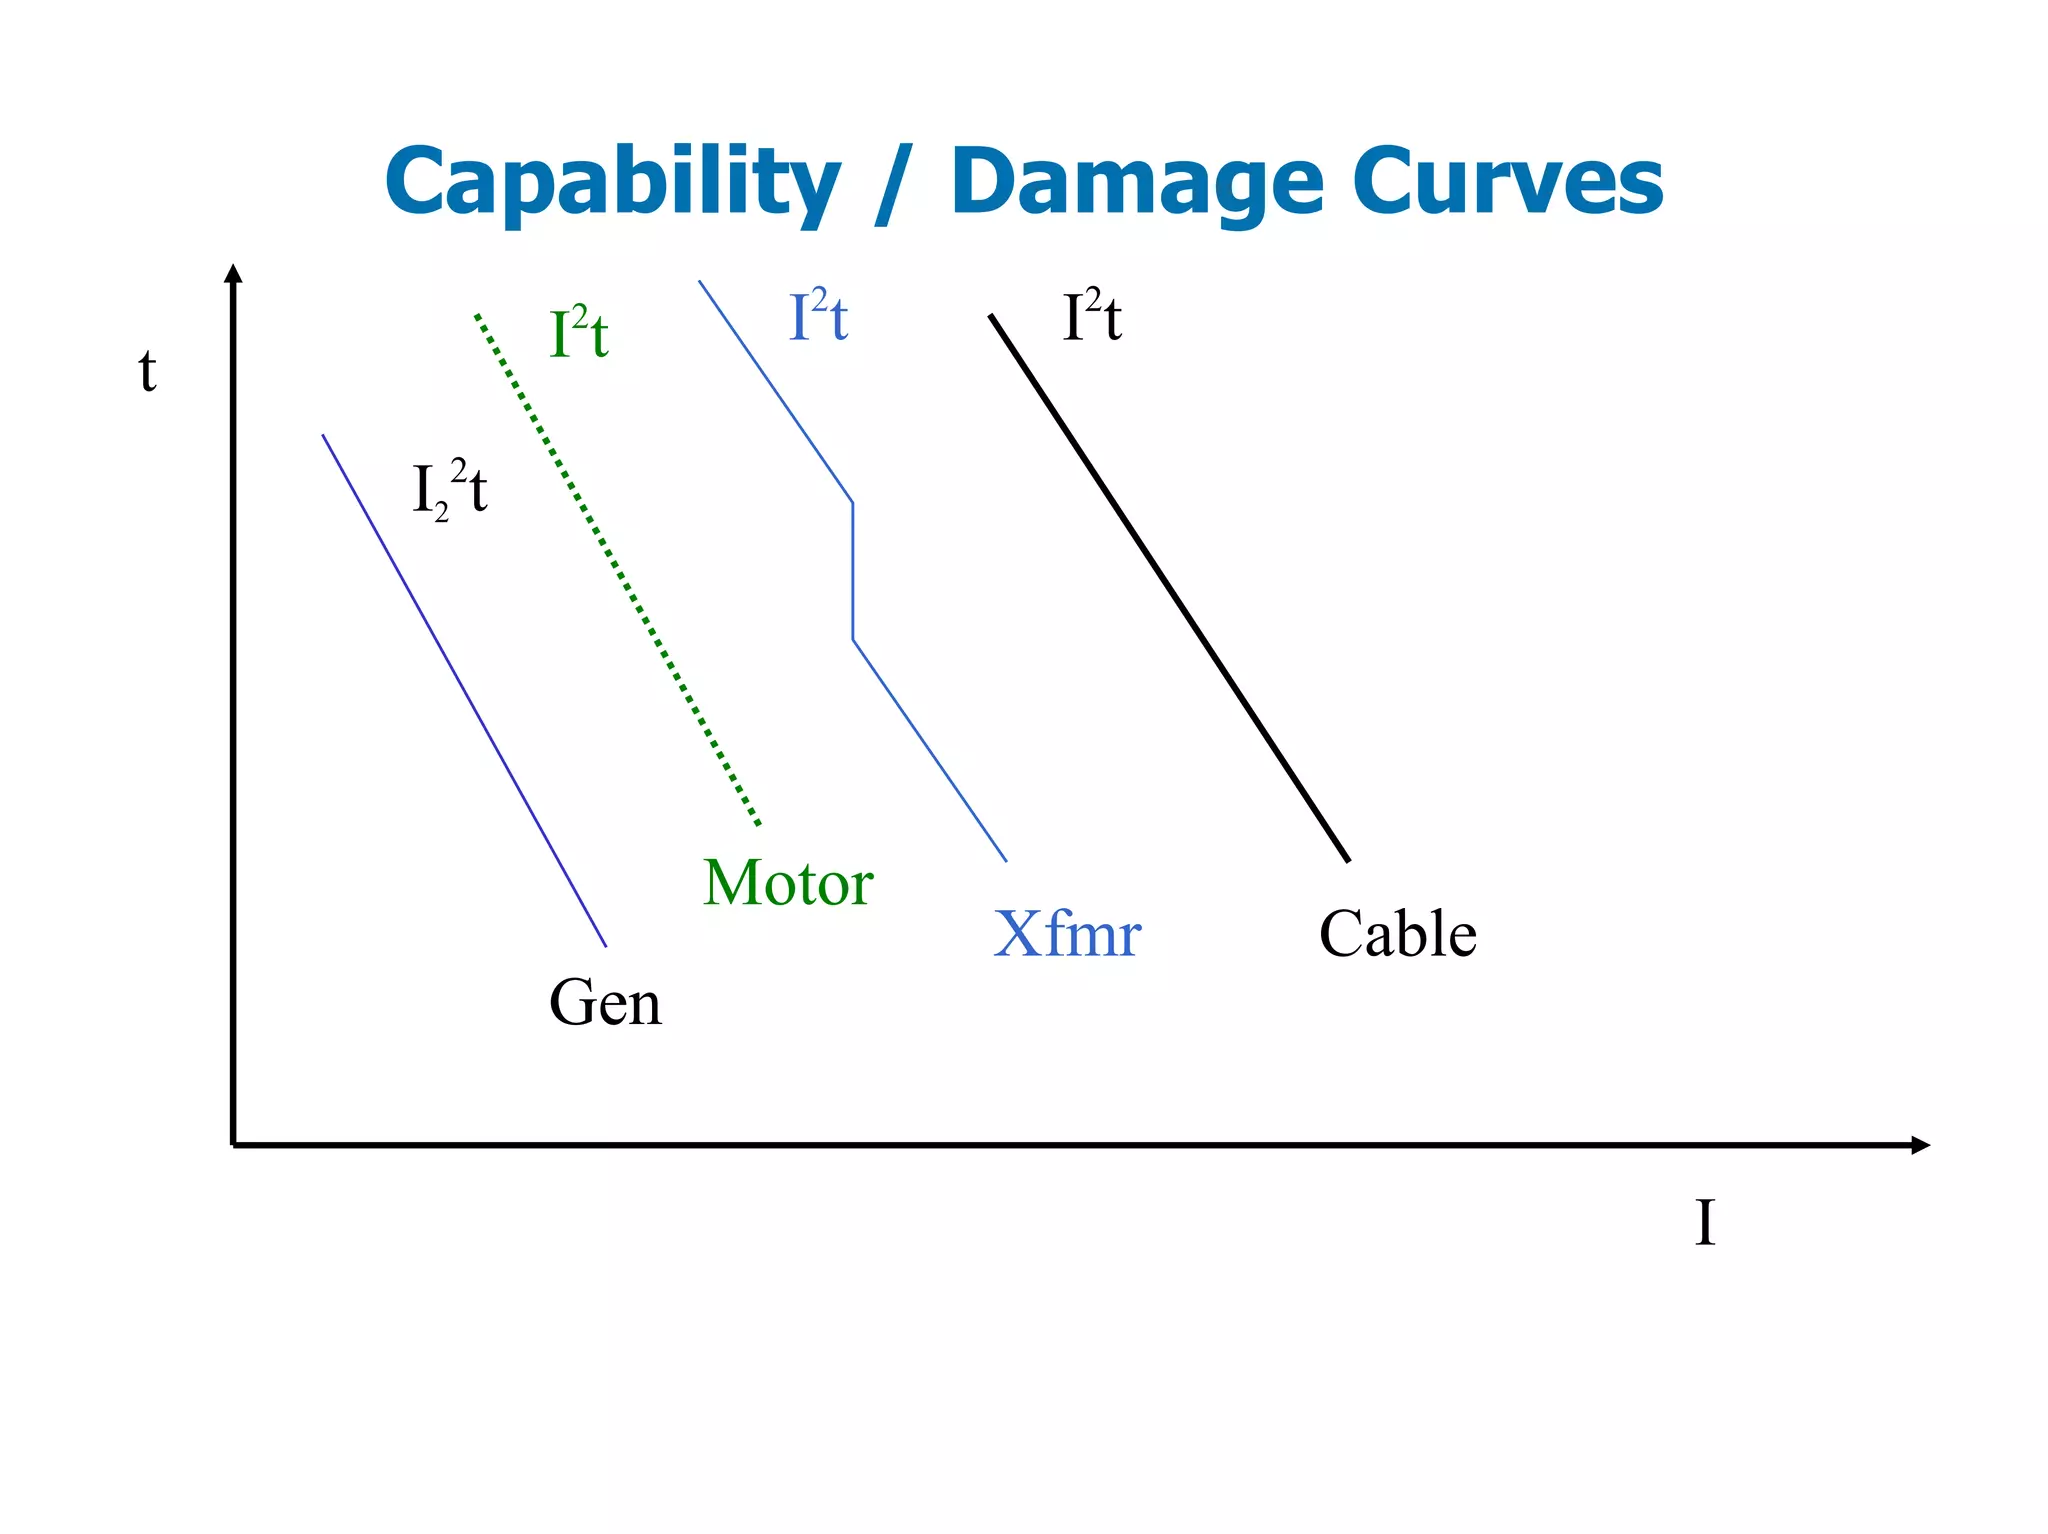
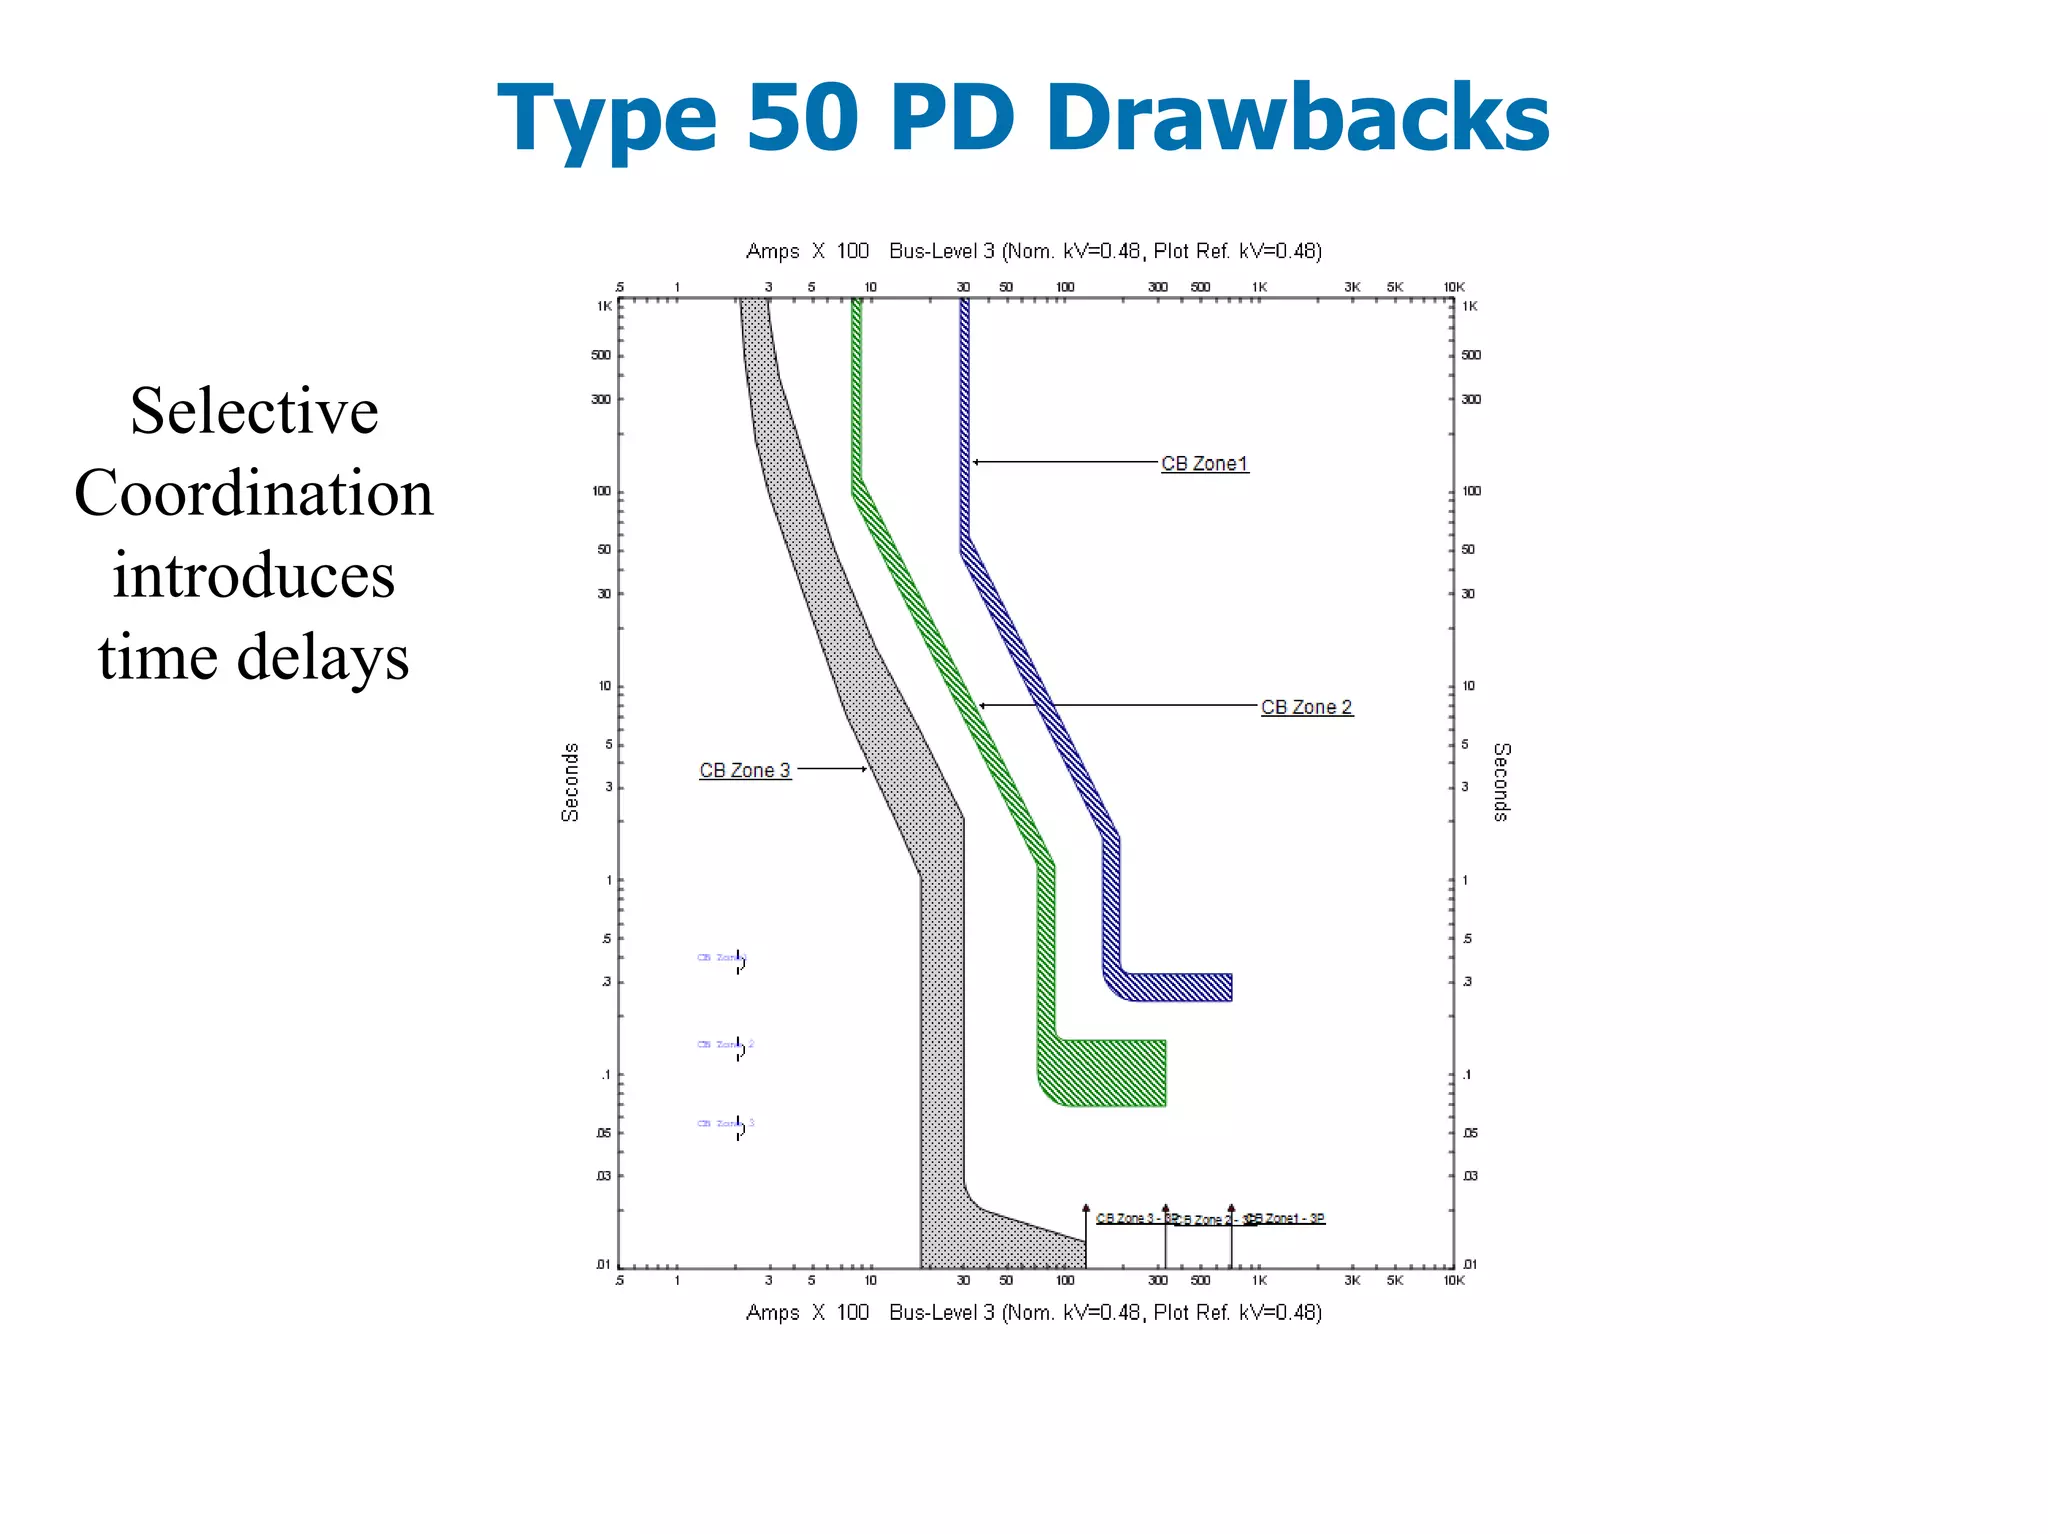
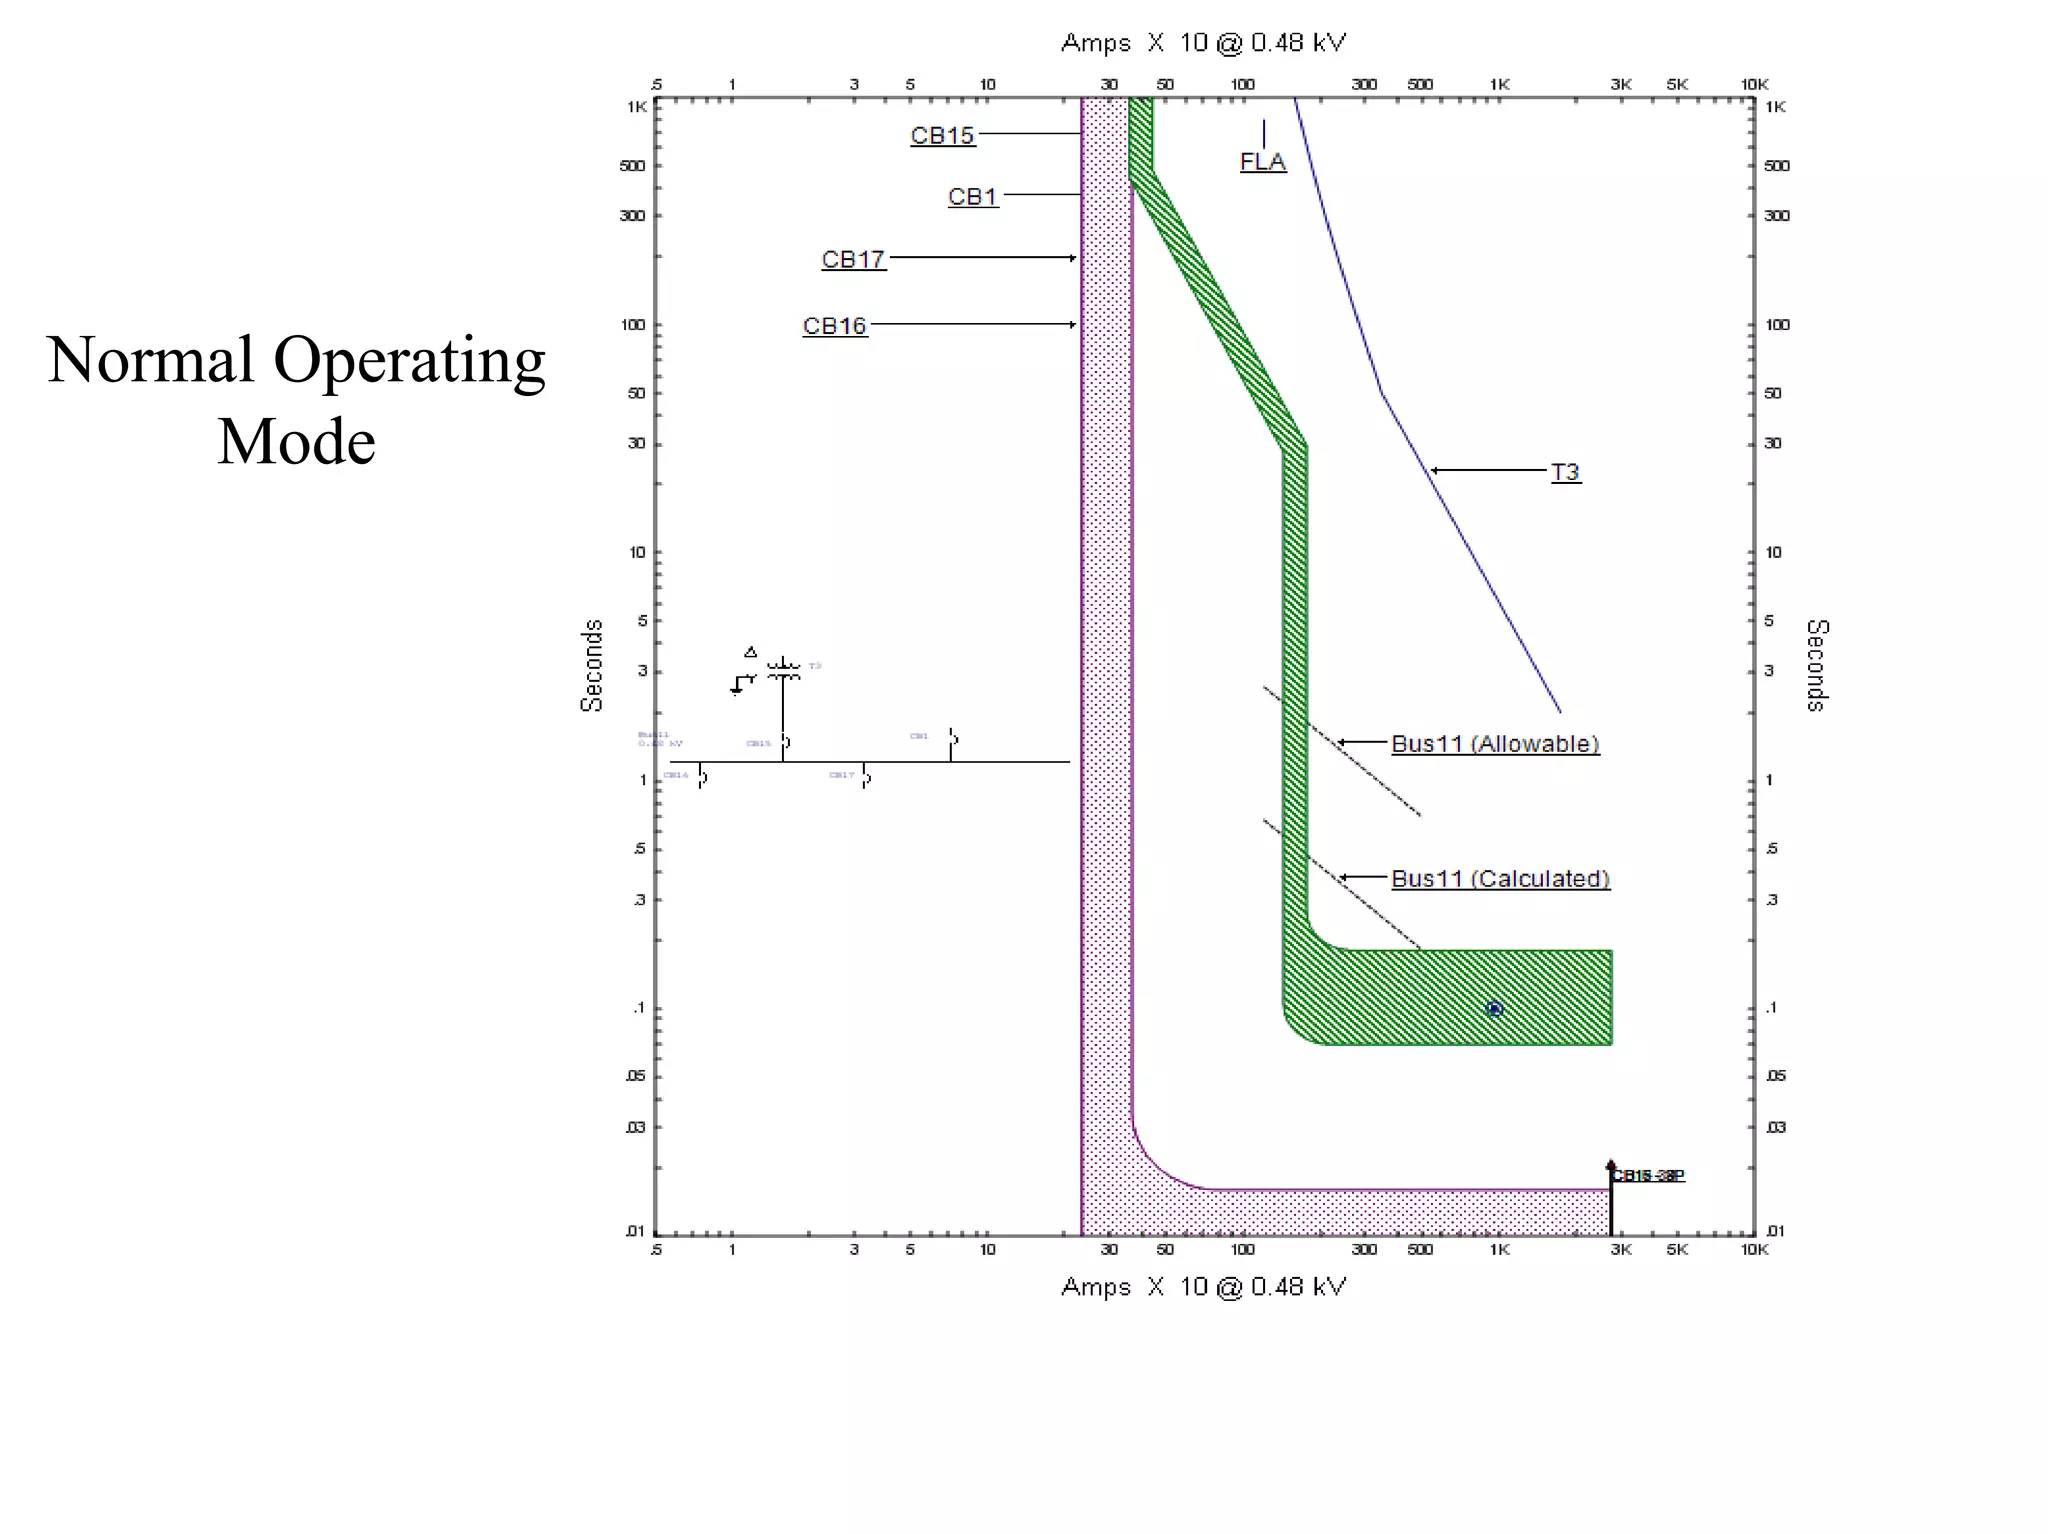
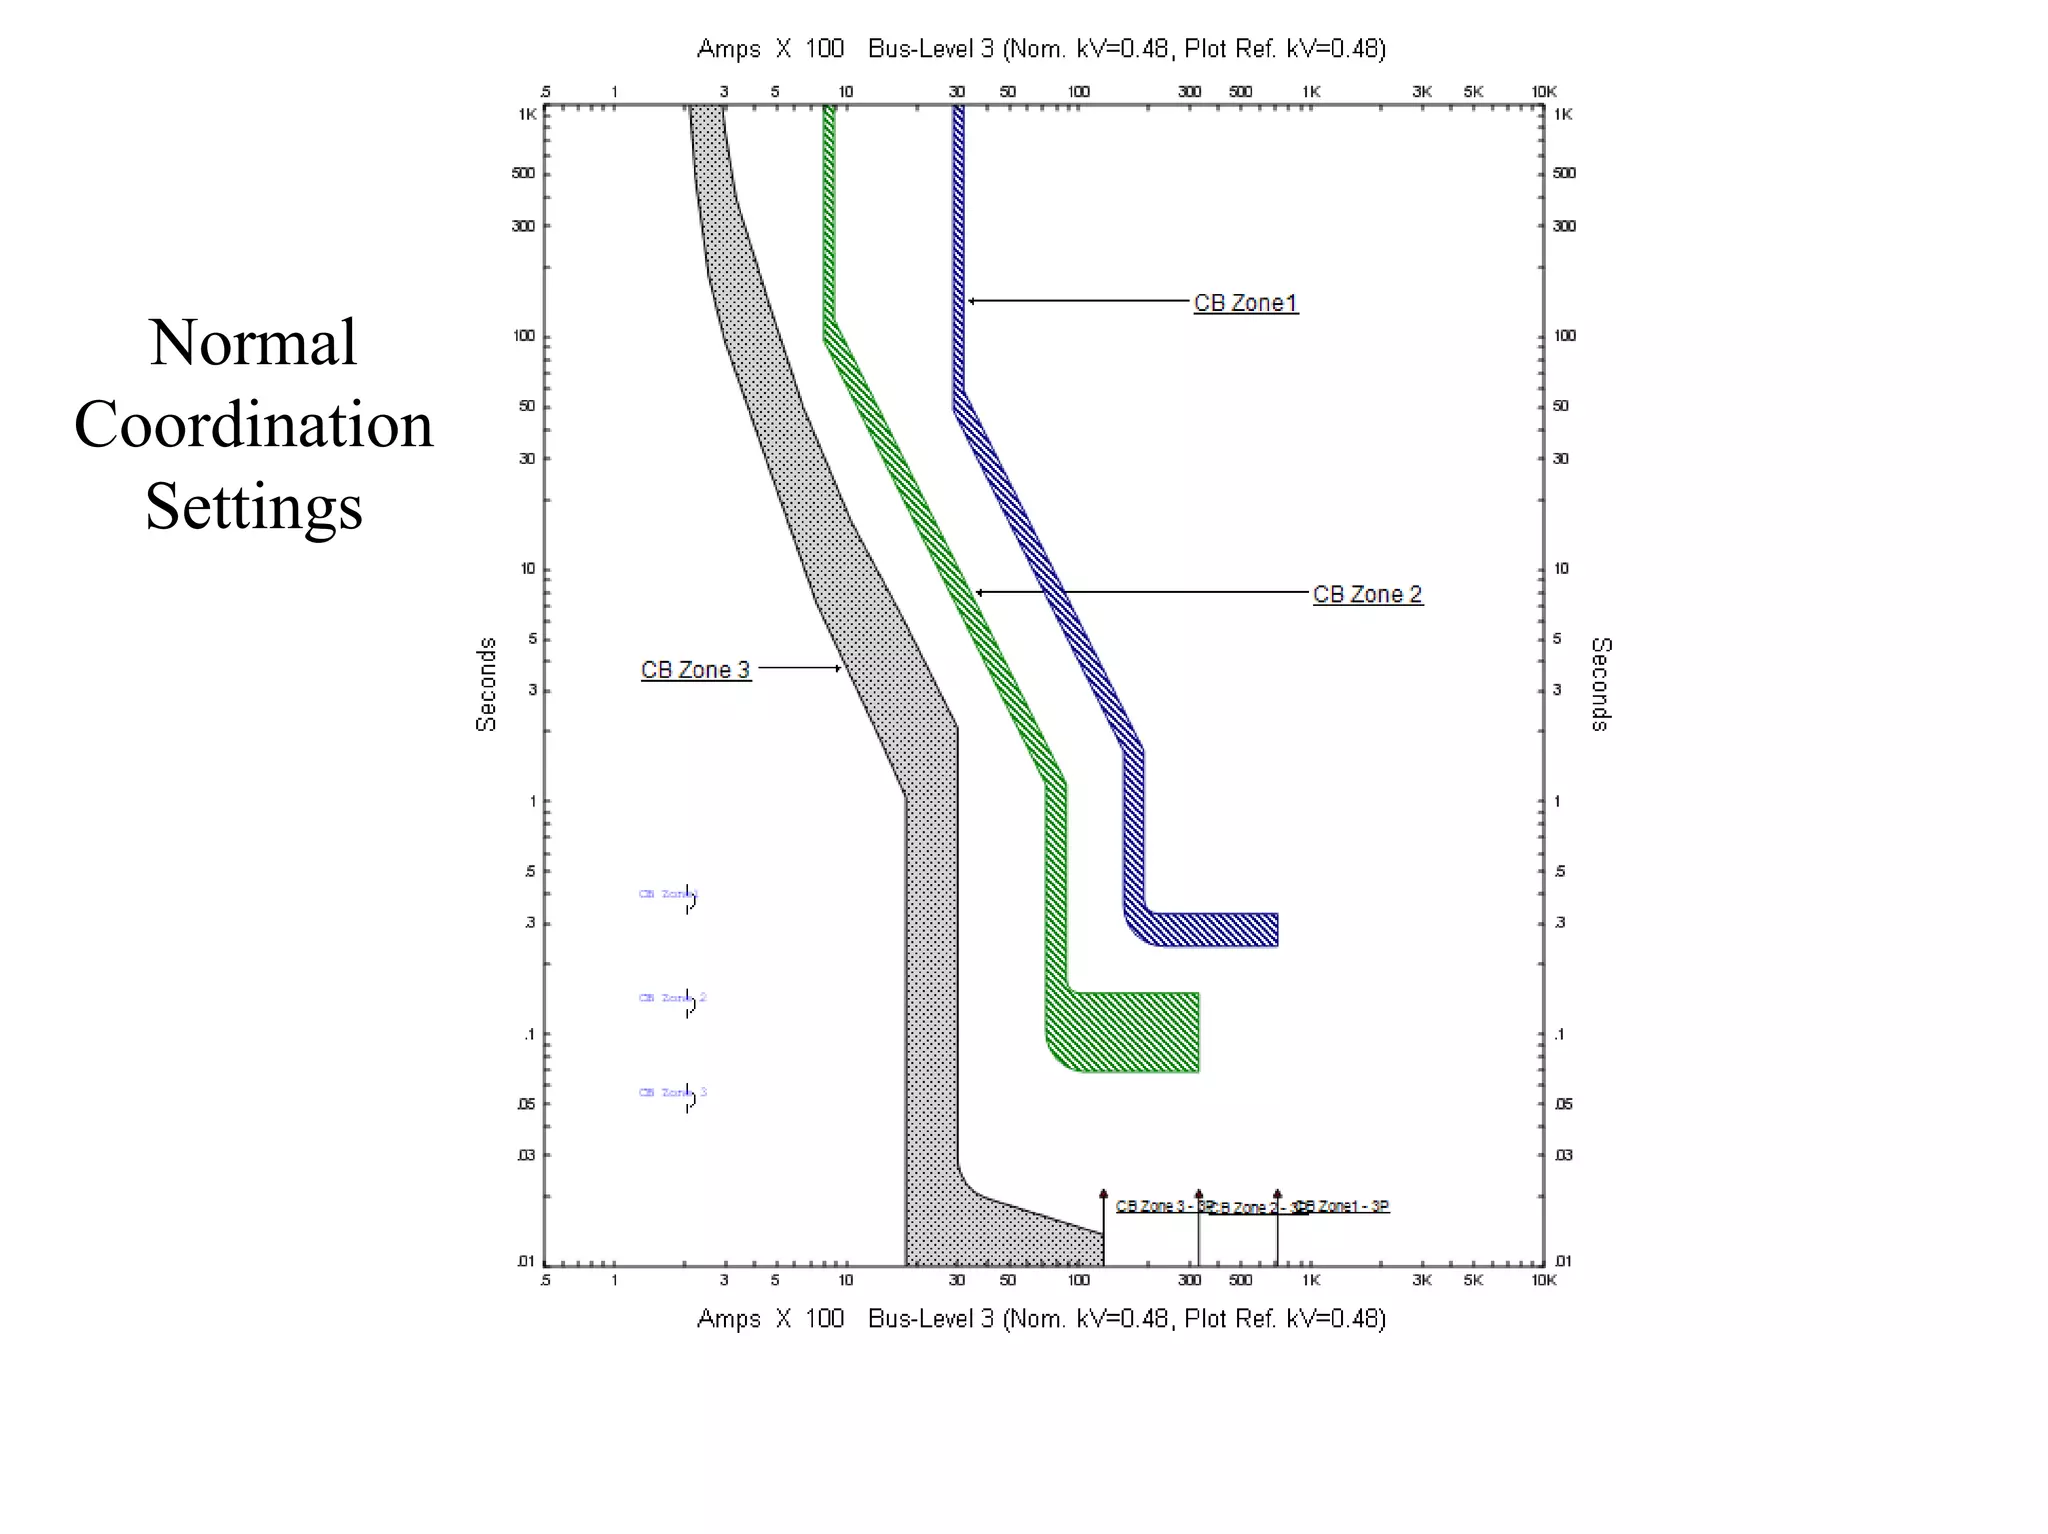
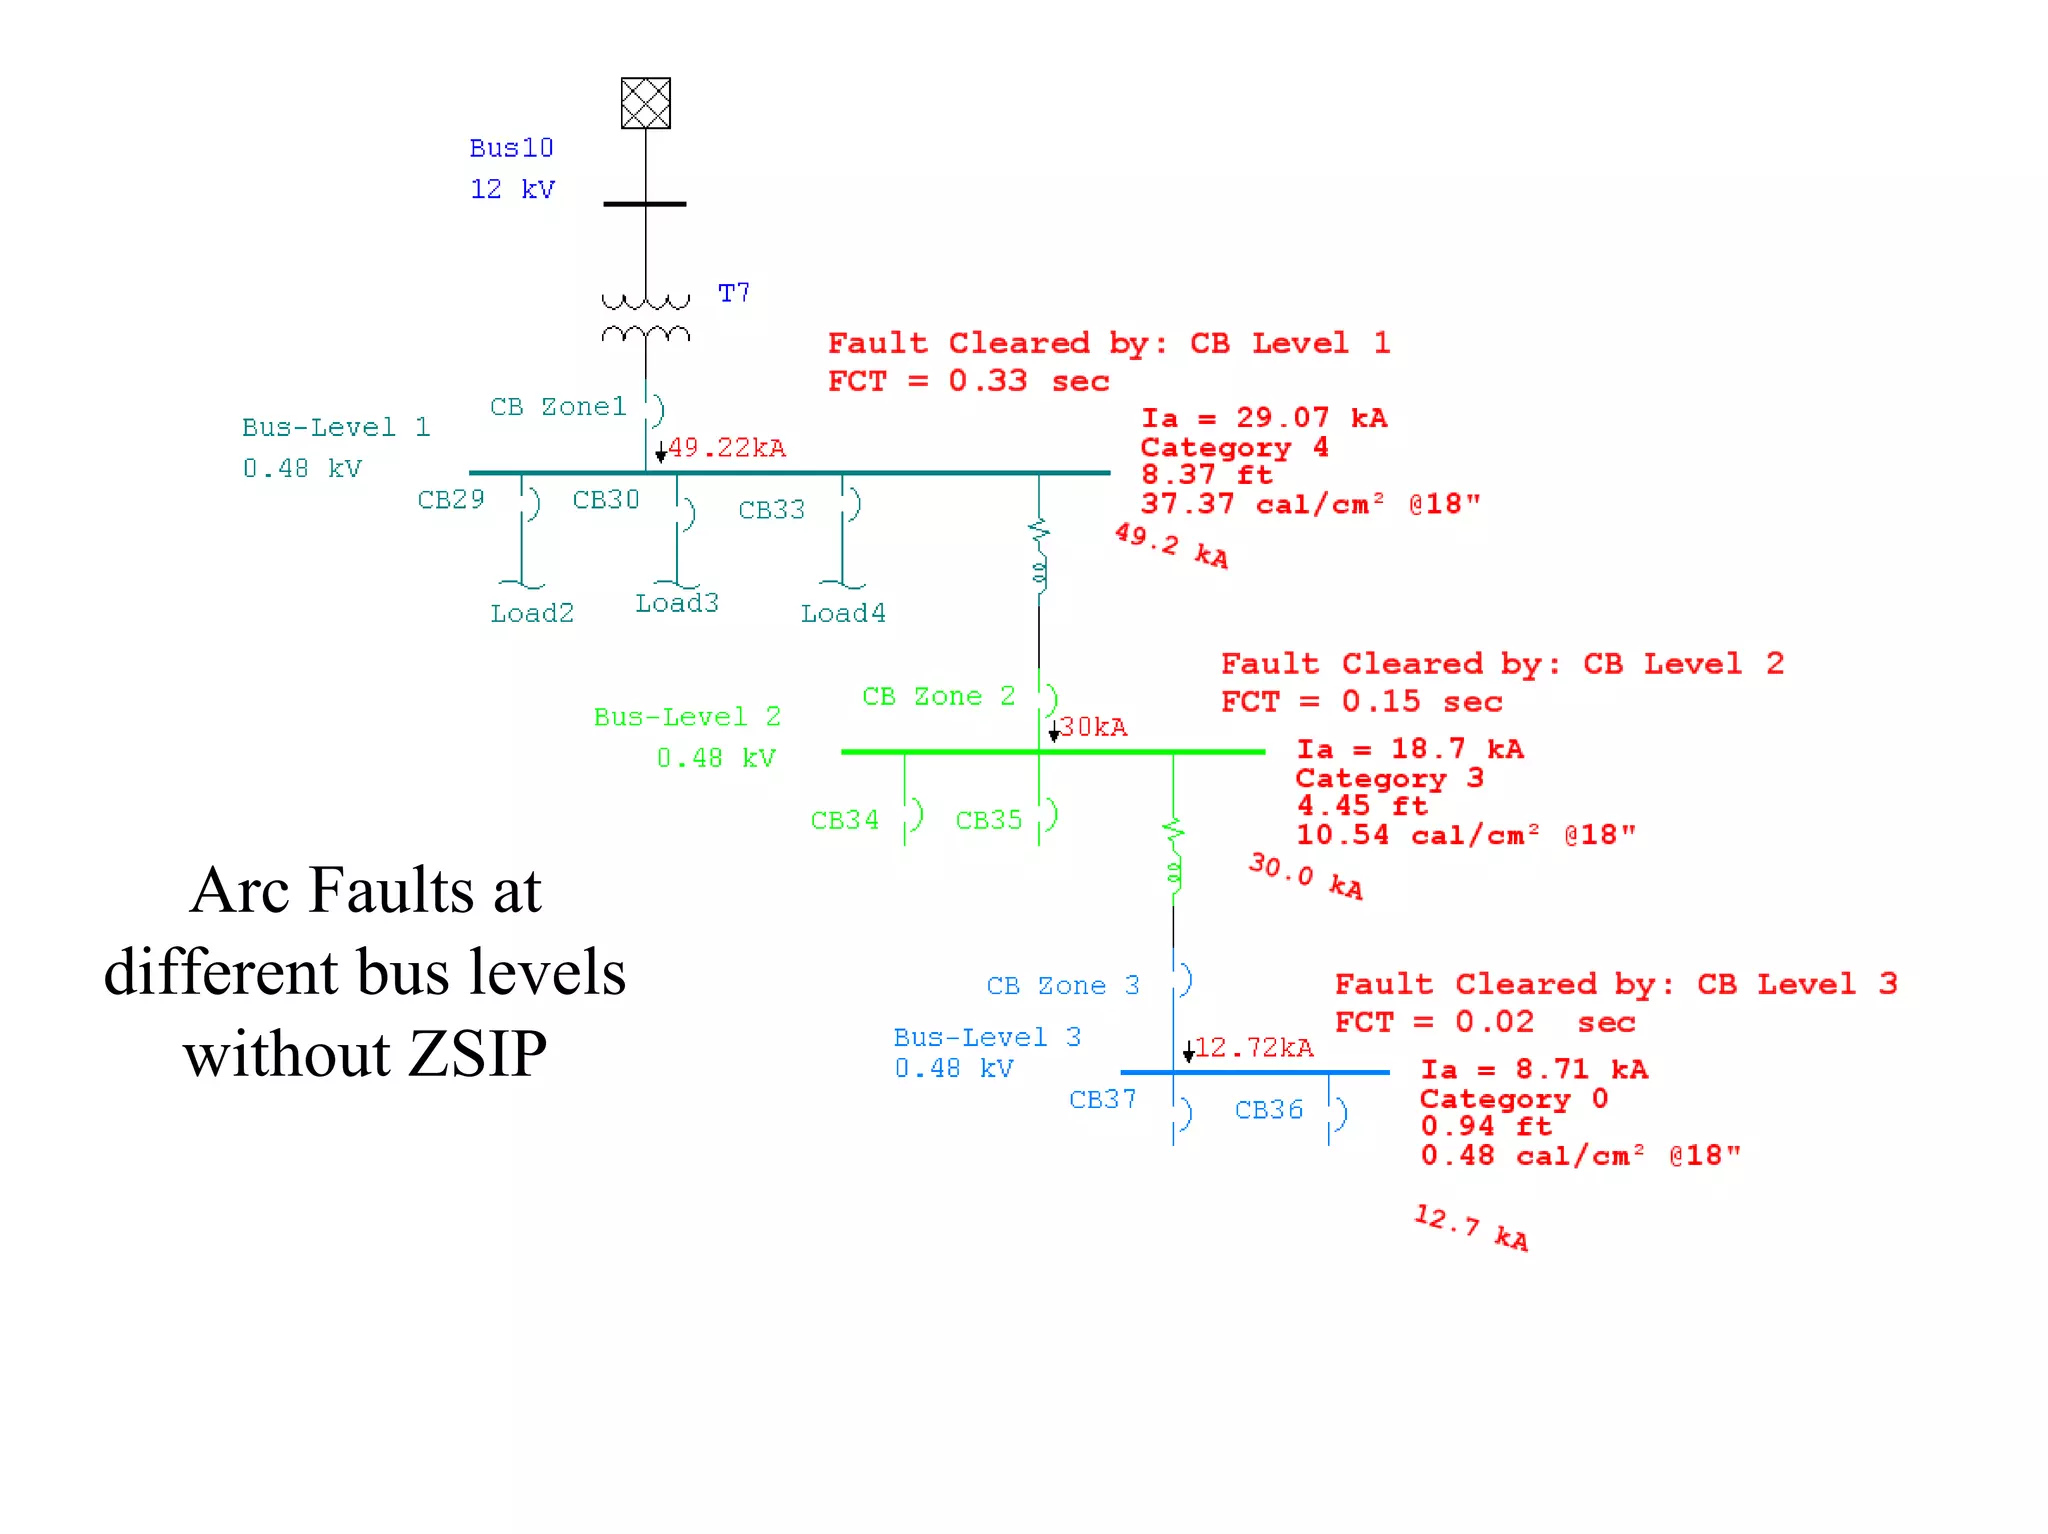
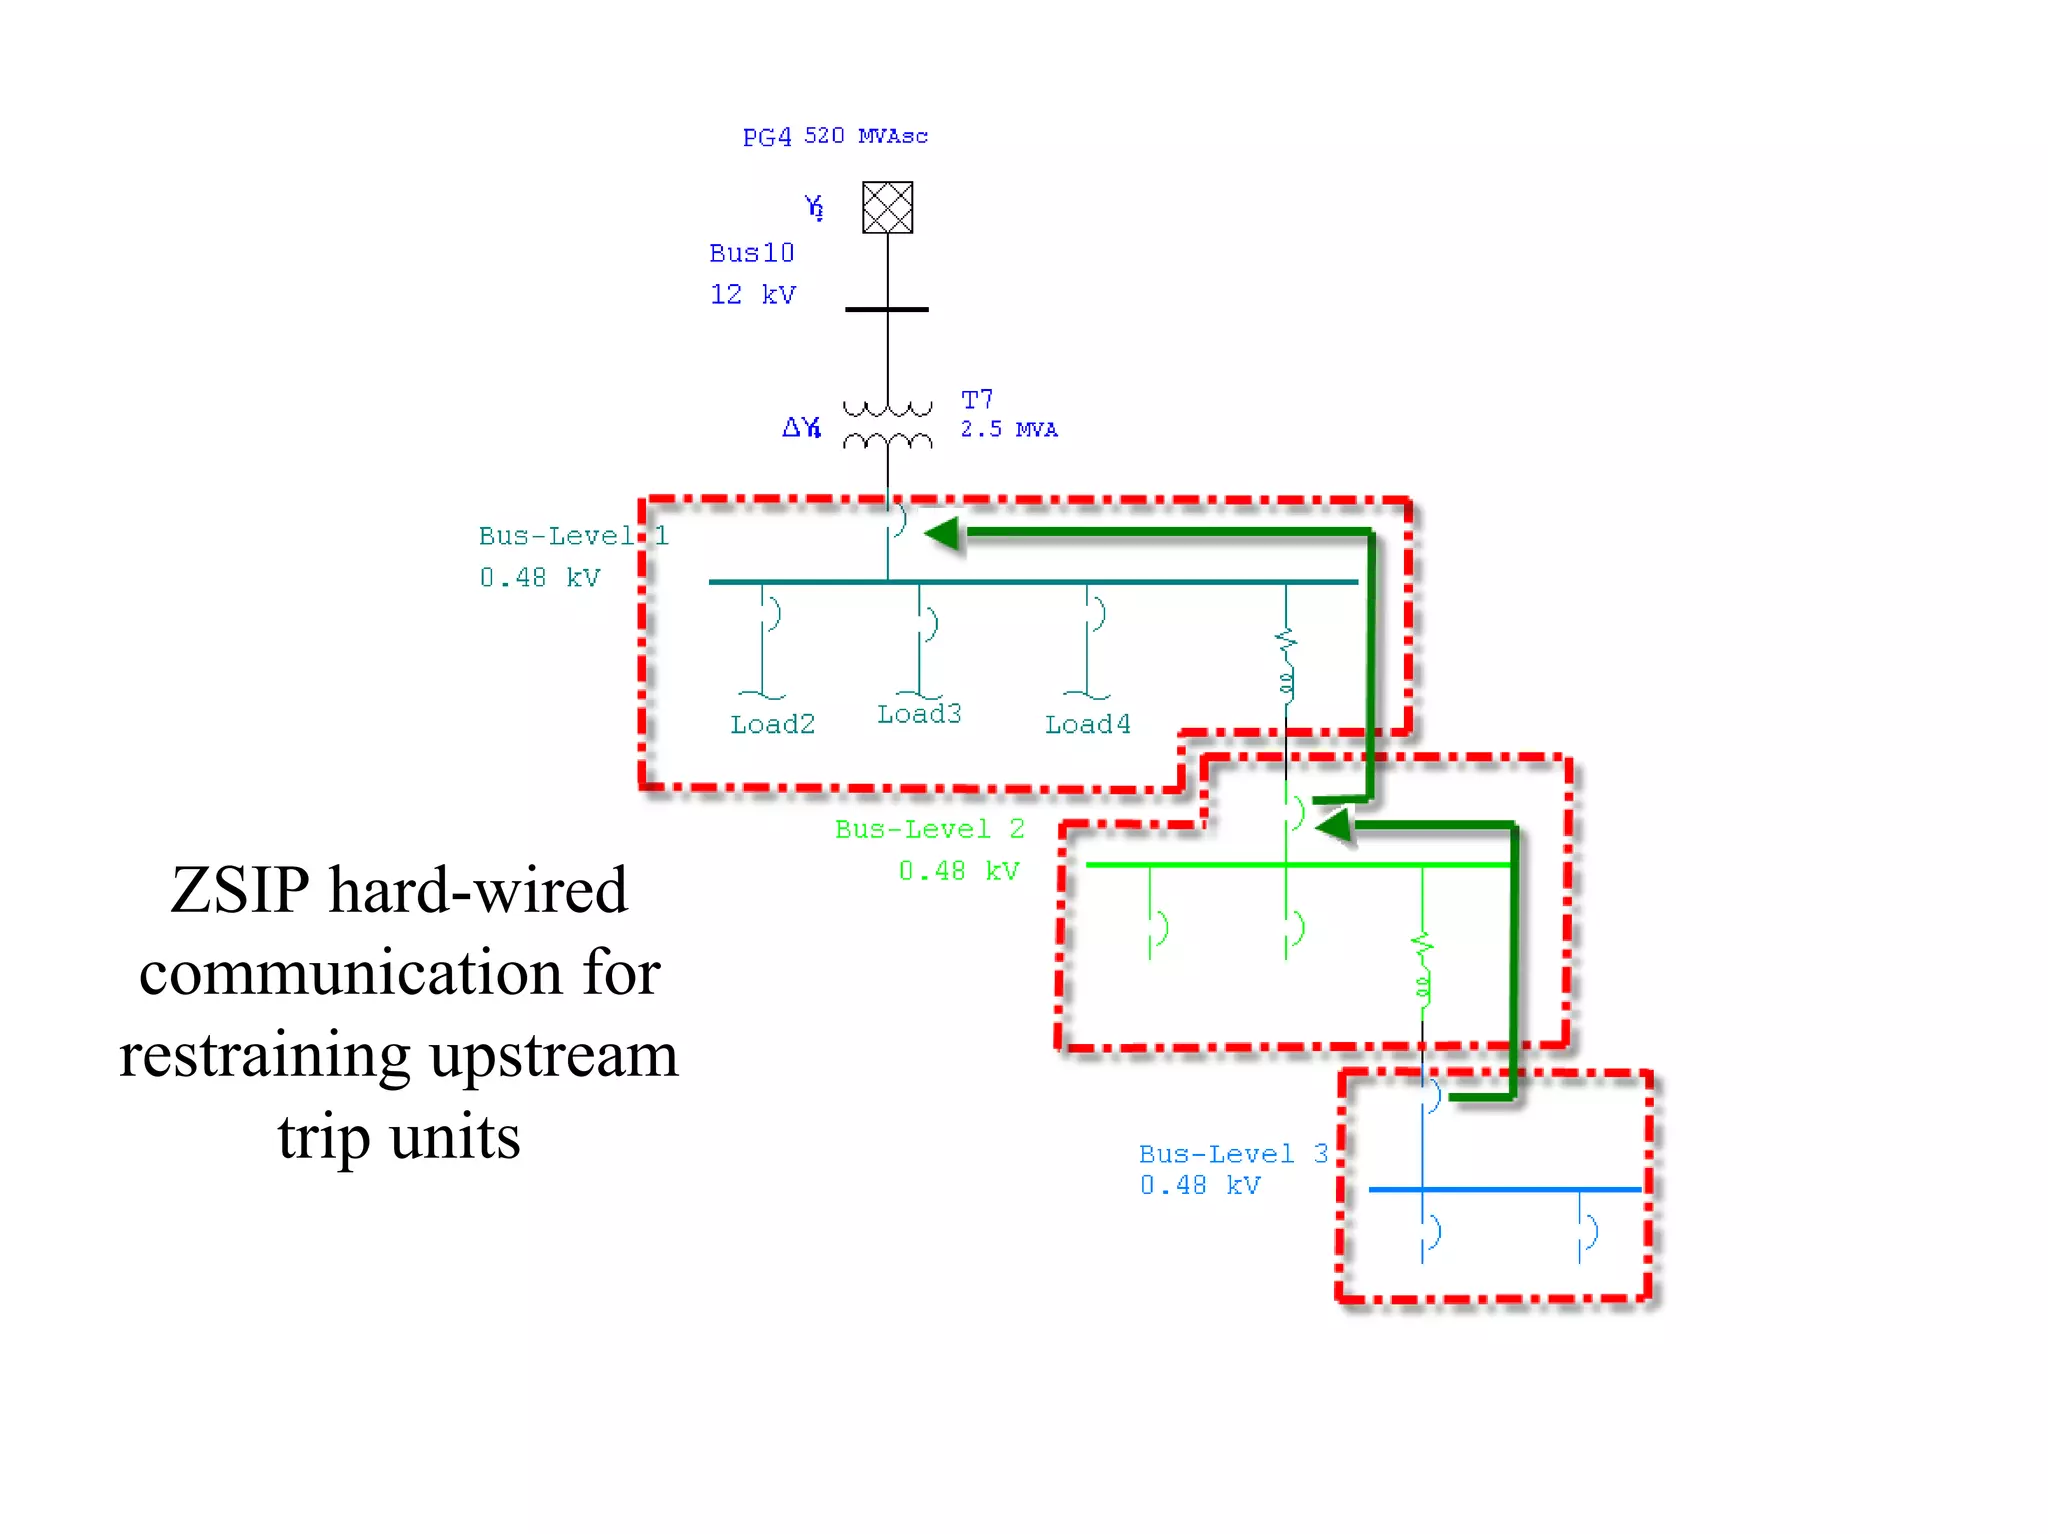
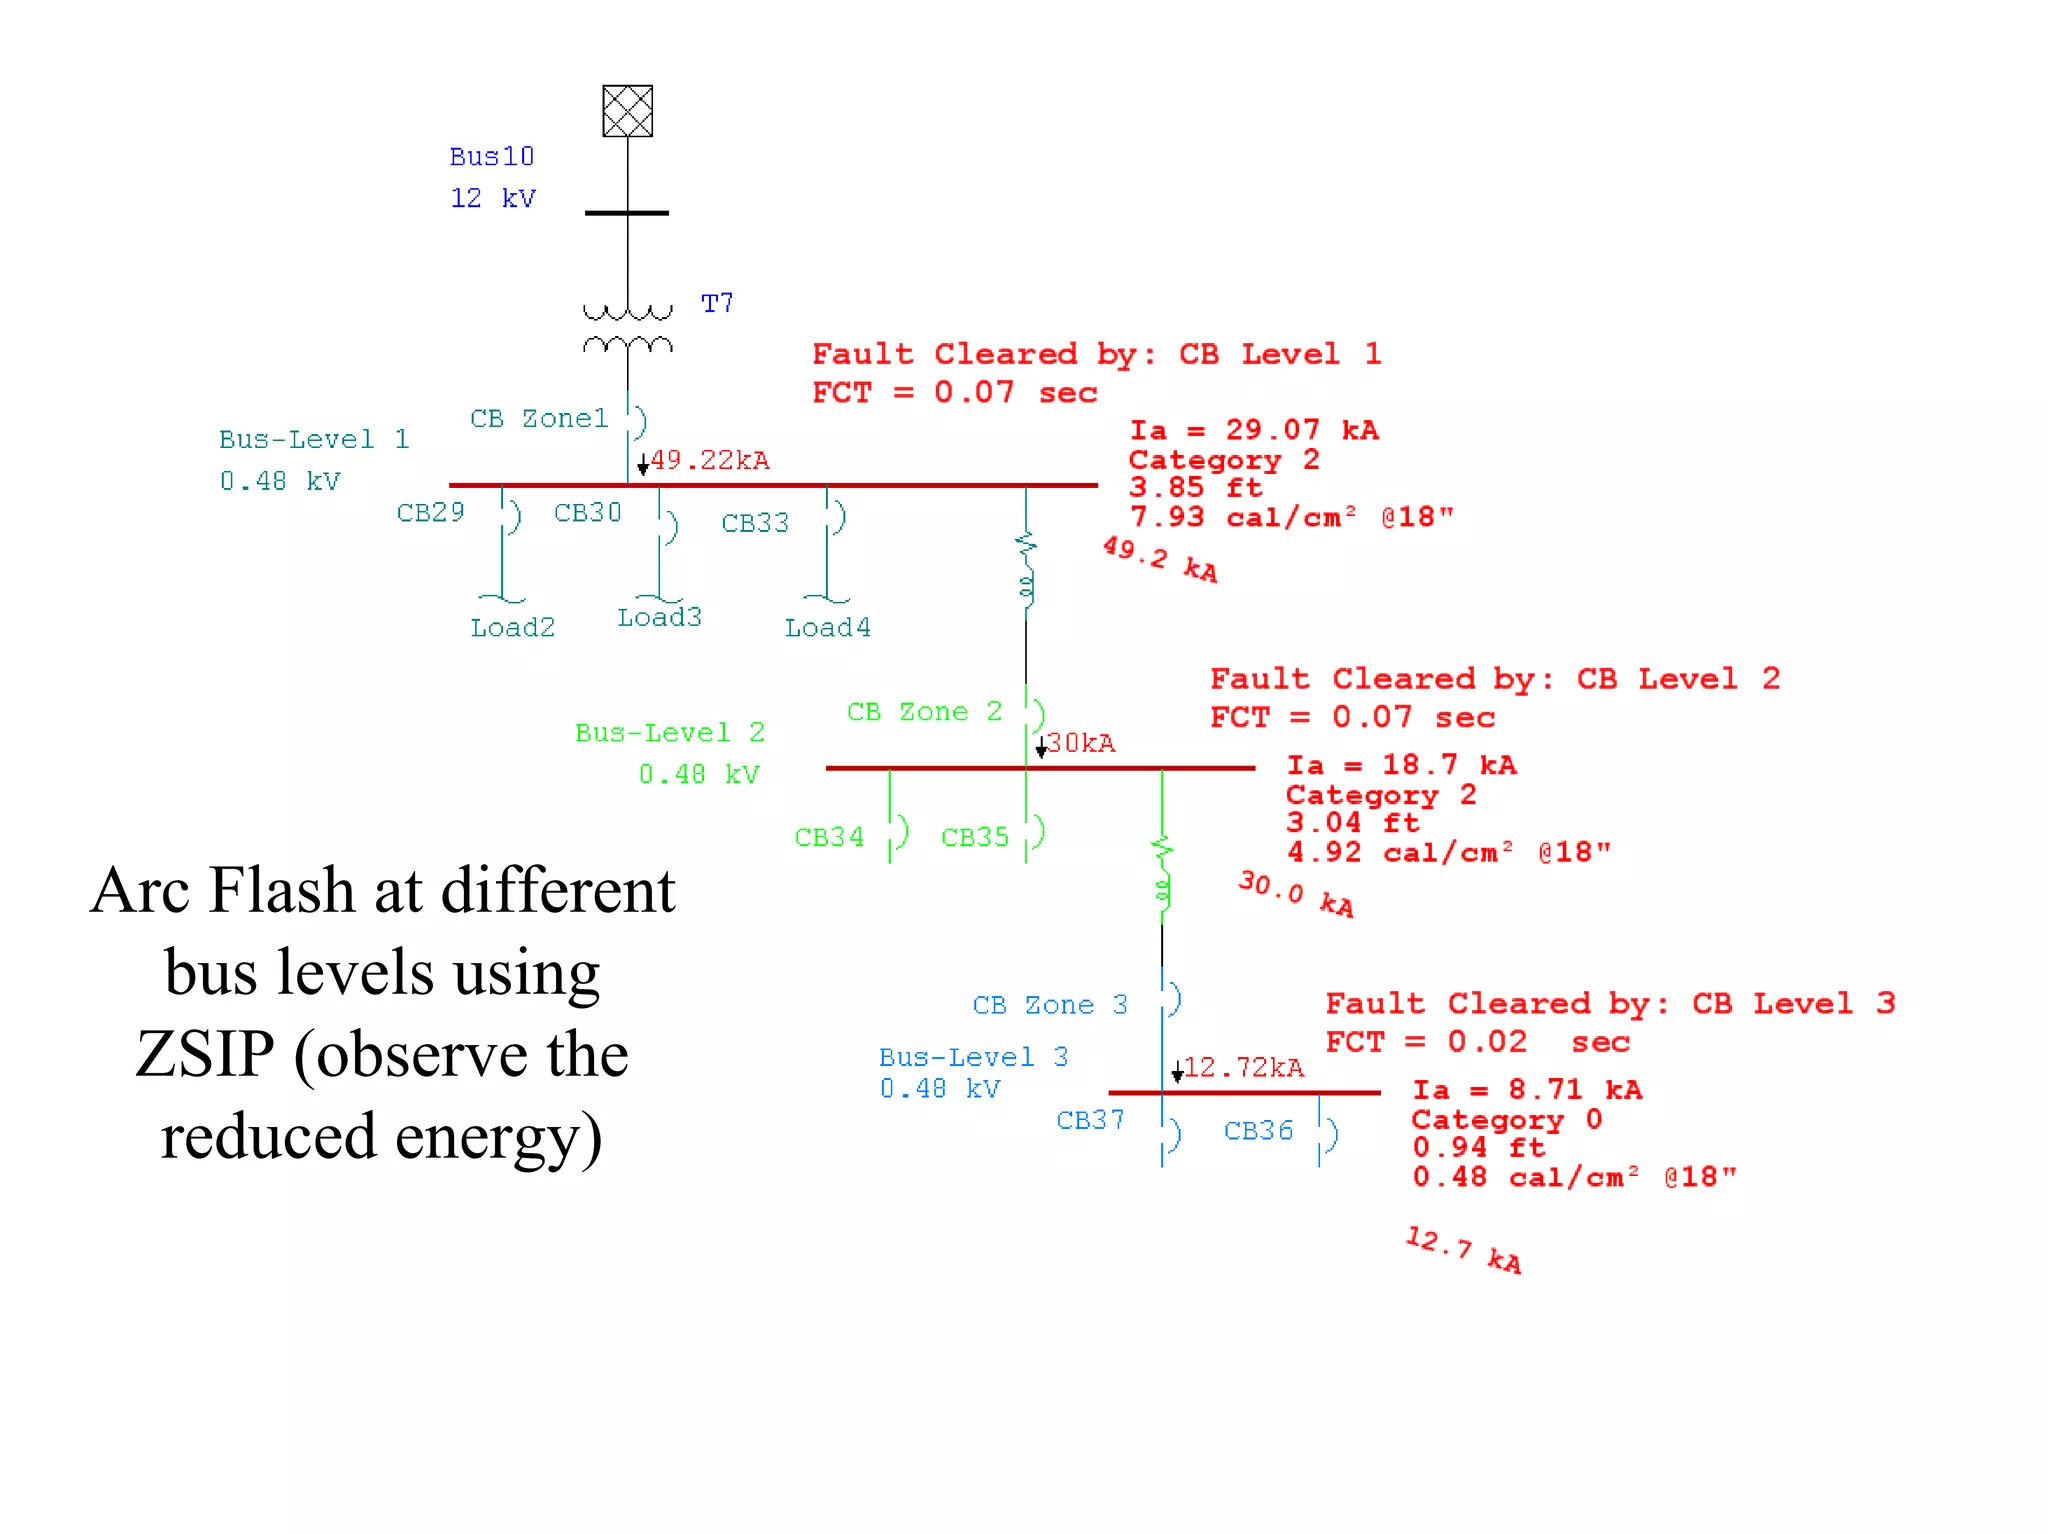
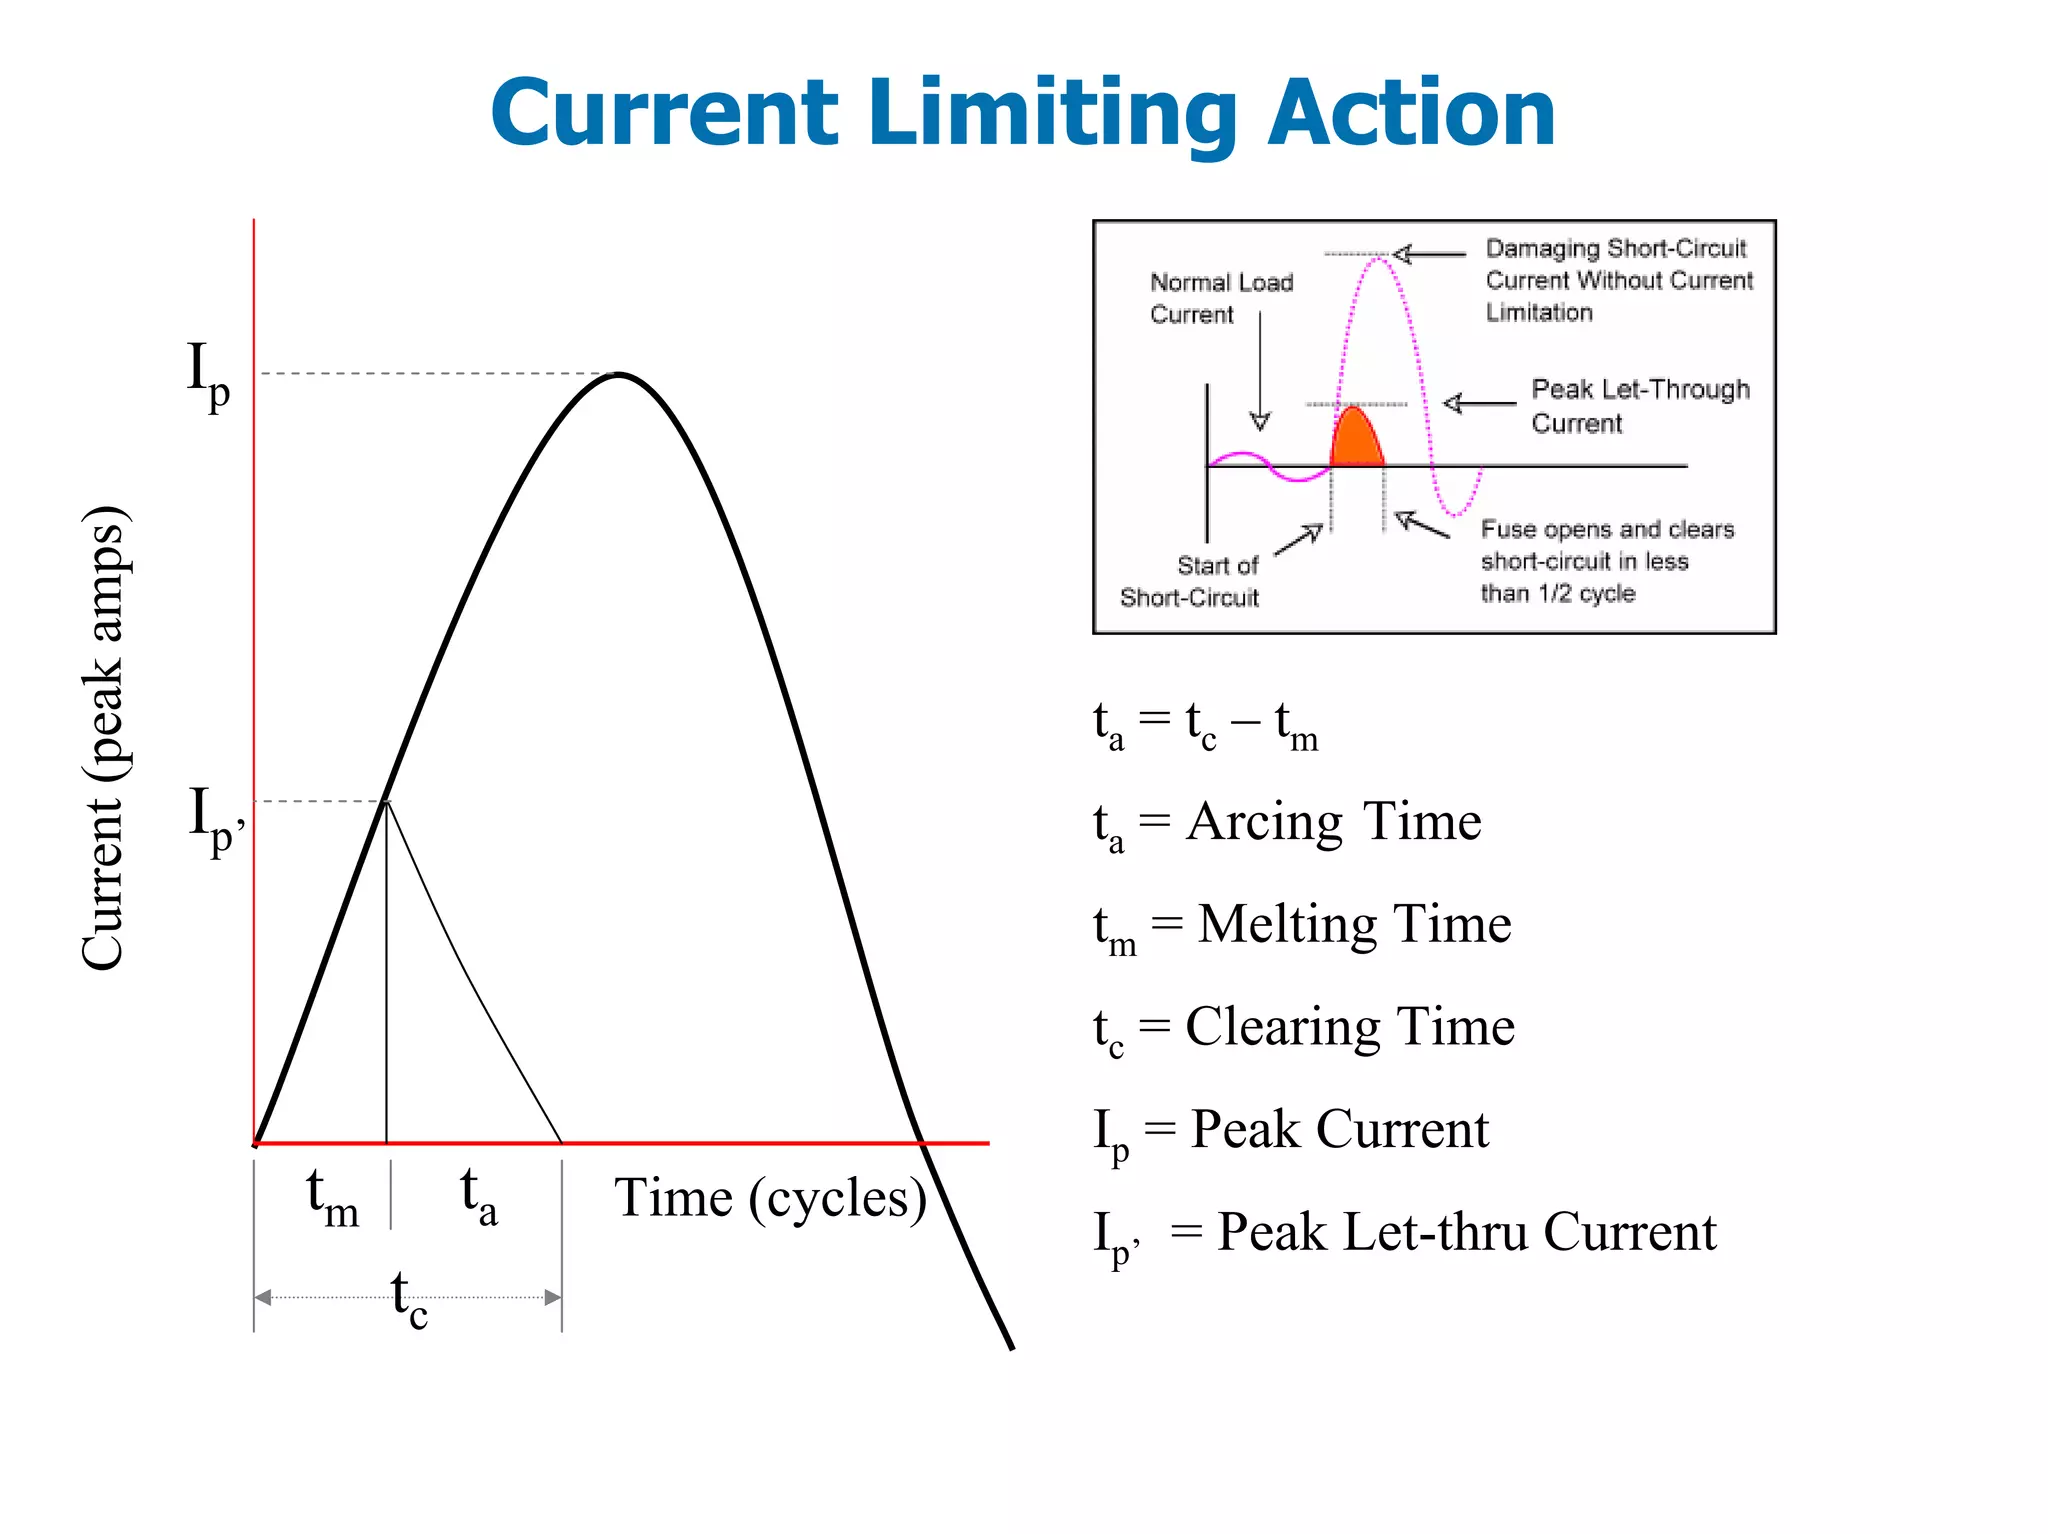
Short-circuit, Protective Device
Coordination & Arc Flash
Analysis
By Albert Marroquin
Operation Technology, Inc.
Agenda
• Short-circuit Calculations for Arc Flash Analysis
• Protection and Coordination Principles
• Arc Flash Analysis and Mitigation
• Upcoming Arc Flash Analysis Standards/Guidelines
Changes
• DC Arc Flash Analysis
• Transient Arc Flash Analysis for Generators
Short-Circuit Analysis
Types of SC Faults
•Three-Phase Ungrounded Fault
•Three-Phase Grounded Fault
•Phase to Phase Ungrounded Fault
•Phase to Phase Grounded Fault
•Phase to Ground Fault
Fault Current
•IL-G can range in utility systems from a few percent to
possibly 115 % ( if Xo < X1 ) of I3-phase (85% of all
faults).
•In industrial systems the situation IL-G > I3-phase is rare.
Typically IL-G ≅ .87 * I3-phase
•In an industrial system, the three-phase fault condition
is frequently the only one considered, since this type of
fault generally results in Maximum current.
Purpose of Short-Circuit Studies
• A Short-Circuit Study can be used to determine any
or all of the following:
Verify protective device close and latch capability
Verify protective device Interrupting capability
Protect equipment from large mechanical forces
(maximum fault kA)
I2t protection for equipment (thermal stress)
Selecting ratings or settings for relay coordination
System Components Involved in SC
Calculations
• Power Company Supply
• In-Plant Generators
• Transformers
• Reactors
• Feeder Cables / Cable Trays and Bus Duct Systems
System Components Involved in SC
Calculations
• Overhead Lines
• Synchronous Motors
• Induction Motors
• Protective Devices
• Y0 from Static Load and Line Cable
Short-Circuit Phenomenon
)tSin(Vmv(t) θω +∗=
i(t)v(t)
4444 34444 21444 3444 21
Offset)(DC
TransientStateSteady
t
)-sin(
Z
Vm
)-tsin(
Z
Vm
i(t)
(1))tSin(Vm
dt
di
LRiv(t)
L
R
-
e××++×=
+×=+=
φθφθω
θω
expressionfollowingtheyields1equationSolving
i(t)v(t)
AC Current (Symmetrical)
with No AC Decay
DC Current
© 1996-2009 Operation Technology, Inc. – Workshop Notes: Short-Circuit ANSI Slide 9
AC Fault Current Including the
DC Offset (No AC Decay)
© 1996-2009 Operation Technology, Inc. – Workshop Notes: Short-Circuit ANSI Slide 10
Machine Reactance ( λ = L I )
AC Decay Current
Fault Current Including AC & DC Decay
Short-Circuit Study for Arc Flash
• A Short-Circuit Study can be used to determine any
or all of the following:
Maximum and Minimum Short-circuit current levels
Prefault voltage values should be considered
Positive and Negative Impedance Tolerance Adjustments
Actual fault current values should be used including
decaying contributions for medium voltage systems
Operating Conditions and System Configurations which
may not be otherwise observed for regular SC studies
Reactance Representation for
Utility and Synchronous Machine for AF
½ Cycle 1 ½ to 4 Cycle 30 Cycle
Utility
X”d X”d X”d
Turbo Generator
X”d X’d Xd
Hydro-Gen with
Amortisseur winding
X”d X’d Xd
Condenser
X”d X’d
α
Synchronous Motor
X”d X’d α
Fault Current Decay
Fault Current Recording
Overcurrent Protection and
Coordination Principles
Definition
• Overcurrent Coordination
A systematic study of current responsive devices
in an electrical power system.
Objective
• To determine the ratings and settings of
fuses, breakers, relay, etc.
• To isolate the fault or overloads.
Coordination
• Limit the extent and duration of service
interruption
• Selective fault isolation
• Provide alternate circuits
Protection
• Prevent injury to personnel
• Minimize damage to components
Quickly isolate the affected portion of the system
Minimize the magnitude of available short-circuit
Spectrum Of Currents
• Load Current
Up to 100% of full-load
115-125% (mild overload)
• Overcurrent
Abnormal loading condition (Locked-Rotor)
• Fault Current
Fault condition
Ten times the full-load current and higher
• Arc Fault Currents
Between 95 to 38% of bolted fault currents
Coordination
t
I
C B A
C
D
D B
A
Protection vs. Coordination
• Coordination is not an exact science
• Compromise between protection and coordination
Reliability
Speed
Performance
Economics
Simplicity
Fixed Points
Points or curves which do not change regardless
of protective device settings:
• Cable damage curves
• Cable ampacities
• Transformer damage curves & inrush points
• Motor starting curves
• Generator damage curve / Decrement curve
• SC maximum and minimum fault points
Capability / Damage Curves
t
I
I2
2
t
Gen
I2
t
Motor
Xfmr
I2
t
Cable
I2
t
Cable Protection
2
2
1
t
A
T 234
0.0297log
T 234
Ι
=
⎡ ⎤+
⎢ ⎥
+⎣ ⎦
The actual temperature rise of a cable when exposed to
a short circuit current for a known time is calculated by:
Where:
A= Conductor area in circular-mils
I = Short circuit current in amps
t = Time of short circuit in seconds
T1= Initial operation temperature (750C)
T2=Maximum short circuit temperature (1500C)
Cable Short-Circuit Heating Limits
Recommended
temperature rise:
B) CU 75-200C
Transformer Categories I, II
200 HP
MCP
O/L
Starting Curve
I
2
T
(49)
MCP (50)
(51)
ts
tLR
LRAs LRAasym
Protective Devices
• Fuse
• Overload Heater
• Thermal Magnetic
• Low Voltage Solid State Trip
• Electro-Mechanical
• Motor Circuit Protector (MCP)
• Relay (50/51 P, N, G, SG, 51V, 67, 49, 46, 79, 21, …)
Fuse Types
• Expulsion Fuse (Non-CLF)
• Current Limiting Fuse (CLF)
• Electronic Fuse (S&C Fault Fiter)
Minimum Melting
Time Curve
Total Clearing
Time Curve
Molded Case CB
• Thermal-Magnetic
• Magnetic Only
• Motor Circuit Protector (MCP)
• Integrally Fused (Limiters)
• Current Limiting
• High Interrupting Capacity
• Non-Interchangeable Parts
• Insulated Case (Interchange
Parts)
Types
• Frame Size
• Poles
• Trip Rating
• Interrupting Capability
• Voltage
Thermal Minimum
Thermal Maximum
Magnetic
(instantaneous)
Overcurrent Relay
• Time-Delay (51 – I>)
• Short-Time Instantaneous ( I>>)
• Instantaneous (50 – I>>>)
• Electromagnetic (induction Disc)
• Solid State (Multi Function / Multi Level)
• Application
© 1996-2009 Operation Technology, Inc. – Workshop Notes: Protective Device Coordination
Relay Coordination
• Time margins should be maintained between T/C
curves
• Adjustment should be made for CB opening time
• Shorter time intervals may be used for solid state
relays
• Upstream relay should have the same inverse T/C
characteristic as the downstream relay (CO-8 to
CO-8) or be less inverse (CO-8 upstream to CO-6
downstream)
• Extremely inverse relays coordinates very well with
CLFs
Arc Flash Analysis Methods and
Mitigation
Analysis Methods for Arc Flash Hazards
NFPA 70E 2009 “Standard for Electrical Safety in the
Workplace”
IEEE 1584 2004a “Guide for Performing Arc Flash
Hazard Calculations”
Arc Flash Incident Video
AF Analysis Considerations
• Possible Arc Fault Locations
Line side arc faults
Load side arc faults
• Arc Flash Analysis Worst Case Scenarios
Maximum bolted short-circuit fault current
Minimum bolted short-circuit fault current
• Arcing Current Variation
Incident Energy at 100% of arcing current
Incident Energy at 85% of arcing current
Analysis of AF Results
• Arc Flash Analysis Scope
100s or 1000s of Buses
High/Medium/Low Voltage Systems
Multiple Operating Configurations
Dozens of Multiple Scenarios to be considered
Analysis of AF Results
• Determine Which Protective Device Clears the Arc Fault
Is it the first upstream device in all cases?
• Determine the Locations with Special Analysis
Conditions
Ibf is less than 700 or higher than 106,000 Amps
The bus nominal kV less than 0.208 kV
The feeder source has capacity less than 125 kVA (may
not have enough energy to generate the arc)
Methods to Mitigate the
Incident Energy
• Methods to Reduce the Fault Clearing Time
Improving coordination settings of OC PDs.
Type 50 protective devices (Instantaneous)
Arc Flash light sensors
Maintenance mode (switch)
Differential protection
Zone selective interlocking protection (ZSIP)
• Methods to Increase the Working Distance
Remote racking of breakers/Remote switching
Use of Hot Sticks
Methods to Mitigate the
Incident Energy
• Methods to Reduce the Short-Circuit Current
Current limiting fuses and circuit breakers
Current limiting reactors, Isolating Transformers
High resistance grounding
• Methods to Reduce the Energy Exposure
Arc resistant switchgear
Arc shields
Infrared scanning, Partial Discharge and or Corona
Cameras
Improving Over-Current Device
Coordination Settings
• Purpose is to isolate the fault with the nearest
upstream over-current protective device
• Arc flash results are extremely dependent on
coordination settings
• Unnecessarily high time dial settings for type 51
over-current devices
• Selection of fuses with faster total clearing time
characteristic curves can reduce the energy significantly
Arcing current 
through              A 
50/51‐1
Fault Clearing Time
is 37 cycles with
current time dial
settings
Incident Energy
released is greater
than 27 cal/cm²
Category 4
Arcing current 
through              A 
50/51‐1
Fault Clearing Time
= 10 cycles
with lower time dial
settings
Incident Energy
released is less than
8 cal/cm²
Category 2
Fuse Total Clearing Time based on 3.5 kA Arc Fault
Incident Energy Released for Each Fuse
Type 50 Protective Device
• Relays with instantaneous settings
• Molded case circuit breakers
• Insulated case breakers
• Power circuit breakers with instantaneous direct acting
trip elements
Type 50 PD Advantages
• Fast acting to reduce the fault clearing time since it can
operate within 3 to 6 cycles
• Commonly available for most MV and LV applications
• Cost effective and do not require special installations
• Already installed in electrical system and may only
require adjustments to reduce the incident energy
Type 50
Protective
Devices
Type 50 PD Drawbacks
• To achieve coordination with downstream elements,
upstream source Protective Devices have longer time
delays (do not have instantaneous protection)
• The arcing current magnitude passing through the Type 50
protective device must be higher than the device’s
instantaneous pickup setting
Type 50 PD Drawbacks
Selective
Coordination
introduces
time delays
Maintenance Mode
• Very fast acting trip device reduces the Fault Clearing Time
(FCT)
• Are designed to pickup under very low arcing current
values (instantaneous pickup setting is very low)
• Does not require complicated installation and will
effectively protect locations downstream from the trip unit
with maintenance mode
Maintenance
Mode
Normal
Operating
Mode
Normal Operating
Mode
Normal Operating
Mode
Maintenance Mode
Maintenance Mode
ON
Maintenance Mode Drawbacks
• System will not have coordination during the maintenance
period because of reduced instantaneous pickup settings
• Does not increase equipment protection unless the
maintenance mode is ON
• May not protect certain zones where energized equipment
tasks may be performed
Zone Selective Interlocking
Protection (ZSIP)
• Reduced arc fault clearing times
• Zone selection is accomplished by means of hard wired
communication between trip units
• Only the trip unit closest to the fault will operate within
instantaneous since upstream units are restrained by the
unit closest to the fault
• Equipment and personnel arc fault protection
Normal
Coordination
Settings
Arc Faults at
different bus levels
without ZSIP
ZSIP hard-wired
communication for
restraining upstream
trip units
Arc Flash at different
bus levels using
ZSIP (observe the
reduced energy)
ZSIP Drawbacks
• May take a bit longer to operate than type 50 devices
because of the inherent time delay required for the ZSI
logic operation
• If system is not coordinated, ZSIP does not necessarily
force coordination and other upstream devices may
operate before the device closest to the fault
• Arcing current must still be above short time pickup
Arc Flash Light Sensors
• Detect the light emitted by the arc
• Very fast operation (5 to 10 ms) after the light is detected
• Provide comprehensive zone or individual cubicle arc flash
protection (doors open or closed) when correctly applied
• Light sensor protection can be worn at time of task being
performed for additional safety
Light Sensors
Kema-Laboratory Tests
50 kA - 500 ms Arc Fault Clearing Time
Arc Flash without Light Sensors
Kema-Laboratory Tests
50 kA - 500 ms Arc Fault
Kema-Laboratory Tests
50 kA Arc Fault with 50ms Fault Clearing Time
Kema-Laboratory Tests
50 kA Arc Fault with 50ms Fault Clearing Time
Arc Flash Light Sensor Drawbacks
• Nuisance trips caused by light emitted from sources other
than electrical arcs (can be remedied by using a more
robust approach by combining over-current and light
sensors)
• Positioning of the light sensors poses a possible problem if
they are obstructed or blocked and cannot see the light
emitted by the arc
Light Sensor and
Over-Current Relay
Combination
Differential Protection
• Short Arc Fault Clearing Times
Differential protection can operate (relay plus breaker)
within 4 to 6 cycles
Relay can operate within ½ to 3 cycles
• Maintain coordination between protective devices upstream
and downstream from the Differential Protection Zone
• Differential protection provides continuous equipment arc
flash protection
Generator
Differential Relay
Bus Differential
Relay
Fault I = 13.83 kA
OC Protection
FCT = 0.643 sec
Fault I = 51.2 kA
Diff Protection
FCT = 0.060 sec
Bus Diff Protection vs. OC Relay
Differential Protection Drawbacks
• Nuisance trips caused by transformer inrush currents which
are seen by relay as internal faults - the magnetizing
current has particularly high second order harmonic content
which can be used to restrain or desensitize the relay
during energizing
• Higher equipment and installation costs - relatively higher
costs when compared to traditional over-current protective
devices
• Limited zone of protection for differential ct nodes
Current Limiting Methods
• Current Limiting Fuses
• Current Limiting Circuit Breakers
• Current Limiting Reactors
• Isolating transformers
• High Resistance Grounding
Current Limiting Fuses
• Current limiting fuses can operate in less than ½ cycle
• Current limiting action is achieved as long as the
magnitude of the arcing current is within the current
limiting range
• Current limitation curves (peak let-through curves) are
needed in order to check if the fuse can limit the current
• Can be very effective at reducing the incident energy if
properly used
Current Limiting Action
tm ta
Ip’
Ip
tc
Current(peakamps)
ta = tc – tm
ta = Arcing Time
tm = Melting Time
tc = Clearing Time
Ip = Peak Current
Ip’ = Peak Let-thru Current
Time (cycles)
Current Limiting Action
Current Limiting Fuse Drawbacks
• Current limiting action is achieved as long as the
magnitude of the arcing current is within the current
limiting range
• Can be thermally damaged and have altered characteristics
• Needs spares (which may be expensive) and there is not
indication of the type of fault.
• Energization on pre-existing fault = another blown fuse
Current Limiting Reactors
Isolating Transformers
• Current limiting reactors can help to reduce the available
fault current and thus reduce the available energy
• Isolating transformers help to reduce high kA short-circuit
levels (down to less than 10 kA).
• Isolating transformers add impedance between the main
switchboard and the smaller panels fed from it. The short-
circuit available at the switchboard may be considerably
higher
Increasing the Working Distance
• Hot Sticks
• Remote Racking
• Remote Switching
Remote Racking/Remote
Switching
• Are used to increase the personal space between the
potential source of the arc and the electrician
• Can be combined with high strength plastic shields to
reduce the effects of the arc flash/blast
Remote Racking/Remote Switching
Remote Racking/Remote
Switching
Remote Racking/Remote
Switching
Mitigating/Avoiding the
Incident Energy
• Arc Resistant Switchgear
• Arc Flash Shields
Arc Resistant Switchgear
• Funneling or re-directing the incident energy away from
the personal space
• Special design and construction allows the front of the
equipment to experience low levels of energy
• Arc flash may still be very severe and equipment will
suffer considerable damage
Arc Resistant Switchgear
Upcoming Arc Flash Analysis
Standards/Guidelines Changes
Arc Flash Analysis
Standards/Guidelines Changes
• How will these standards affect your
AF Analysis Calculations?
IEEE 1584b -2010
IEEE 1584.1-2010
IEEE 1814
NFPA 70E -2011
NESC- Utility Models / Testing for utility
equipment
Arc Flash Analysis
Standards/Guidelines Changes
• Recent Papers on arc flash in Low
Voltage Equipment
• NFPA 70E and IEEE Collaboration
to develop / revise current Models
• DC Arc Flash Calculations
NFPA 70E & IEEE1584 Collaboration
Efforts “Phase I” Test Results
• Refined Equations for Incident Energy
Calculations ~ Vertical, Horizontal and
Vertical with Barrier Conductor arrangements
• Effect of Sound ~ 140 db @ 20 kA fault
• Effect of Light ~ 45,000,000 LUX from Arc
Fault – Bright day is about 20,000 LUX
• Arc Blast Pressure Wave Effects ~ 0.9 psi
120 to 200 lbs of force
IEEE 1584b - Amendments
Relay Operated Power Circuit Breaker Interrupting times
Circuit Breaker Rating and Type Interrupting Time at 60
Hz (cycles)
Interrupting Time at 60 Hz
(seconds)
Low Voltage Molded Case CB 3.0 (used to be 1.5) 0.050 (used to be 0.025)
Low Voltage Insulated Case CB 3.0 0.050
Low Voltage Power CB 3.0 0.050
IEEE 1584b - Amendments
Main PD AF
Results
IEEE 1584b - Amendments
Results with Main
PD Isolation
Considered
Arc Flash for LV Systems
Impact of Arc Flash Events with Outward
Convective Flows on Worker Protection Strategies
ESW2010-11
Mike Lang, Member IEEE Ken Jones Member IEEE
Thomas Neal, PhD
Arc Flash for LV Systems
IEEE 1584.1 Analysis Guidelines
• Define what are the requirements for
performing AF analysis
• Defines the complexity of Systems
and the experience required to
perform and AF study
• Educates the Engineering process
(how to make conservative
assumptions)
IEEE 1814 Safety by Design
• Reduce the Risk by designing safer
equipment
• Samples of better Disconnect
Switch Design
• Including Technology like ZSIP into
Unit Substation Design
NESC – ROP for 2012
200 Amp Meter Base
Shorting Wire in Meter Base
DC Arc Flash Analysis
Methodology for DC Arc Flash
• DC SC and Arc Flash
Methodology for DC Arc Flash
• DC Arc Flash Basic Concepts
Methodology for DC Arc Flash
• DC Arc Power
Methodology for DC Arc Flash
• Maximum Power Method (2007 IEEE Electrical
Safety Workshop)
2
arc
arcsysm
bfarc
D
T
IV0.01IE
I0.5I
×××=
×=
Methodology for DC Arc Flash
• Detailed Theoretical Calculation Method (2009
IEEE PCIC) (Testing has confirmed the theoretical
method)
88.0
12.0
)534.020(
)534.020(
arc
g
arc
arcgarc
I
Z
R
IZV
××
=
×××=
Methodology for DC Arc Flash
• V-I Characteristic Curves
Methodology for DC AF
• Arc Energy Equations
arcarcarcarc
arcarcarcarcarc
dcdc
tRIE
RIIVP
IVPower
××≈
×=×=
×=
2
2
Methodology for DC AF
• DC Incident Energy Equations for Open Air and
Enclosed Configurations
221
2
4
da
E
kE
d
E
E
arc
arc
s
+
×=
=
π
Methodology for DC AF
• Enclosed DC Arc Fault values a and k
Enclosure Width
(mm)
Height
(mm)
Depth
(mm)
a
(mm)
k
Panelboard 305 356 191 100 0.127
LV Switchgear 508 508 508 400 0.312
MV Switchgear 1143 762 762 950 0.416
Test System
• Example using the theoretical method
Diff Method Result Comparison
• Comparison of the Maximum Power Method vs.
Theoretical Method
DC Arc
Flash
Method
Ibf dc
(kA)
Iarc
dc
(kA)
Rarc
(ohms
)
FCT
(sec
)
I.E. (cal/cm2)
Maximum
Power
18.63 9.315 N/A 1.2 13.8
Theoretical
Method
18.63 11.80
0
0.008 1.2 12.5
Transient Arc Flash Analysis for
Generators
Problem Description
• Arc Flash Incidents near or on Generator Auxiliary
Load
• No Generator Circuit Breaker
• Long Fault Clearing Time because of continuous
generator short-circuit current contribution
• Trying to determine a practical level of PPE to be
used for the task
• To determine a systematic method to determine
the incident energy for systems with high fault
current decay
System Description
System Description
Analysis Techniques and Assumptions
• IEEE 1584 and NFPA 70E do not provide any
specific analysis method for such systems
• The classic IEEE 1584 method utilizes the Bolted
fault current to determine the arc fault current
• The guidelines do not consider any transients or
decay in the fault currents
Arc Flash Analysis
Utility Breaker Operates 6 cycles after Arc
Fault is detected
Arc Flash Analysis
Arc Flash Analysis
Scenario
ID
Arc Flash Method Arcing
Current
(kA)
I.E. (cal/cm2) for 2.0
sec
Case 1 Half Cycle (Ia”) 21.44 51.6
Case 2 Four Cycle (Ia’) 21.33 51
Case 3 Decay Method (Ia” ~ Ia) 21.4 ~
11.5
35.7
Problems with Regular Arc Flash
Analysis Method
• The calculation results show very high incident
energy values
• Results in too much PPE requirements for the task
• Difficult to estimate the actual energy
Benefits from Transient Stability
Analysis
• Determine actual bolted fault current contributions
• Model actual generator time constants and exciter
field discharge strategies
• Accurate recalculation of the bolted fault current
levels for system separation
• Actual response of the Excitation and Generator
Controls
Methods of Reducing Generator Fault
Current
• Loss of Excitation
• Field Discharge Resistor / Crowbar bypass system
• Negative Field Forcing
Exciter Model Used for the Simulations
Field Discharge: Short-Circuit
Equivalent Circuit
Model for Field
Discharge Simulation
Field Discharge Resistor
A Field Discharge Resistor (FDR) is
added along with the generator Time
Constant (T’do)
Negative Field Forcing
For Negative Field Forcing.
The discharge rate is
dependent on the value of
the negative voltage
Transient Stability Scenarios
Scenario
ID
Field Discharge
Scheme
Simulation
Method
Bolted Fault
Current @ 2.0
sec
Case 1 None TS 17.7 kA
Case 2 Loss of Excitation TS 11.2 kA
Case 3 FDR to with RD = RF TS 6.2 kA
Case 4 Negative Field Forcing TS with UDM 0.54 kA
Fault Current Comparison
Incident Energy Determination from TS
Results
• Using Spreadsheet, MathCAD or Matlab to import
the bolted fault current values from the Transient
Fault Study
• The IEEE 1584 2002 Empirical Equations are used
• The energy is determined by integrating the
incident energy results from each time step up to
arbitrary time of exposure (i.e. 2.0 sec)
Incident Energy Comparison
Scenario
ID
Field Discharge
Scheme
I.E. (cal/cm2) for
2.0 sec
Case 1 None 40.8
Case 2 Loss of Excitation 33.1
Case 3 FDR to with RD = RF 25.7
Case 4 Negative Field Forcing 19.8
Comparison Against Arc Flash
I.E. (cal/cm2) for 2.0
sec
(Arc Flash with TS)
I.E. (cal/cm2) for
2.0 sec
(Regular Arc Flash)
Highest Results 40.8 51.6
Lowest Results 19.8 35.7
References
• Generator Field Discharge Methods – provided by
Wayne Eads of Southern Company Generation
• IEEE Standard 421.5 IEEE Recommended Practice
for Excitation System Models for Power System
Studies
• IEEE 1584 2002
• Power System Stability and Control, Prabha
Kundur
References
• DC Arc Flash and Shock NFPA 70E ROP –Memphis
Feb 18, 2010
• DC Arc Models and Incident Energy Calculations
Paper No. PCIC-2009-07 – Award Winning Paper
• DC Arc Hazard Assessment Phase II Copyright
Material Kenectrics Inc., Report No. K-012623-RA-
0002-R00
Questions?
• Questions?

Short Circuit, Protective Device Coordination

  • 1.
    Short-circuit, Protective Device Coordination& Arc Flash Analysis By Albert Marroquin Operation Technology, Inc.
  • 2.
    Agenda • Short-circuit Calculationsfor Arc Flash Analysis • Protection and Coordination Principles • Arc Flash Analysis and Mitigation • Upcoming Arc Flash Analysis Standards/Guidelines Changes • DC Arc Flash Analysis • Transient Arc Flash Analysis for Generators
  • 3.
    Short-Circuit Analysis Types ofSC Faults •Three-Phase Ungrounded Fault •Three-Phase Grounded Fault •Phase to Phase Ungrounded Fault •Phase to Phase Grounded Fault •Phase to Ground Fault Fault Current •IL-G can range in utility systems from a few percent to possibly 115 % ( if Xo < X1 ) of I3-phase (85% of all faults). •In industrial systems the situation IL-G > I3-phase is rare. Typically IL-G ≅ .87 * I3-phase •In an industrial system, the three-phase fault condition is frequently the only one considered, since this type of fault generally results in Maximum current.
  • 4.
    Purpose of Short-CircuitStudies • A Short-Circuit Study can be used to determine any or all of the following: Verify protective device close and latch capability Verify protective device Interrupting capability Protect equipment from large mechanical forces (maximum fault kA) I2t protection for equipment (thermal stress) Selecting ratings or settings for relay coordination
  • 5.
    System Components Involvedin SC Calculations • Power Company Supply • In-Plant Generators • Transformers • Reactors • Feeder Cables / Cable Trays and Bus Duct Systems
  • 6.
    System Components Involvedin SC Calculations • Overhead Lines • Synchronous Motors • Induction Motors • Protective Devices • Y0 from Static Load and Line Cable
  • 7.
  • 8.
    4444 34444 214443444 21 Offset)(DC TransientStateSteady t )-sin( Z Vm )-tsin( Z Vm i(t) (1))tSin(Vm dt di LRiv(t) L R - e××++×= +×=+= φθφθω θω expressionfollowingtheyields1equationSolving i(t)v(t)
  • 9.
    AC Current (Symmetrical) withNo AC Decay DC Current © 1996-2009 Operation Technology, Inc. – Workshop Notes: Short-Circuit ANSI Slide 9
  • 10.
    AC Fault CurrentIncluding the DC Offset (No AC Decay) © 1996-2009 Operation Technology, Inc. – Workshop Notes: Short-Circuit ANSI Slide 10
  • 11.
    Machine Reactance (λ = L I ) AC Decay Current
  • 12.
  • 13.
    Short-Circuit Study forArc Flash • A Short-Circuit Study can be used to determine any or all of the following: Maximum and Minimum Short-circuit current levels Prefault voltage values should be considered Positive and Negative Impedance Tolerance Adjustments Actual fault current values should be used including decaying contributions for medium voltage systems Operating Conditions and System Configurations which may not be otherwise observed for regular SC studies
  • 14.
    Reactance Representation for Utilityand Synchronous Machine for AF ½ Cycle 1 ½ to 4 Cycle 30 Cycle Utility X”d X”d X”d Turbo Generator X”d X’d Xd Hydro-Gen with Amortisseur winding X”d X’d Xd Condenser X”d X’d α Synchronous Motor X”d X’d α
  • 15.
  • 16.
  • 17.
  • 18.
    Definition • Overcurrent Coordination Asystematic study of current responsive devices in an electrical power system.
  • 19.
    Objective • To determinethe ratings and settings of fuses, breakers, relay, etc. • To isolate the fault or overloads.
  • 20.
    Coordination • Limit theextent and duration of service interruption • Selective fault isolation • Provide alternate circuits
  • 21.
    Protection • Prevent injuryto personnel • Minimize damage to components Quickly isolate the affected portion of the system Minimize the magnitude of available short-circuit
  • 22.
    Spectrum Of Currents •Load Current Up to 100% of full-load 115-125% (mild overload) • Overcurrent Abnormal loading condition (Locked-Rotor) • Fault Current Fault condition Ten times the full-load current and higher • Arc Fault Currents Between 95 to 38% of bolted fault currents
  • 23.
  • 24.
    Protection vs. Coordination •Coordination is not an exact science • Compromise between protection and coordination Reliability Speed Performance Economics Simplicity
  • 25.
    Fixed Points Points orcurves which do not change regardless of protective device settings: • Cable damage curves • Cable ampacities • Transformer damage curves & inrush points • Motor starting curves • Generator damage curve / Decrement curve • SC maximum and minimum fault points
  • 26.
    Capability / DamageCurves t I I2 2 t Gen I2 t Motor Xfmr I2 t Cable I2 t
  • 27.
    Cable Protection 2 2 1 t A T 234 0.0297log T234 Ι = ⎡ ⎤+ ⎢ ⎥ +⎣ ⎦ The actual temperature rise of a cable when exposed to a short circuit current for a known time is calculated by: Where: A= Conductor area in circular-mils I = Short circuit current in amps t = Time of short circuit in seconds T1= Initial operation temperature (750C) T2=Maximum short circuit temperature (1500C)
  • 28.
    Cable Short-Circuit HeatingLimits Recommended temperature rise: B) CU 75-200C
  • 29.
  • 30.
    200 HP MCP O/L Starting Curve I 2 T (49) MCP(50) (51) ts tLR LRAs LRAasym
  • 31.
    Protective Devices • Fuse •Overload Heater • Thermal Magnetic • Low Voltage Solid State Trip • Electro-Mechanical • Motor Circuit Protector (MCP) • Relay (50/51 P, N, G, SG, 51V, 67, 49, 46, 79, 21, …)
  • 32.
    Fuse Types • ExpulsionFuse (Non-CLF) • Current Limiting Fuse (CLF) • Electronic Fuse (S&C Fault Fiter)
  • 33.
  • 34.
    Molded Case CB •Thermal-Magnetic • Magnetic Only • Motor Circuit Protector (MCP) • Integrally Fused (Limiters) • Current Limiting • High Interrupting Capacity • Non-Interchangeable Parts • Insulated Case (Interchange Parts) Types • Frame Size • Poles • Trip Rating • Interrupting Capability • Voltage
  • 35.
  • 36.
    Overcurrent Relay • Time-Delay(51 – I>) • Short-Time Instantaneous ( I>>) • Instantaneous (50 – I>>>) • Electromagnetic (induction Disc) • Solid State (Multi Function / Multi Level) • Application
  • 37.
    © 1996-2009 OperationTechnology, Inc. – Workshop Notes: Protective Device Coordination
  • 38.
    Relay Coordination • Timemargins should be maintained between T/C curves • Adjustment should be made for CB opening time • Shorter time intervals may be used for solid state relays • Upstream relay should have the same inverse T/C characteristic as the downstream relay (CO-8 to CO-8) or be less inverse (CO-8 upstream to CO-6 downstream) • Extremely inverse relays coordinates very well with CLFs
  • 39.
    Arc Flash AnalysisMethods and Mitigation
  • 40.
    Analysis Methods forArc Flash Hazards NFPA 70E 2009 “Standard for Electrical Safety in the Workplace” IEEE 1584 2004a “Guide for Performing Arc Flash Hazard Calculations”
  • 41.
  • 42.
  • 43.
  • 44.
    AF Analysis Considerations •Possible Arc Fault Locations Line side arc faults Load side arc faults • Arc Flash Analysis Worst Case Scenarios Maximum bolted short-circuit fault current Minimum bolted short-circuit fault current • Arcing Current Variation Incident Energy at 100% of arcing current Incident Energy at 85% of arcing current
  • 45.
    Analysis of AFResults • Arc Flash Analysis Scope 100s or 1000s of Buses High/Medium/Low Voltage Systems Multiple Operating Configurations Dozens of Multiple Scenarios to be considered
  • 46.
    Analysis of AFResults • Determine Which Protective Device Clears the Arc Fault Is it the first upstream device in all cases? • Determine the Locations with Special Analysis Conditions Ibf is less than 700 or higher than 106,000 Amps The bus nominal kV less than 0.208 kV The feeder source has capacity less than 125 kVA (may not have enough energy to generate the arc)
  • 47.
    Methods to Mitigatethe Incident Energy • Methods to Reduce the Fault Clearing Time Improving coordination settings of OC PDs. Type 50 protective devices (Instantaneous) Arc Flash light sensors Maintenance mode (switch) Differential protection Zone selective interlocking protection (ZSIP) • Methods to Increase the Working Distance Remote racking of breakers/Remote switching Use of Hot Sticks
  • 48.
    Methods to Mitigatethe Incident Energy • Methods to Reduce the Short-Circuit Current Current limiting fuses and circuit breakers Current limiting reactors, Isolating Transformers High resistance grounding • Methods to Reduce the Energy Exposure Arc resistant switchgear Arc shields Infrared scanning, Partial Discharge and or Corona Cameras
  • 49.
    Improving Over-Current Device CoordinationSettings • Purpose is to isolate the fault with the nearest upstream over-current protective device • Arc flash results are extremely dependent on coordination settings • Unnecessarily high time dial settings for type 51 over-current devices • Selection of fuses with faster total clearing time characteristic curves can reduce the energy significantly
  • 50.
    Arcing current  through              A  50/51‐1 Fault Clearing Time is37 cycles with current time dial settings Incident Energy released is greater than 27 cal/cm² Category 4
  • 51.
    Arcing current  through              A  50/51‐1 Fault Clearing Time =10 cycles with lower time dial settings Incident Energy released is less than 8 cal/cm² Category 2
  • 52.
    Fuse Total ClearingTime based on 3.5 kA Arc Fault
  • 53.
  • 54.
    Type 50 ProtectiveDevice • Relays with instantaneous settings • Molded case circuit breakers • Insulated case breakers • Power circuit breakers with instantaneous direct acting trip elements
  • 55.
    Type 50 PDAdvantages • Fast acting to reduce the fault clearing time since it can operate within 3 to 6 cycles • Commonly available for most MV and LV applications • Cost effective and do not require special installations • Already installed in electrical system and may only require adjustments to reduce the incident energy
  • 56.
  • 57.
    Type 50 PDDrawbacks • To achieve coordination with downstream elements, upstream source Protective Devices have longer time delays (do not have instantaneous protection) • The arcing current magnitude passing through the Type 50 protective device must be higher than the device’s instantaneous pickup setting
  • 58.
    Type 50 PDDrawbacks Selective Coordination introduces time delays
  • 59.
    Maintenance Mode • Veryfast acting trip device reduces the Fault Clearing Time (FCT) • Are designed to pickup under very low arcing current values (instantaneous pickup setting is very low) • Does not require complicated installation and will effectively protect locations downstream from the trip unit with maintenance mode
  • 60.
  • 61.
  • 62.
  • 63.
  • 64.
  • 65.
    Maintenance Mode Drawbacks •System will not have coordination during the maintenance period because of reduced instantaneous pickup settings • Does not increase equipment protection unless the maintenance mode is ON • May not protect certain zones where energized equipment tasks may be performed
  • 66.
    Zone Selective Interlocking Protection(ZSIP) • Reduced arc fault clearing times • Zone selection is accomplished by means of hard wired communication between trip units • Only the trip unit closest to the fault will operate within instantaneous since upstream units are restrained by the unit closest to the fault • Equipment and personnel arc fault protection
  • 67.
  • 68.
    Arc Faults at differentbus levels without ZSIP
  • 69.
  • 70.
    Arc Flash atdifferent bus levels using ZSIP (observe the reduced energy)
  • 71.
    ZSIP Drawbacks • Maytake a bit longer to operate than type 50 devices because of the inherent time delay required for the ZSI logic operation • If system is not coordinated, ZSIP does not necessarily force coordination and other upstream devices may operate before the device closest to the fault • Arcing current must still be above short time pickup
  • 72.
    Arc Flash LightSensors • Detect the light emitted by the arc • Very fast operation (5 to 10 ms) after the light is detected • Provide comprehensive zone or individual cubicle arc flash protection (doors open or closed) when correctly applied • Light sensor protection can be worn at time of task being performed for additional safety
  • 73.
  • 74.
    Kema-Laboratory Tests 50 kA- 500 ms Arc Fault Clearing Time
  • 75.
    Arc Flash withoutLight Sensors
  • 76.
    Kema-Laboratory Tests 50 kA- 500 ms Arc Fault
  • 77.
    Kema-Laboratory Tests 50 kAArc Fault with 50ms Fault Clearing Time
  • 78.
    Kema-Laboratory Tests 50 kAArc Fault with 50ms Fault Clearing Time
  • 79.
    Arc Flash LightSensor Drawbacks • Nuisance trips caused by light emitted from sources other than electrical arcs (can be remedied by using a more robust approach by combining over-current and light sensors) • Positioning of the light sensors poses a possible problem if they are obstructed or blocked and cannot see the light emitted by the arc
  • 80.
  • 81.
    Differential Protection • ShortArc Fault Clearing Times Differential protection can operate (relay plus breaker) within 4 to 6 cycles Relay can operate within ½ to 3 cycles • Maintain coordination between protective devices upstream and downstream from the Differential Protection Zone • Differential protection provides continuous equipment arc flash protection
  • 82.
  • 83.
  • 84.
    Fault I =13.83 kA OC Protection FCT = 0.643 sec Fault I = 51.2 kA Diff Protection FCT = 0.060 sec Bus Diff Protection vs. OC Relay
  • 85.
    Differential Protection Drawbacks •Nuisance trips caused by transformer inrush currents which are seen by relay as internal faults - the magnetizing current has particularly high second order harmonic content which can be used to restrain or desensitize the relay during energizing • Higher equipment and installation costs - relatively higher costs when compared to traditional over-current protective devices • Limited zone of protection for differential ct nodes
  • 86.
    Current Limiting Methods •Current Limiting Fuses • Current Limiting Circuit Breakers • Current Limiting Reactors • Isolating transformers • High Resistance Grounding
  • 87.
    Current Limiting Fuses •Current limiting fuses can operate in less than ½ cycle • Current limiting action is achieved as long as the magnitude of the arcing current is within the current limiting range • Current limitation curves (peak let-through curves) are needed in order to check if the fuse can limit the current • Can be very effective at reducing the incident energy if properly used
  • 88.
    Current Limiting Action tmta Ip’ Ip tc Current(peakamps) ta = tc – tm ta = Arcing Time tm = Melting Time tc = Clearing Time Ip = Peak Current Ip’ = Peak Let-thru Current Time (cycles)
  • 89.
  • 90.
    Current Limiting FuseDrawbacks • Current limiting action is achieved as long as the magnitude of the arcing current is within the current limiting range • Can be thermally damaged and have altered characteristics • Needs spares (which may be expensive) and there is not indication of the type of fault. • Energization on pre-existing fault = another blown fuse
  • 91.
    Current Limiting Reactors IsolatingTransformers • Current limiting reactors can help to reduce the available fault current and thus reduce the available energy • Isolating transformers help to reduce high kA short-circuit levels (down to less than 10 kA). • Isolating transformers add impedance between the main switchboard and the smaller panels fed from it. The short- circuit available at the switchboard may be considerably higher
  • 92.
    Increasing the WorkingDistance • Hot Sticks • Remote Racking • Remote Switching
  • 93.
    Remote Racking/Remote Switching • Areused to increase the personal space between the potential source of the arc and the electrician • Can be combined with high strength plastic shields to reduce the effects of the arc flash/blast
  • 94.
  • 95.
  • 96.
  • 97.
  • 98.
    Mitigating/Avoiding the Incident Energy •Arc Resistant Switchgear • Arc Flash Shields
  • 99.
    Arc Resistant Switchgear •Funneling or re-directing the incident energy away from the personal space • Special design and construction allows the front of the equipment to experience low levels of energy • Arc flash may still be very severe and equipment will suffer considerable damage
  • 101.
  • 102.
    Upcoming Arc FlashAnalysis Standards/Guidelines Changes
  • 103.
    Arc Flash Analysis Standards/GuidelinesChanges • How will these standards affect your AF Analysis Calculations? IEEE 1584b -2010 IEEE 1584.1-2010 IEEE 1814 NFPA 70E -2011 NESC- Utility Models / Testing for utility equipment
  • 104.
    Arc Flash Analysis Standards/GuidelinesChanges • Recent Papers on arc flash in Low Voltage Equipment • NFPA 70E and IEEE Collaboration to develop / revise current Models • DC Arc Flash Calculations
  • 105.
    NFPA 70E &IEEE1584 Collaboration Efforts “Phase I” Test Results • Refined Equations for Incident Energy Calculations ~ Vertical, Horizontal and Vertical with Barrier Conductor arrangements • Effect of Sound ~ 140 db @ 20 kA fault • Effect of Light ~ 45,000,000 LUX from Arc Fault – Bright day is about 20,000 LUX • Arc Blast Pressure Wave Effects ~ 0.9 psi 120 to 200 lbs of force
  • 106.
    IEEE 1584b -Amendments
  • 107.
    IEEE 1584b -Amendments Relay Operated Power Circuit Breaker Interrupting times Circuit Breaker Rating and Type Interrupting Time at 60 Hz (cycles) Interrupting Time at 60 Hz (seconds) Low Voltage Molded Case CB 3.0 (used to be 1.5) 0.050 (used to be 0.025) Low Voltage Insulated Case CB 3.0 0.050 Low Voltage Power CB 3.0 0.050
  • 108.
    IEEE 1584b -Amendments
  • 109.
    IEEE 1584b -Amendments
  • 110.
    IEEE 1584b -Amendments Main PD AF Results
  • 111.
    IEEE 1584b -Amendments Results with Main PD Isolation Considered
  • 112.
    Arc Flash forLV Systems Impact of Arc Flash Events with Outward Convective Flows on Worker Protection Strategies ESW2010-11 Mike Lang, Member IEEE Ken Jones Member IEEE Thomas Neal, PhD
  • 113.
    Arc Flash forLV Systems
  • 114.
    Arc Flash forLV Systems
  • 115.
    Arc Flash forLV Systems
  • 116.
    Arc Flash forLV Systems
  • 117.
    IEEE 1584.1 AnalysisGuidelines • Define what are the requirements for performing AF analysis • Defines the complexity of Systems and the experience required to perform and AF study • Educates the Engineering process (how to make conservative assumptions)
  • 118.
    IEEE 1814 Safetyby Design • Reduce the Risk by designing safer equipment • Samples of better Disconnect Switch Design • Including Technology like ZSIP into Unit Substation Design
  • 119.
    NESC – ROPfor 2012 200 Amp Meter Base Shorting Wire in Meter Base
  • 120.
    DC Arc FlashAnalysis
  • 121.
    Methodology for DCArc Flash • DC SC and Arc Flash
  • 122.
    Methodology for DCArc Flash • DC Arc Flash Basic Concepts
  • 123.
    Methodology for DCArc Flash • DC Arc Power
  • 124.
    Methodology for DCArc Flash • Maximum Power Method (2007 IEEE Electrical Safety Workshop) 2 arc arcsysm bfarc D T IV0.01IE I0.5I ×××= ×=
  • 125.
    Methodology for DCArc Flash • Detailed Theoretical Calculation Method (2009 IEEE PCIC) (Testing has confirmed the theoretical method) 88.0 12.0 )534.020( )534.020( arc g arc arcgarc I Z R IZV ×× = ×××=
  • 126.
    Methodology for DCArc Flash • V-I Characteristic Curves
  • 127.
    Methodology for DCAF • Arc Energy Equations arcarcarcarc arcarcarcarcarc dcdc tRIE RIIVP IVPower ××≈ ×=×= ×= 2 2
  • 128.
    Methodology for DCAF • DC Incident Energy Equations for Open Air and Enclosed Configurations 221 2 4 da E kE d E E arc arc s + ×= = π
  • 129.
    Methodology for DCAF • Enclosed DC Arc Fault values a and k Enclosure Width (mm) Height (mm) Depth (mm) a (mm) k Panelboard 305 356 191 100 0.127 LV Switchgear 508 508 508 400 0.312 MV Switchgear 1143 762 762 950 0.416
  • 130.
    Test System • Exampleusing the theoretical method
  • 131.
    Diff Method ResultComparison • Comparison of the Maximum Power Method vs. Theoretical Method DC Arc Flash Method Ibf dc (kA) Iarc dc (kA) Rarc (ohms ) FCT (sec ) I.E. (cal/cm2) Maximum Power 18.63 9.315 N/A 1.2 13.8 Theoretical Method 18.63 11.80 0 0.008 1.2 12.5
  • 132.
    Transient Arc FlashAnalysis for Generators
  • 133.
    Problem Description • ArcFlash Incidents near or on Generator Auxiliary Load • No Generator Circuit Breaker • Long Fault Clearing Time because of continuous generator short-circuit current contribution • Trying to determine a practical level of PPE to be used for the task • To determine a systematic method to determine the incident energy for systems with high fault current decay
  • 134.
  • 135.
  • 136.
    Analysis Techniques andAssumptions • IEEE 1584 and NFPA 70E do not provide any specific analysis method for such systems • The classic IEEE 1584 method utilizes the Bolted fault current to determine the arc fault current • The guidelines do not consider any transients or decay in the fault currents
  • 137.
    Arc Flash Analysis UtilityBreaker Operates 6 cycles after Arc Fault is detected
  • 138.
  • 139.
    Arc Flash Analysis Scenario ID ArcFlash Method Arcing Current (kA) I.E. (cal/cm2) for 2.0 sec Case 1 Half Cycle (Ia”) 21.44 51.6 Case 2 Four Cycle (Ia’) 21.33 51 Case 3 Decay Method (Ia” ~ Ia) 21.4 ~ 11.5 35.7
  • 140.
    Problems with RegularArc Flash Analysis Method • The calculation results show very high incident energy values • Results in too much PPE requirements for the task • Difficult to estimate the actual energy
  • 141.
    Benefits from TransientStability Analysis • Determine actual bolted fault current contributions • Model actual generator time constants and exciter field discharge strategies • Accurate recalculation of the bolted fault current levels for system separation • Actual response of the Excitation and Generator Controls
  • 142.
    Methods of ReducingGenerator Fault Current • Loss of Excitation • Field Discharge Resistor / Crowbar bypass system • Negative Field Forcing
  • 143.
    Exciter Model Usedfor the Simulations
  • 144.
    Field Discharge: Short-Circuit EquivalentCircuit Model for Field Discharge Simulation
  • 145.
    Field Discharge Resistor AField Discharge Resistor (FDR) is added along with the generator Time Constant (T’do)
  • 146.
    Negative Field Forcing ForNegative Field Forcing. The discharge rate is dependent on the value of the negative voltage
  • 147.
    Transient Stability Scenarios Scenario ID FieldDischarge Scheme Simulation Method Bolted Fault Current @ 2.0 sec Case 1 None TS 17.7 kA Case 2 Loss of Excitation TS 11.2 kA Case 3 FDR to with RD = RF TS 6.2 kA Case 4 Negative Field Forcing TS with UDM 0.54 kA
  • 148.
  • 149.
    Incident Energy Determinationfrom TS Results • Using Spreadsheet, MathCAD or Matlab to import the bolted fault current values from the Transient Fault Study • The IEEE 1584 2002 Empirical Equations are used • The energy is determined by integrating the incident energy results from each time step up to arbitrary time of exposure (i.e. 2.0 sec)
  • 150.
    Incident Energy Comparison Scenario ID FieldDischarge Scheme I.E. (cal/cm2) for 2.0 sec Case 1 None 40.8 Case 2 Loss of Excitation 33.1 Case 3 FDR to with RD = RF 25.7 Case 4 Negative Field Forcing 19.8
  • 151.
    Comparison Against ArcFlash I.E. (cal/cm2) for 2.0 sec (Arc Flash with TS) I.E. (cal/cm2) for 2.0 sec (Regular Arc Flash) Highest Results 40.8 51.6 Lowest Results 19.8 35.7
  • 152.
    References • Generator FieldDischarge Methods – provided by Wayne Eads of Southern Company Generation • IEEE Standard 421.5 IEEE Recommended Practice for Excitation System Models for Power System Studies • IEEE 1584 2002 • Power System Stability and Control, Prabha Kundur
  • 153.
    References • DC ArcFlash and Shock NFPA 70E ROP –Memphis Feb 18, 2010 • DC Arc Models and Incident Energy Calculations Paper No. PCIC-2009-07 – Award Winning Paper • DC Arc Hazard Assessment Phase II Copyright Material Kenectrics Inc., Report No. K-012623-RA- 0002-R00
  • 154.