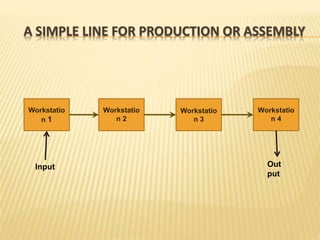
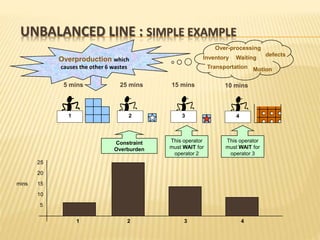
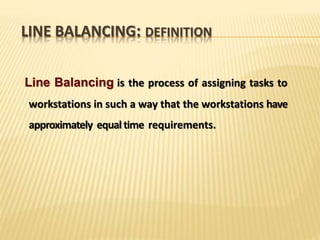
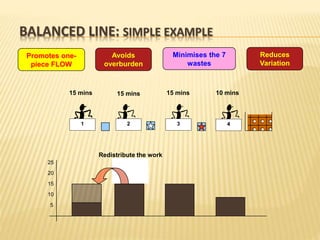
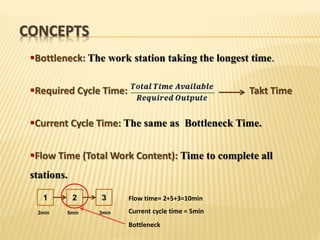
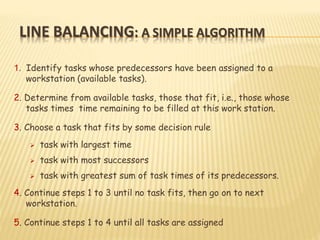
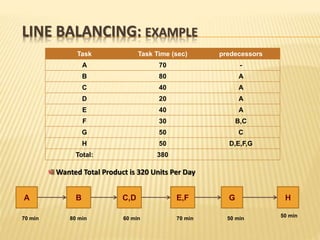
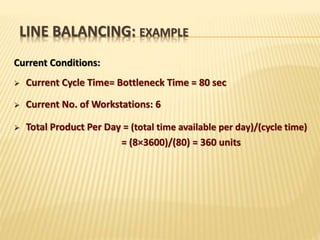
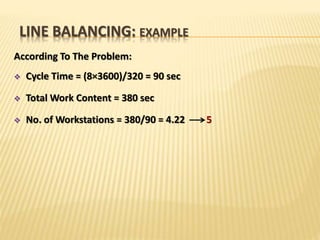
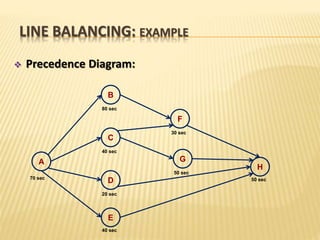
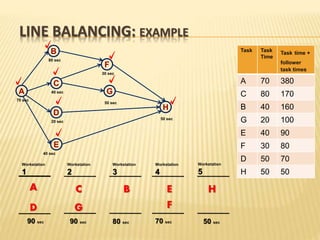
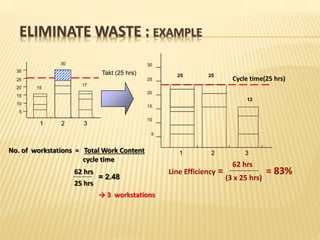
LINE BALANCING
An overview of
By: Hiwa Ghaffari
A SIMPLE LINE FOR PRODUCTION OR ASSEMBLY
Workstatio
n 1
Workstatio
n 2
Workstatio
n 3
Workstatio
n 4
Input Out
put
ACTIVITY CLASSIFICATION
Value Adding:
Any process that changes the
nature, shape or characteristics
of the product, in line with
customer requirements e.g.
machining, assembly
Non-Value Adding, but
unavoidable with current technology or
methods:
Any work carried out that does not increase
product value e.g. inspection, part movement,
tool changing, maintenance
Waste:
All other meaningless, non-essential
activities that do not add value to the
product you can eliminate immediately
e.g. looking for tools, waiting time
WASTES
Wastes are caused from:
 Transportation
 Inventory
 Motion
 Waiting
 Overproduction
 Over-processing
 Defects
(The 7 Wastes: T.I.M.W.O.O.D)
UNBALANCED LINE : SIMPLE EXAMPLE
1 2 3 4
25 mins5 mins 15 mins 10 mins
Constraint
Overburden
This operator
must WAIT for
operator 2
Overproduction which
causes the other 6 wastes
Waiting
Over-processing
Inventory
defects
Transportation Motion
This operator
must WAIT for
operator 3
5
10
15
20
25
1 2 3 4
mins
LINE BALANCING: DEFINITION
Line Balancing is the process of assigning tasks to
workstations in such a way that the workstations have
approximately equal time requirements.
LINE BALANCING: OBJECTIVES
Main Objectives:
to equalize the work load among the operators
to identify the bottleneck operation
to establish the speed of the production line
to determine the number of workstations
to determine the labor cost of production and pack out
to establish the percentage workload of each operator
to assist in plant layout
to reduce production cost
LINE BALANCING: METHODS
•There are many ways or methods for balancing the lines.
•The common thing for all this methods is:
using both the operator and the machine in the most
efficient way, at the same time providing flexibility in
production.
BALANCED LINE: SIMPLE EXAMPLE
5
10
15
20
25
Redistribute the work
1 2 3 4
15 mins15 mins 15 mins 10 mins
Promotes one-
piece FLOW
Avoids
overburden
Minimises the 7
wastes
Reduces
Variation
CONCEPTS
Bottleneck: The work station taking the longest time.
Required Cycle Time: Takt Time
Current Cycle Time: The same as Bottleneck Time.
Flow Time (Total Work Content): Time to complete all
stations.
1 2 3
2min 5min 3min
Flow time= 2+5+3=10min
Current cycle time = 5min
Bottleneck
CONCEPTS
Precedence diagram: Network showing order of tasks
and restrictions on their performance.
A
B
H
D
E
F
G
Total work content: Sum of the task times for all the
production tasks for the product.
Minimum number of work stations=
The quotient should be rounded to the next highest
integer.
9-12
LINE BALANCING: PREREQUISITES
 Determine minimum rational work elements.
(Smallest feasible division of work)
 Determine cycle time.
 Calculate the theoretical minimum number of
work stations.
 Draw Precedence Diagram
LINE BALANCING: A SIMPLE ALGORITHM
1. Identify tasks whose predecessors have been assigned to a
workstation (available tasks).
2. Determine from available tasks, those that fit, i.e., those whose
tasks times time remaining to be filled at this work station.
3. Choose a task that fits by some decision rule
 task with largest time
 task with most successors
 task with greatest sum of task times of its predecessors.
4. Continue steps 1 to 3 until no task fits, then go on to next
workstation.
5. Continue steps 1 to 4 until all tasks are assigned
LINE BALANCING: EXAMPLE
Task Task Time (sec) predecessors
A 70 -
B 80 A
C 40 A
D 20 A
E 40 A
F 30 B,C
G 50 C
H 50 D,E,F,G
Total: 380
A B C,D E,F G H
70 min 80 min 70 min 50 min60 min
50 min
Wanted Total Product is 320 Units Per Day
LINE BALANCING: EXAMPLE
Current Conditions:
 Current Cycle Time= Bottleneck Time = 80 sec
 Current No. of Workstations: 6
 Total Product Per Day = (total time available per day)/(cycle time)
= (8×3600)/(80) = 360 units
LINE BALANCING: EXAMPLE
According To The Problem:
 Cycle Time = (8×3600)/320 = 90 sec
 Total Work Content = 380 sec
 No. of Workstations = 380/90 = 4.22 5
LINE BALANCING: EXAMPLE
 Precedence Diagram:
A
B
C
D
E
F
G
H
70 sec 50 sec
50 sec
30 sec
40 sec
20 sec
40 sec
80 sec
LINE BALANCING: EXAMPLE
Task Task
Time
Task time +
follower
task times
A 70 380
C 80 170
B 40 160
G 20 100
E 40 90
F 30 80
D 50 70
H 50 50
A
B
C
D
E
F
G
H
70 sec
50 sec
50 sec
30 sec
40 sec
20 sec
40 sec
80 sec
Workstation
1
Workstation
2
Workstation
3
Workstation
5
Workstation
4
A C B E H
D
90 sec 90 sec 80 sec 70 sec 50 sec
G F
LINE BALANCING: EXAMPLE
Comparing Line Efficiency:
Line Efficiency =(Total Work Content)/(No. of Workstations ×Cycle Time)
Case 1: Line Efficiency = (380)/(6×80) = 79%
Case 1: Line Efficiency = (380)/(5×90) = 84%84%
1 min.2 min.1 min.1 min.
30/hr. 30/hr. 30/hr. 30/hr.
1 min.
1 min.
1 min.1 min.
60/hr.
30/hr. 30/hr.
60/hr.
1 min.
30/hr.
30/hr.
Bottleneck
Parallel Workstations
PARALLEL WORKSTATIONS
ELIMINATE WASTE : EXAMPLE
30
25
20
15
10
1 2 3
5
Cycle Time (25 hrs)
15
30
17
total work content = 15 + 30 + 17 = 62 hrs
Line Efficiency = = 69%
(3 x 30)
62 hrs
ELIMINATE WASTE : EXAMPLE
1 2 3
25 25
12
Cycle time(25 hrs)
30
25
20
15
10
5
Line Efficiency = = 83%
(3 x 25 hrs)
62 hrs
No. of workstations = Total Work Content
cycle time
25 hrs
62 hrs
= 2.48
→ 3 workstations
30
25
20
15
10
1 2 3
5
Takt (25 hrs)
15
30
17
Value
Added
Waste
Traditional Focus
• Work Longer-Harder-Faster
• Add People or Equipment
Lean Manufacturing
• Improve the Value
Stream to Eliminate
Waste
LEAD TIME
ELIMINATE WASTE : EXAMPLE
1 2 3
5
30
25
20
15
10
Non value added activity
Value added activity
Cycle time (25 hrs)
The operators cycle is broken down into elements.
These elements are put into three main categories, these being :
1. Working (man or machine)
2. Walking
3. Waiting
ELIMINATE WASTE : EXAMPLE
1 2 3
5
30
25
20
15
10
Operator other
freed up for
process or
improvement
team
REFRENCES
‫ی‬‫ضو‬‫ر‬‫قدس‬‫آستان‬ ‫ات‬‫ر‬‫انتشا‬‫؛‬‫تولید‬‫مدیریت‬ ‫؛‬‫شفیعی‬ ‫میر‬ ‫نصرهللا‬،‫الوانی‬‫مهدی‬‫سید‬
‫ایران‬‫صنعت‬‫و‬ ‫علم‬ ‫دانشگاه‬ ‫ات‬‫ر‬‫انتشا‬‫مان؛‬‫ز‬‫و‬‫کار‬ ‫یابی‬‫ز‬‫ار‬ ‫احمدی؛‬‫علی‬ ‫علیرضا‬

Line balancing

  • 1.
    LINE BALANCING An overviewof By: Hiwa Ghaffari
  • 2.
    A SIMPLE LINEFOR PRODUCTION OR ASSEMBLY Workstatio n 1 Workstatio n 2 Workstatio n 3 Workstatio n 4 Input Out put
  • 3.
    ACTIVITY CLASSIFICATION Value Adding: Anyprocess that changes the nature, shape or characteristics of the product, in line with customer requirements e.g. machining, assembly Non-Value Adding, but unavoidable with current technology or methods: Any work carried out that does not increase product value e.g. inspection, part movement, tool changing, maintenance Waste: All other meaningless, non-essential activities that do not add value to the product you can eliminate immediately e.g. looking for tools, waiting time
  • 4.
    WASTES Wastes are causedfrom:  Transportation  Inventory  Motion  Waiting  Overproduction  Over-processing  Defects (The 7 Wastes: T.I.M.W.O.O.D)
  • 5.
    UNBALANCED LINE :SIMPLE EXAMPLE 1 2 3 4 25 mins5 mins 15 mins 10 mins Constraint Overburden This operator must WAIT for operator 2 Overproduction which causes the other 6 wastes Waiting Over-processing Inventory defects Transportation Motion This operator must WAIT for operator 3 5 10 15 20 25 1 2 3 4 mins
  • 6.
    LINE BALANCING: DEFINITION LineBalancing is the process of assigning tasks to workstations in such a way that the workstations have approximately equal time requirements.
  • 7.
    LINE BALANCING: OBJECTIVES MainObjectives: to equalize the work load among the operators to identify the bottleneck operation to establish the speed of the production line to determine the number of workstations to determine the labor cost of production and pack out to establish the percentage workload of each operator to assist in plant layout to reduce production cost
  • 8.
    LINE BALANCING: METHODS •Thereare many ways or methods for balancing the lines. •The common thing for all this methods is: using both the operator and the machine in the most efficient way, at the same time providing flexibility in production.
  • 9.
    BALANCED LINE: SIMPLEEXAMPLE 5 10 15 20 25 Redistribute the work 1 2 3 4 15 mins15 mins 15 mins 10 mins Promotes one- piece FLOW Avoids overburden Minimises the 7 wastes Reduces Variation
  • 10.
    CONCEPTS Bottleneck: The workstation taking the longest time. Required Cycle Time: Takt Time Current Cycle Time: The same as Bottleneck Time. Flow Time (Total Work Content): Time to complete all stations. 1 2 3 2min 5min 3min Flow time= 2+5+3=10min Current cycle time = 5min Bottleneck
  • 11.
    CONCEPTS Precedence diagram: Networkshowing order of tasks and restrictions on their performance. A B H D E F G Total work content: Sum of the task times for all the production tasks for the product. Minimum number of work stations= The quotient should be rounded to the next highest integer.
  • 12.
    9-12 LINE BALANCING: PREREQUISITES Determine minimum rational work elements. (Smallest feasible division of work)  Determine cycle time.  Calculate the theoretical minimum number of work stations.  Draw Precedence Diagram
  • 13.
    LINE BALANCING: ASIMPLE ALGORITHM 1. Identify tasks whose predecessors have been assigned to a workstation (available tasks). 2. Determine from available tasks, those that fit, i.e., those whose tasks times time remaining to be filled at this work station. 3. Choose a task that fits by some decision rule  task with largest time  task with most successors  task with greatest sum of task times of its predecessors. 4. Continue steps 1 to 3 until no task fits, then go on to next workstation. 5. Continue steps 1 to 4 until all tasks are assigned
  • 14.
    LINE BALANCING: EXAMPLE TaskTask Time (sec) predecessors A 70 - B 80 A C 40 A D 20 A E 40 A F 30 B,C G 50 C H 50 D,E,F,G Total: 380 A B C,D E,F G H 70 min 80 min 70 min 50 min60 min 50 min Wanted Total Product is 320 Units Per Day
  • 15.
    LINE BALANCING: EXAMPLE CurrentConditions:  Current Cycle Time= Bottleneck Time = 80 sec  Current No. of Workstations: 6  Total Product Per Day = (total time available per day)/(cycle time) = (8×3600)/(80) = 360 units
  • 16.
    LINE BALANCING: EXAMPLE AccordingTo The Problem:  Cycle Time = (8×3600)/320 = 90 sec  Total Work Content = 380 sec  No. of Workstations = 380/90 = 4.22 5
  • 17.
    LINE BALANCING: EXAMPLE Precedence Diagram: A B C D E F G H 70 sec 50 sec 50 sec 30 sec 40 sec 20 sec 40 sec 80 sec
  • 18.
    LINE BALANCING: EXAMPLE TaskTask Time Task time + follower task times A 70 380 C 80 170 B 40 160 G 20 100 E 40 90 F 30 80 D 50 70 H 50 50 A B C D E F G H 70 sec 50 sec 50 sec 30 sec 40 sec 20 sec 40 sec 80 sec Workstation 1 Workstation 2 Workstation 3 Workstation 5 Workstation 4 A C B E H D 90 sec 90 sec 80 sec 70 sec 50 sec G F
  • 19.
    LINE BALANCING: EXAMPLE ComparingLine Efficiency: Line Efficiency =(Total Work Content)/(No. of Workstations ×Cycle Time) Case 1: Line Efficiency = (380)/(6×80) = 79% Case 1: Line Efficiency = (380)/(5×90) = 84%84%
  • 20.
    1 min.2 min.1min.1 min. 30/hr. 30/hr. 30/hr. 30/hr. 1 min. 1 min. 1 min.1 min. 60/hr. 30/hr. 30/hr. 60/hr. 1 min. 30/hr. 30/hr. Bottleneck Parallel Workstations PARALLEL WORKSTATIONS
  • 21.
    ELIMINATE WASTE :EXAMPLE 30 25 20 15 10 1 2 3 5 Cycle Time (25 hrs) 15 30 17 total work content = 15 + 30 + 17 = 62 hrs Line Efficiency = = 69% (3 x 30) 62 hrs
  • 22.
    ELIMINATE WASTE :EXAMPLE 1 2 3 25 25 12 Cycle time(25 hrs) 30 25 20 15 10 5 Line Efficiency = = 83% (3 x 25 hrs) 62 hrs No. of workstations = Total Work Content cycle time 25 hrs 62 hrs = 2.48 → 3 workstations 30 25 20 15 10 1 2 3 5 Takt (25 hrs) 15 30 17
  • 23.
    Value Added Waste Traditional Focus • WorkLonger-Harder-Faster • Add People or Equipment Lean Manufacturing • Improve the Value Stream to Eliminate Waste LEAD TIME
  • 24.
    ELIMINATE WASTE :EXAMPLE 1 2 3 5 30 25 20 15 10 Non value added activity Value added activity Cycle time (25 hrs) The operators cycle is broken down into elements. These elements are put into three main categories, these being : 1. Working (man or machine) 2. Walking 3. Waiting
  • 25.
    ELIMINATE WASTE :EXAMPLE 1 2 3 5 30 25 20 15 10 Operator other freed up for process or improvement team
  • 27.
    REFRENCES ‫ی‬‫ضو‬‫ر‬‫قدس‬‫آستان‬ ‫ات‬‫ر‬‫انتشا‬‫؛‬‫تولید‬‫مدیریت‬ ‫؛‬‫شفیعی‬‫میر‬ ‫نصرهللا‬،‫الوانی‬‫مهدی‬‫سید‬ ‫ایران‬‫صنعت‬‫و‬ ‫علم‬ ‫دانشگاه‬ ‫ات‬‫ر‬‫انتشا‬‫مان؛‬‫ز‬‫و‬‫کار‬ ‫یابی‬‫ز‬‫ار‬ ‫احمدی؛‬‫علی‬ ‫علیرضا‬