
Recommended
More Related Content
What's hot
What's hot (20)
Similar to Aaj ka trend 05.08.16
Similar to Aaj ka trend 05.08.16 (20)
Recently uploaded
Recently uploaded (20)
Aaj ka trend 05.08.16
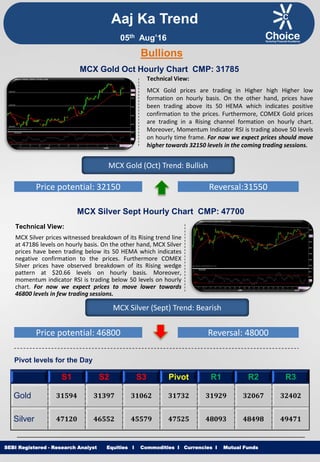
- 1. Equities I Commodities I Currencies I Mutual Funds Aaj Ka Trend Technical View: MCX Gold prices are trading in Higher high Higher low formation on hourly basis. On the other hand, prices have been trading above its 50 HEMA which indicates positive confirmation to the prices. Furthermore, COMEX Gold prices are trading in a Rising channel formation on hourly chart. Moreover, Momentum Indicator RSI is trading above 50 levels on hourly time frame. For now we expect prices should move higher towards 32150 levels in the coming trading sessions. SEBI Registered - Research Analyst Equities I Commodities I Currencies I Mutual Funds Bullions MCX Gold Oct Hourly Chart CMP: 31785 MCX Gold (Oct) Trend: Bullish Price potential: 32150 Reversal:31550 MCX Silver Sept Hourly Chart CMP: 47700 Technical View: MCX Silver prices witnessed breakdown of its Rising trend line at 47186 levels on hourly basis. On the other hand, MCX Silver prices have been trading below its 50 HEMA which indicates negative confirmation to the prices. Furthermore COMEX Silver prices have observed breakdown of its Rising wedge pattern at $20.66 levels on hourly basis. Moreover, momentum indicator RSI is trading below 50 levels on hourly chart. For now we expect prices to move lower towards 46800 levels in few trading sessions. MCX Silver (Sept) Trend: Bearish Price potential: 46800 Reversal: 48000 Pivot levels for the Day S1 S2 S3 Pivot R1 R2 R3 Gold 31594 31397 31062 31732 31929 32067 32402 Silver 47120 46552 45579 47525 48093 48498 49471 05th Aug’16
- 2. Equities I Commodities I Currencies I Mutual Funds Technical View: MCX Copper prices have witnessed breakdown of its Rectangle pattern at 324.40 levels on hourly basis. Counter continued to trade lower in yesterdays trading sessions. Furthermore, counter is trading below its 21 HEMA on hourly time frame. On the other hand, momentum indicator RSI has drift below 50 levels on hourly chart. For now we expect prices to move lower towards 315 levels in coming trading sessions. SEBI Registered - Research Analyst Equities I Commodities I Currencies I Mutual Funds MCX Copper Aug hourly Chart CMP: 322.45 MCX Copper (Aug) Trend: Bearish Price potential: 315 Reversal: 327 MCX Crude Oil Aug. Hourly Chart CMP: 2812 Technical View: MCX Crude Oil prices continued to trade higher after witnessing breakout of its Falling channel formation on hourly basis. On the other hand prices have been trading above its 21 HEMA on hourly chart. In Addition, COMEX Crude oil prices have observed breakout of its Falling channel formation at $40.64 levels on hourly chart. Moreover, Momentum indicator RSI is trading above 60 on hourly chart. For now we expect prices to move higher towards 2850 levels in coming trading sessions. MCX Crude Oil (Aug) Trend: Bullish Price potential: 2850 Reversal: 2720 Pivot levels for the Day S1 S2 S3 Pivot R1 R2 R3 Copper 319.4 316.7 311.1 322.3 325.0 327.9 333.5 Crude 2734 2698 2643 2753 2789 2808 2863 Base Metal Energy Aaj Ka Trend 05th Aug’16
- 3. Equities I Commodities I Currencies I Mutual FundsSEBI Registered - Research Analyst Equities I Commodities I Currencies I Mutual Funds Other Base Metals & Energy S1 S2 S3 Pivot R1 R2 R3 Trend Copper 319.4 316.7 311.1 322.3 325.0 327.9 333.5 Aluminum 108.1 107.4 105.7 109.0 109.7 110.7 112.3 Lead 119.3 118.5 116.9 120.2 120.9 121.8 123.5 Nickel 700.7 691.4 674.7 708.1 717.4 724.8 741.5 Zinc 150.2 149.4 147.5 151.3 152.1 153.2 155.1 Natural Gas 188.8 186.0 180.9 191.1 193.9 196.2 201.3 Fundamental News: Gold prices added to overnight losses in European trade on Thursday, as the U.S. dollar strengthened with investors focused on the Bank of England's policy announcement later in the session. "A perfect storm" in markets has left investors scrambling to add gold to their portfolios for protection, according to the World Gold Council. Gold prices erased overnight losses in North American trade on Thursday, turning higher after the Bank of England delivered its first rate cut in seven years and announced more measures to stimulate the economy in a bid to ward off recession following Britain's vote in June to leave the European Union. Oil prices edged lower in European trade on Thursday, after rallying more than 3% overnight after a larger-than- expected gasoline draw eased concerns about global supply glut. Oil turned lower Thursday on profit-taking after bouncing off four-month lows. U.S. stockpile figures had helped oil surge after easing some glut concerns. Oil prices were back under pressure in North American trade on Thursday, giving back some of the prior session's strong gains as investors remain fixated on a global glut of crude supplies. This week’s comic touches on the recent decline in the oil market, which has taken prices back below the $40- level for the first time since April earlier this week, mainly due to concerns over a glut in oil supplies. U.S. natural gas futures jumped in North America trade on Thursday, after data showed that natural gas supplies in storage in the U.S. fell unexpectedly last week, as a recent heat wave prompted households to ramp up their air conditioning. Aaj Ka Trend 05th Aug’16
- 4. Equities I Commodities I Currencies I Mutual FundsSEBI Registered - Research Analyst Equities I Commodities I Currencies I Mutual Funds International Market Commodity Closing Price Gold 1367.35 Silver 20.38 Crude Oil 41.55 Brent Crude Oil 43.87 Natural Gas 2.81 COMEX/NYMEX/ICE ( Precious Metals & Energy) Currency & Commodity Index Currency (Spot) Current Price USD / INR 66.83 Dollar Index 95.69 EUR / USD 1.11 CRB Index* 181.34 Closing as on 04.08.16 *Closing as on 04.08.16 LME (Base Metals) ( $ per tones) Commodity Closing Price Copper 4799 Aluminum 1681 Zinc 2260 Lead 1789 Nickel 10531 SHFE (Base Metals) (Yuan per tones) Commodity Closing Price Copper 37650 Aluminum 12000 Zinc 17050 Lead 13680 Closing as on 04.08.16 Closing as on 04.08.16 LME INVENTORY DATA Aaj Ka Trend 29-July-16 01-Aug-16 02-Aug-16 03-Aug-16 04-Aug-16 Aluminium -8825 -9650 -9250 -6300 -6775 Copper 725 625 -425 -2300 1950 Lead -50 -50 -50 1650 -500 Nickel -1524 -120 -204 -372 -630 Zinc -1400 -1425 -50 -525 -550 05th Aug’16
- 5. Equities I Commodities I Currencies I Mutual Funds This is solely for information of clients of Choice Broking and does not construe to be an investment advice. It is also not intended as an offer or solicitation for the purchase and sale of any financial instruments. Any action taken by you on the basis of the information contained herein is your responsibility alone and Choice Broking its subsidiaries or its employees or associates will not be liable in any manner for the consequences of such action taken by you. We have exercised due diligence in checking the correctness and authenticity of the information contained in this recommendation, but Choice Broking or any of its subsidiaries or associates or employees shall not be in any way responsible for any loss or damage that may arise to any person from any inadvertent error in the information contained in this recommendation or any action taken on basis of this information. Technical analysis studies market psychology, price patterns and volume levels. It is used to forecast future price and market movements. Technical analysis is complementary to fundamental analysis and news sources. The recommendations issued herewith might be contrary to recommendations issued by Choice Broking in the company research undertaken as the recommendations stated in this report is derived purely from technical analysis. Choice Broking has based this document on information obtained from sources it believes to be reliable but which it has not independently verified; Choice Broking makes no guarantee, representation or warranty and accepts no responsibility or liability as to its accuracy or completeness. The opinions contained within the report are based upon publicly available information at the time of publication and are subject to change without notice. The information and any disclosures provided herein are in summary form and have been prepared for informational purposes. The recommendations and suggested price levels are intended purely for trading purposes. The recommendations are valid for the day of the report however trading trends and volumes might vary substantially on an intraday basis and the recommendations may be subject to change. The information and any disclosures provided herein may be considered confidential. Any use, distribution, modification, copying, forwarding or disclosure by any person is strictly prohibited. The information and any disclosures provided herein do not constitute a solicitation or offer to purchase or sell any security or other financial product or instrument. The current performance may be unaudited. Past performance does not guarantee future returns. There can be no assurance that investments will achieve any targeted rates of return, and there is no guarantee against the loss of your entire investment. POTENTIAL CONFLICT OF INTEREST DISCLOSURE (as on date of report) Disclosure of interest statement – • Analyst interest of the stock /Instrument(s): - No. • Firm interest of the stock / Instrument (s): - No. Disclaimer Contact Us Amit Pathania Research Associate amit.pathania@choiceindia.com Rohan Patil Research Associate rohan.patil@choiceindia.com www.choiceindia.comcustomercare@choiceindia.com SEBI Registered - Research Analyst Equities I Commodities I Currencies I Mutual Funds Aaj Ka Trend 05th Aug’16 Neeraj Yadav Research Advisor neeraj.yadav@choiceindia.com Anish Vyas Senior Research Associate anish.vyas@choiceindia.com Amit Pathania Digitally signed by Amit Pathania DN: cn=Amit Pathania, o=Choice Equity Broking Pvt. ltd, ou=Research Department, email=amit.pathania@choiceindia.com, c=IN Date: 2016.08.05 08:55:20 +05'30'