1. 4QFY2010 Result Update I Retail
` May 4, 2010
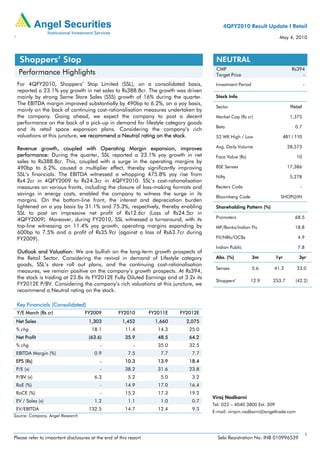
Shoppers’ Stop NEUTRAL
CMP Rs394
Performance Highlights Target Price -
For 4QFY2010, Shoppers’ Stop Limited (SSL), on a consolidated basis, Investment Period -
reported a 23.1% yoy growth in net sales to Rs388.8cr. The growth was driven
mainly by strong Same Store Sales (SSS) growth of 16% during the quarter. Stock Info
The EBITDA margin improved substantially by 490bp to 6.2%, on a yoy basis,
Sector Retail
mainly on the back of continuing cost-rationalisation measures undertaken by
the company. Going ahead, we expect the company to post a decent Market Cap (Rs cr) 1,375
performance on the back of a pick-up in demand for lifestyle category goods
Beta 0.7
and its retail space expansion plans. Considering the company’s rich
valuations at this juncture, we recommend a Neutral rating on the stock. 52 WK High / Low 481 / 110
Revenue growth, coupled with Operating Margin expansion, improves Avg. Daily Volume 28,573
performance: During the quarter, SSL reported a 23.1% yoy growth in net Face Value (Rs) 10
sales to Rs388.8cr. This, coupled with a surge in the operating margins by
490bp to 6.2%, caused a multiplier effect, thereby significantly improving BSE Sensex 17,386
SSL’s financials. The EBITDA witnessed a whopping 475.8% yoy rise from Nifty 5,278
Rs4.2cr in 4QFY2009 to Rs24.3cr in 4QFY2010. SSL’s cost-rationalisation
measures on various fronts, including the closure of loss-making formats and Reuters Code -
savings in energy costs, enabled the company to witness the surge in its
Bloomberg Code SHOP@IN
margins. On the bottom-line front, the interest and depreciation burden
lightened on a yoy basis by 31.1% and 75.3%, respectively, thereby enabling Shareholding Pattern (%)
SSL to post an impressive net profit of Rs12.6cr (Loss of Rs24.5cr in
4QFY2009). Moreover, during FY2010, SSL witnessed a turnaround, with its Promoters 68.5
top-line witnessing an 11.4% yoy growth, operating margins expanding by MF/Banks/Indian FIs 18.8
600bp to 7.5% and a profit of Rs35.9cr (against a loss of Rs63.7cr during
FY2009). FII/NRIs/OCBs 4.9
Indian Public 7.8
Outlook and Valuation: We are bullish on the long-term growth prospects of
the Retail Sector. Considering the revival in demand of Lifestyle category Abs. (%) 3m 1yr 3yr
goods, SSL’s store roll out plans, and the continuing cost-rationalisation
Sensex 5.6 41.2 23.0
measures, we remain positive on the company’s growth prospects. At Rs394,
the stock is trading at 23.8x its FY2012E Fully Diluted Earnings and at 3.2x its
Shoppers’ 12.9 253.7 (42.2)
FY2012E P/BV. Considering the company’s rich valuations at this juncture, we
recommend a Neutral rating on the stock.
Key Financials (Consolidated)
Y/E March (Rs cr) FY2009 FY2010 FY2011E FY2012E
Net Sales 1,303 1,452 1,660 2,075
% chg 18.1 11.4 14.3 25.0
Net Profit (63.6) 35.9 48.5 64.2
% chg - - 35.0 32.5
EBITDA Margin (%) 0.9 7.5 7.7 7.7
EPS (Rs) - 10.3 13.9 18.4
P/E (x) - 38.2 31.6 23.8
P/BV (x) 6.3 5.2 5.0 3.2
RoE (%) - 14.9 17.0 16.4
RoCE (%) - 15.2 17.3 19.2
Viraj Nadkarni
EV / Sales (x) 1.2 1.1 1.0 0.7
Tel: 022 – 4040 3800 Ext: 309
EV/EBITDA 132.5 14.7 12.4 9.3
E-mail: virajm.nadkarni@angeltrade.com
Source: Company, Angel Research
1
Please refer to important disclosures at the end of this report Sebi Registration No: INB 010996539
2. Shoppers’ Stop I 4QFY2010 Result Update
Exhibit 1: 4QFY2010 Performance
Y/E March (Rs cr) 4QFY10 4QFY09 % chg FY10 FY09 % chg
Net Sales 388.8 315.8 23.1 1,452.1 1,303.4 11.4
Consumption of RM 251.8 209.0 20.5 902.2 814.7 10.7
(% of sales) 64.8 66.2 62.1 62.5
Staff Costs 30.0 17.6 70.4 92.0 95.0 (3.2)
(% to sales) 7.7 5.6 6.3 7.3
Selling and Admin Exp 42.7 48.9 (12.6) 194.5 236.6 (17.8)
(% to sales) 11.0 15.5 13.4 18.2
Other expenses 40.1 36.1 11.1 154.1 137.1 12.4
(% to sales) 10.3 11.4 10.6 10.5
Total Expenditure 364.6 311.6 17.0 1,342.8 1,283.4 4.6
Operating Profit 24.3 4.2 475.8 109.3 20.0 445.8
OPM 6.2 1.3 7.5 1.5
Interest 3.5 5.1 (31.1) 19.06 25.3 (24.7)
Depreciation 7.0 28.2 (75.3) 38.07 76.8 (50.4)
Other Income - - - - -
PBT (excl. Extr. Items) 13.8 (29.1) - 52.2 (82.1) -
Extr. Income/(Expense) - - - -
PBT (incl. Extr. Items) 13.8 (29.1) - 52.2 (82.1) -
(% of Sales) 3.5 - 3.6 -
Provision for Taxation 1.2 2.7 (55.9) 16.4 (0.1) -
(% of PBT) 8.5 - 31.4 0.1
Minority Interest 0.0 (7.2) 0.1 18.3
Reported PAT 12.6 (24.5) - 35.9 (63.7) -
PATM 3.2 - 2.5 -
Equity shares (cr) 34.9 34.9 34.9 34.9
EPS (Rs) 3.6 - - 10.3 - -
Source: Company, Angel Research
Key Business Highlights
Net Sales surge by 23.1%; Same Stores Sales (SSS) growth up 16%: SSL, on a
consolidated basis, reported a 23.1% yoy growth in net sales to Rs388.8cr. During
the quarter, the company witnessed SSS growth of 16%, with stores over 5 years
seeing a 9% increase, and stores with less than 5 years of operations growing by
28%. The SSS growth was higher primarily due to an increase in volumes in same
stores by 13.2%. On an overall basis, the transaction size improved by 11.4% and
the average selling price was up by ~2.9%, while customer entry improved by 1%
during the quarter. In 4QFY2010, SSL added 2 outlets of its Shoppers Stop
departmental store, 3 outlets of Crossword Book Stores, while the Mother Care at
Ahmadabad was shutdown. With these additions, the total retail space has been
expanded to 2.05m sq ft across 30 Shoppers Stop, 4 Home Stops, 21 Mother Cares,
12 MAC & Cliniques, 3 Estee Lauders, 2 Airport stores, 33 Crossword stores and 1
Arcelia.
May 4, 2010 2
3. Shoppers’ Stop I 4QFY2010 Result Update
Exhibit 2: Net Sales Growth Trend
450 25
400 20
350
15
300
(Rs cr)
250 10
(%)
200 5
150
-
100
50 (5)
- (10)
4QFY2009 1QFY2010 2QFY2010 3QFY2010 4QFY2010
Net Sales (LHS) % Growth (RHS)
Source: Company, Angel Research
Operating Margins expand by 490bp yoy in 4QFY2010: SSL witnessed a 12%
growth in private label sales during the quarter. This, along with several cost-cutting
measures on various fronts, including the closure of loss-making formats and
savings in energy costs, over the past few months, has enabled the company to post
healthy margins. The EBITDA witnessed a whopping 475.8% yoy rise from Rs4.2cr in
4QFY2009 to Rs24.3cr in 4QFY2010. The EBITDA margin improved by 490bp from
1.3% in 4QFY2009 to 6.2% in 4QFY2010, which was above our estimates.
Exhibit 3: EBITDA and Operating Margins
55 11.2 12
45 10
35 8
6.6
6.2
(Rs cr)
(%)
25 4.8 6
15 4
5 1.3 2
(5) 4QFY2009 1QFY2010 2QFY2010 3QFY2010 4QFY2010 -
EBIDTA (LHS) Operating profit % (RHS)
Source: Company, Angel Research
Turnaround on the PAT front: SSL’s Bottom-line improved significantly, with the
company posting a profit of Rs12.6cr in 4QFY2010, against a loss of Rs24.5cr in
4QFY2009. The improvement in the top-line, coupled with operating margin
enhancement, percolated to the bottom-line. Another factor contributing to the
significant improvement in the bottom-line was the lower depreciation and interest
charges during the quarter (on a yoy basis). SSL changed its depreciation accounting
policy from April 1, 2009, in order to bring it in line with the industry trends and to
make it less aggressive. The interest burden lightened during the quarter by 31.1%
yoy to Rs3.5cr, due to lower dependence on borrowed funds. As a result, SSL
reported Net Profit margins of 3.2%, against a loss on the PAT front in 4QFY2009.
May 4, 2010 3
4. Shoppers’ Stop I 4QFY2010 Result Update
Exhibit 4: Net Profit Trend and Net Profit Margins
20
15
10
2.3 3.5 3.2
5
0.3
-
4QFY2009
1QFY2010
2QFY2010
3QFY2010
4QFY2010
(5)
(10)
-7.8
(15)
(20)
(25)
Adjusted Net Profit NP margin%
(30)
Source: Company, Angel Research
FY2010 Revenues up by 11.4%; Turnaround on the PAT front: For the year ended
FY2010, SSL witnessed an 11.4% rise in revenues to Rs1,452.1cr (Rs1,303.4cr in
FY2009). On the EBIDTA front, the company witnessed a significant improvement of
446% yoy, as it reaped the rewards of cost-rationalisation initiatives taken during the
year. Staff costs and selling expenses declined by 3.2% and 17.8%, respectively, on
a yoy basis. Consequently, the EBITDA margins improved by 600bp to 7.5% (1.5%
in FY2009), with the EBITDA witnessing a growth of 446% yoy to Rs109.3cr (Rs20cr
in FY2009). SSL changed its depreciation accounting policy from April 1, 2009, in
order to bring it in line with the industry trends and to make it less aggressive. The
depreciation cost declined by 50.4% yoy to Rs38.1cr. The interest burden lightened
in FY2010 by 24.7% yoy to Rs19.1cr, due to lower dependence on borrowed funds.
As a result, SSL witnessed a turnaround on the bottom-line front, reporting a Net
Profit of Rs35.9cr in FY2010 (against a loss of Rs63.7cr in FY2009).
Other Developments:
• Continuing with its expansion plans, SSL plans to roll-out 18 new departmental
store formats in the next 2-3 years
• SSL has approved the acquisition of an additional 32% stake in Hypercity, thereby
taking the total stake to 51% (from 19% currently).
Outlook and Valuation
We are bullish on the long-term growth prospects of the Retail Sector. We expect
Organised Retail, especially lifestyle retailing, to continue posting a decent
performance, going ahead. Considering SSL’s store roll out plans, improved SSS
growth expectation and the continuing cost-rationalisation measures, we remain
positive on the company’s growth prospects. At Rs394, the stock is trading at 23.8x
its FY2012E Fully Diluted Earnings and at 3.2x its FY2012E P/BV. Considering the
company’s rich valuations at this juncture, we recommend a Neutral rating on the
stock.
May 4, 2010 4
5. Shoppers’ Stop I 4QFY2010 Result Update
Exhibit 5: One year forward P/BV band
800
700
8x
600
500
(Share Price Rs)
400 5x
300
3x
200
100
1x
0
May-05
Jan-06
May-06
Jan-07
May-07
Jan-08
May-08
Jan-09
May-09
Jan-10
Sep-05
Sep-06
Sep-07
Sep-08
Sep-09
Source: Company, Angel Research
May 4, 2010 5
9. Shoppers’ Stop I 4QFY2010 Result Update
Research Team Tel: 022-4040 3800 E-mail: research@angeltrade.com Website: www.angeltrade.com
DISCLAIMER
This document is solely for the personal information of the recipient, and must not be singularly used as the basis of any investment decision. Nothing in this
document should be construed as investment or financial advice. Each recipient of this document should make such investigations as they deem necessary to
arrive at an independent evaluation of an investment in the securities of the companies referred to in this document (including the merits and risks involved),
and should consult their own advisors to determine the merits and risks of such an investment.
Angel Securities Limited, its affiliates, directors, its proprietary trading and investment businesses may, from time to time, make investment decisions that are
inconsistent with or contradictory to the recommendations expressed herein. The views contained in this document are those of the analyst, and the company
may or may not subscribe to all the views expressed within.
Reports based on technical and derivative analysis center on studying charts of a stock's price movement, outstanding positions and trading volume, as
opposed to focusing on a company's fundamentals and, as such, may not match with a report on a company's fundamentals.
The information in this document has been printed on the basis of publicly available information, internal data and other reliable sources believed to be true,
and are for general guidance only. Angel Securities Limited has not independently verified all the information contained within this document. Accordingly,
we cannot testify, nor make any representation or warranty, express or implied, to the accuracy, contents or data contained within this document. While
Angel Securities Limited endeavours to update on a reasonable basis the information discussed in this material, there may be regulatory, compliance, or
other reasons that prevent us from doing so.
This document is being supplied to you solely for your information, and its contents, information or data may not be reproduced, redistributed or passed on,
directly or indirectly.
Angel Securities Limited and its affiliates may seek to provide or have engaged in providing corporate finance, investment banking or other advisory services
in a merger or specific transaction to the companies referred to in this report, as on the date of this report or in the past.
Neither Angel Securities Limited nor its directors, employees and affiliates shall be liable for any loss or damage that may arise from or in connection with the
use of this information.
Note: Please refer to the important `Stock Holding Disclosure' report on the Angel website (Research Section).
Disclosure of Interest Statement Shoppers’ Stop
1. Analyst ownership of the stock No
2. Angel and its Group companies ownership of the stock No
3. Angel and its Group companies’ Directors ownership of the stock No
4. Broking relationship with company covered No
Note: We have not considered any Exposure below Rs 1 lakh for Angel and its Group companies.
Address: Acme Plaza, ‘A’ Wing, 3rd Floor, M.V. Road, Opp. Sangam Cinema, Andheri (E), Mumbai - 400 059.
Tel : (022) 3952 4568 / 4040 3800
Angel Broking Ltd: BSE Sebi Regn No : INB 010996539 / CDSL Regn No: IN - DP - CDSL - 234 - 2004 / PMS Regn Code: PM/INP000001546 Angel Securities Ltd:BSE: INB010994639/INF010994639 NSE:
INB230994635/INF230994635 Membership numbers: BSE 028/NSE:09946
Angel Capital & Debt Market Ltd: INB 231279838 / NSE FNO: INF 231279838 / NSE Member code -12798 Angel Commodities Broking (P) Ltd: MCX Member ID: 12685 / FMC Regn No: MCX / TCM /
CORP / 0037 NCDEX : Member ID 00220 / FMC Regn No: NCDEX / TCM / CORP / 0302
May 4, 2010 9